Research cruises are a fundamental part of the cryospheric sciences. As the Arctic warms, the systems that shape our world look much different from one season to the next, making it more critical than ever to measure the changes of our icy world. Here, three early-career researchers share insights from a cruise they took part of this summer aboard the RRS Sir David Attenborough as part of a British Antarctic Survey campaign.
What is GIANT and why go all the way to the Arctic?
This summer, we took part in a ship-based fieldwork campaign for GIANT (Greenland Ice sheet to AtlaNtic Tipping points from ice loss). This is a UK-led project, funded by the Advanced Research and Inventions Agency, which aims to explore how glaciers in Greenland (Kalaallit Nunaat) melt and how that affects global ocean and climate systems. A key objective for GIANT is to improve the modelling of ice-sheet ocean interactions in narrow fjords along the ice sheet margins, and by doing so, to better represent the complex processes and feedbacks of the changing Greenland Ice Sheet in climate simulations to help predict future ice loss.
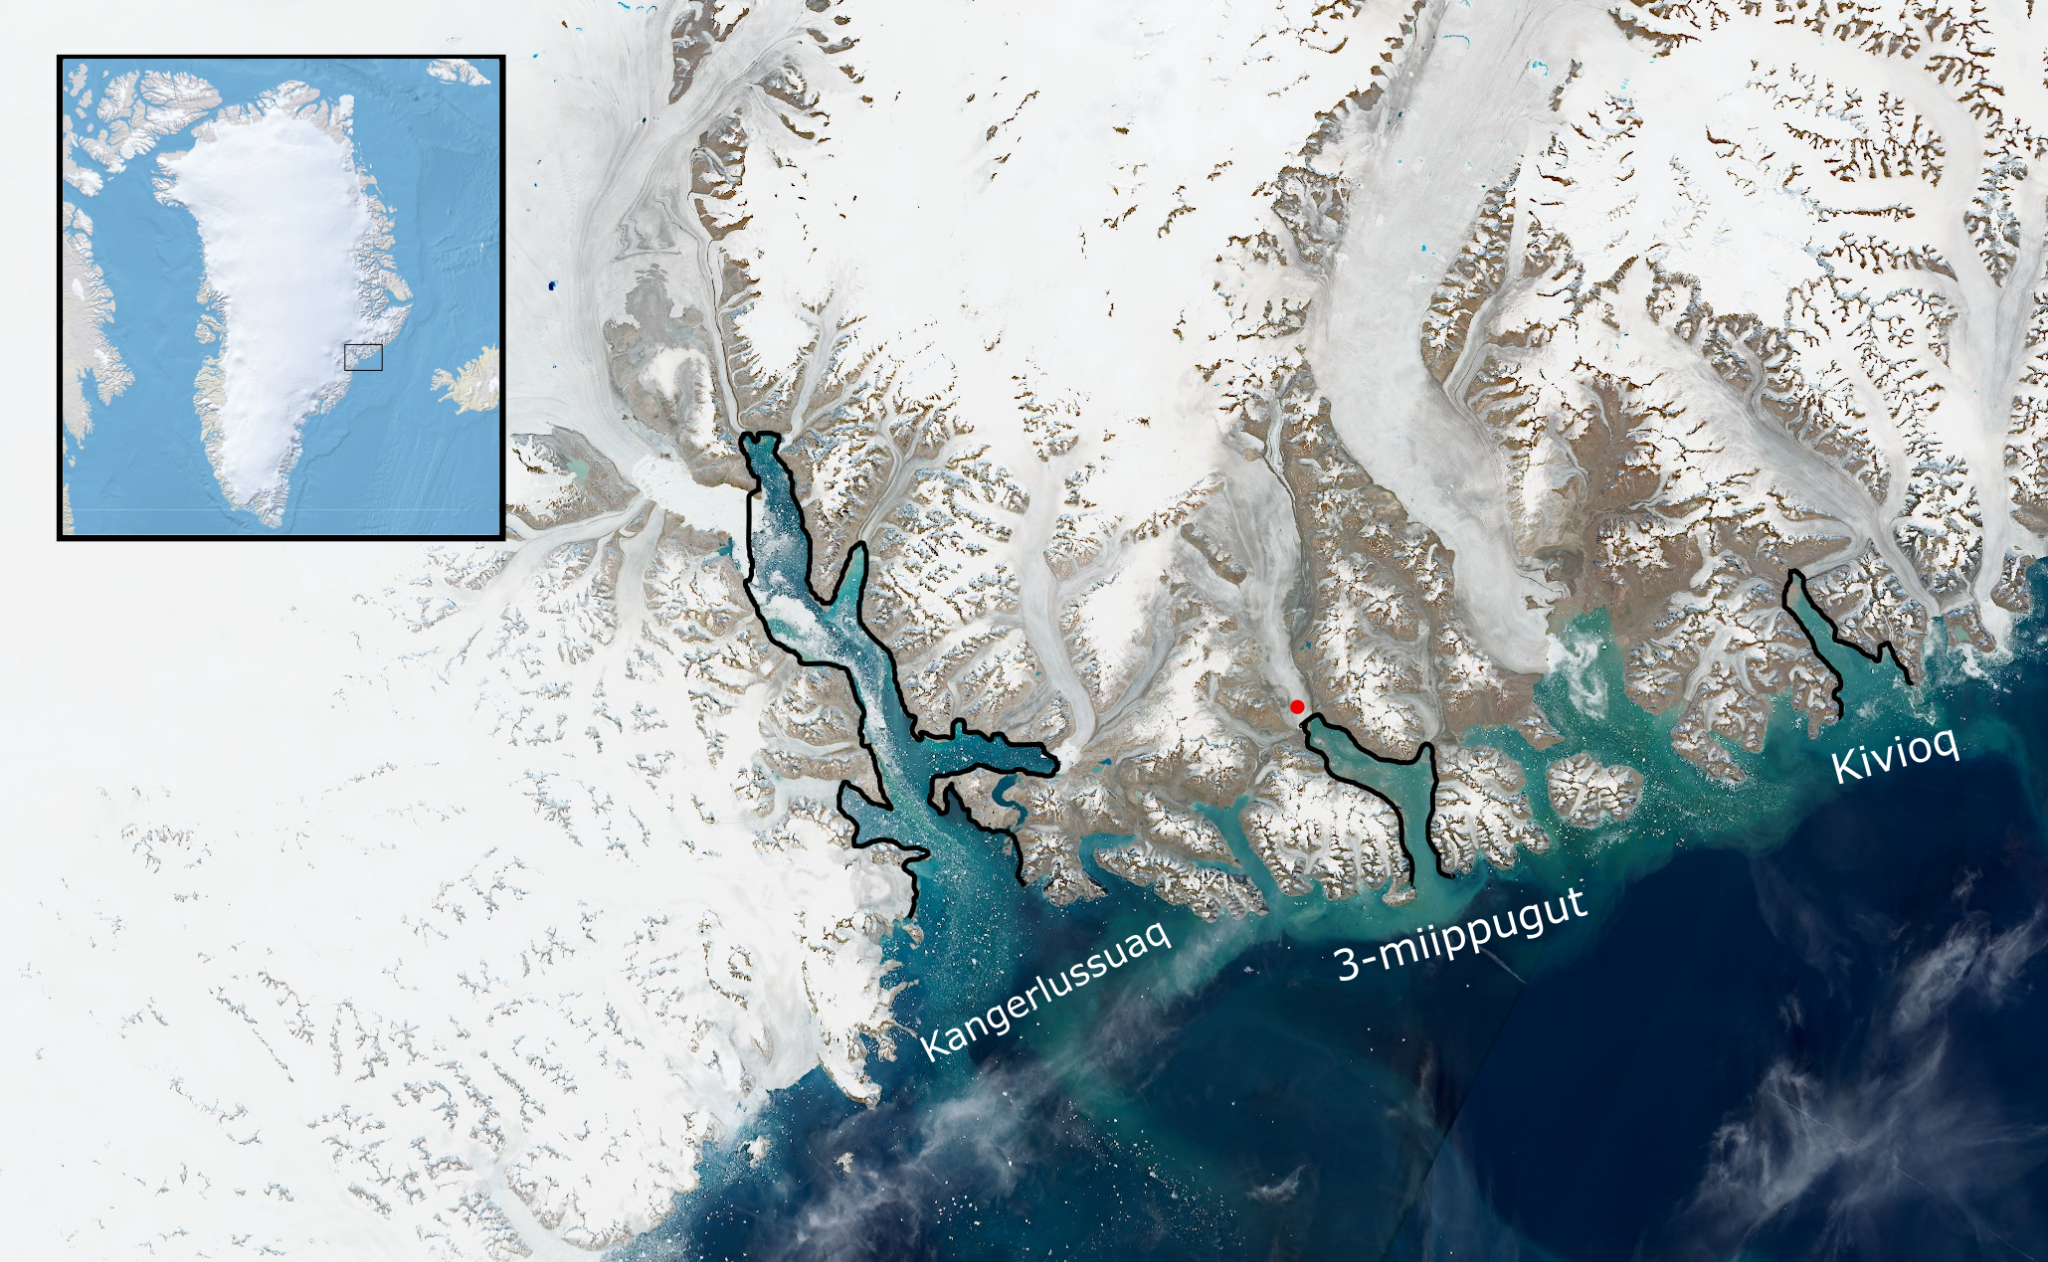
A Sentinel-2 image of the coast of East Greenland where we were working, with the key fjords outlined in black, and a red point in our main working fjord (3-miippugut) at the terminus of Sorgenfri Glacier. The inset is a reference map of Greenland with a box over the same area. Photo Credit: Ellie Fisher (University of Leeds)
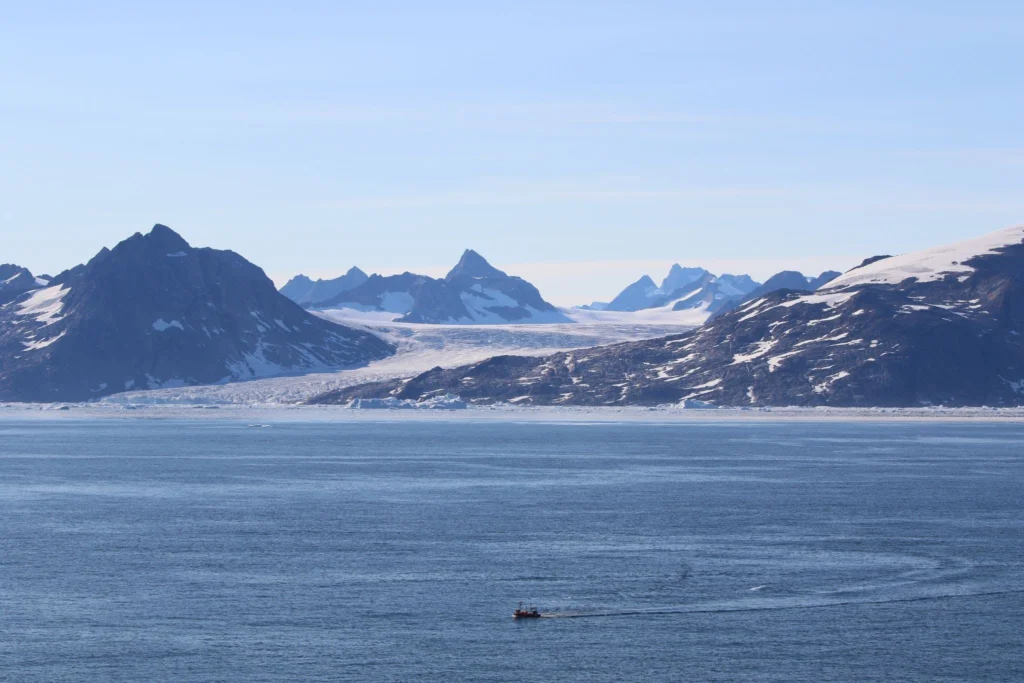
The first of two planned field campaigns for GIANT took place this summer, with the research ship RRS Sir David Attenborough venturing from Harwich in Southeast England to 3-miippugut Fjord in East Greenland. 3-miippugut is so-named because it is the third fjord along the coast from Kangerlussuaq Fjord when travelling north.
Indigenous Greenlandic place names are increasingly being claimed back in scientific discourse from their Danish language equivalents. You can find a reference map of Indigenous Greenlandic place names here: https://nunataqqi.gl/.
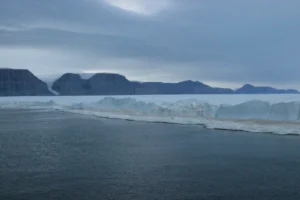
We and the crew of 80 scientists and seafarers were at sea for 7 weeks total, with one month of this spent in 3-miippugut fjord where the RRS Sir David Attenborough was in close proximity to the ice front of Sorgenfri Gletsjer (NB. for now, this retains its Danish name). There was a large focus on using autonomous and remotely-operated vehicles (ROVs), both underwater and in the air, to capture the dynamics of the calving ice face. These person- to small car-sized vehicles can travel into areas that would be dangerous or impossible for researchers to go, such as over the highly crevassed glacier surface, into tight spaces underneath the floating terminus, and in zones of active calving which are off-limits to the ship.
Raising the (melt) stakes
by Kaelan Weiss
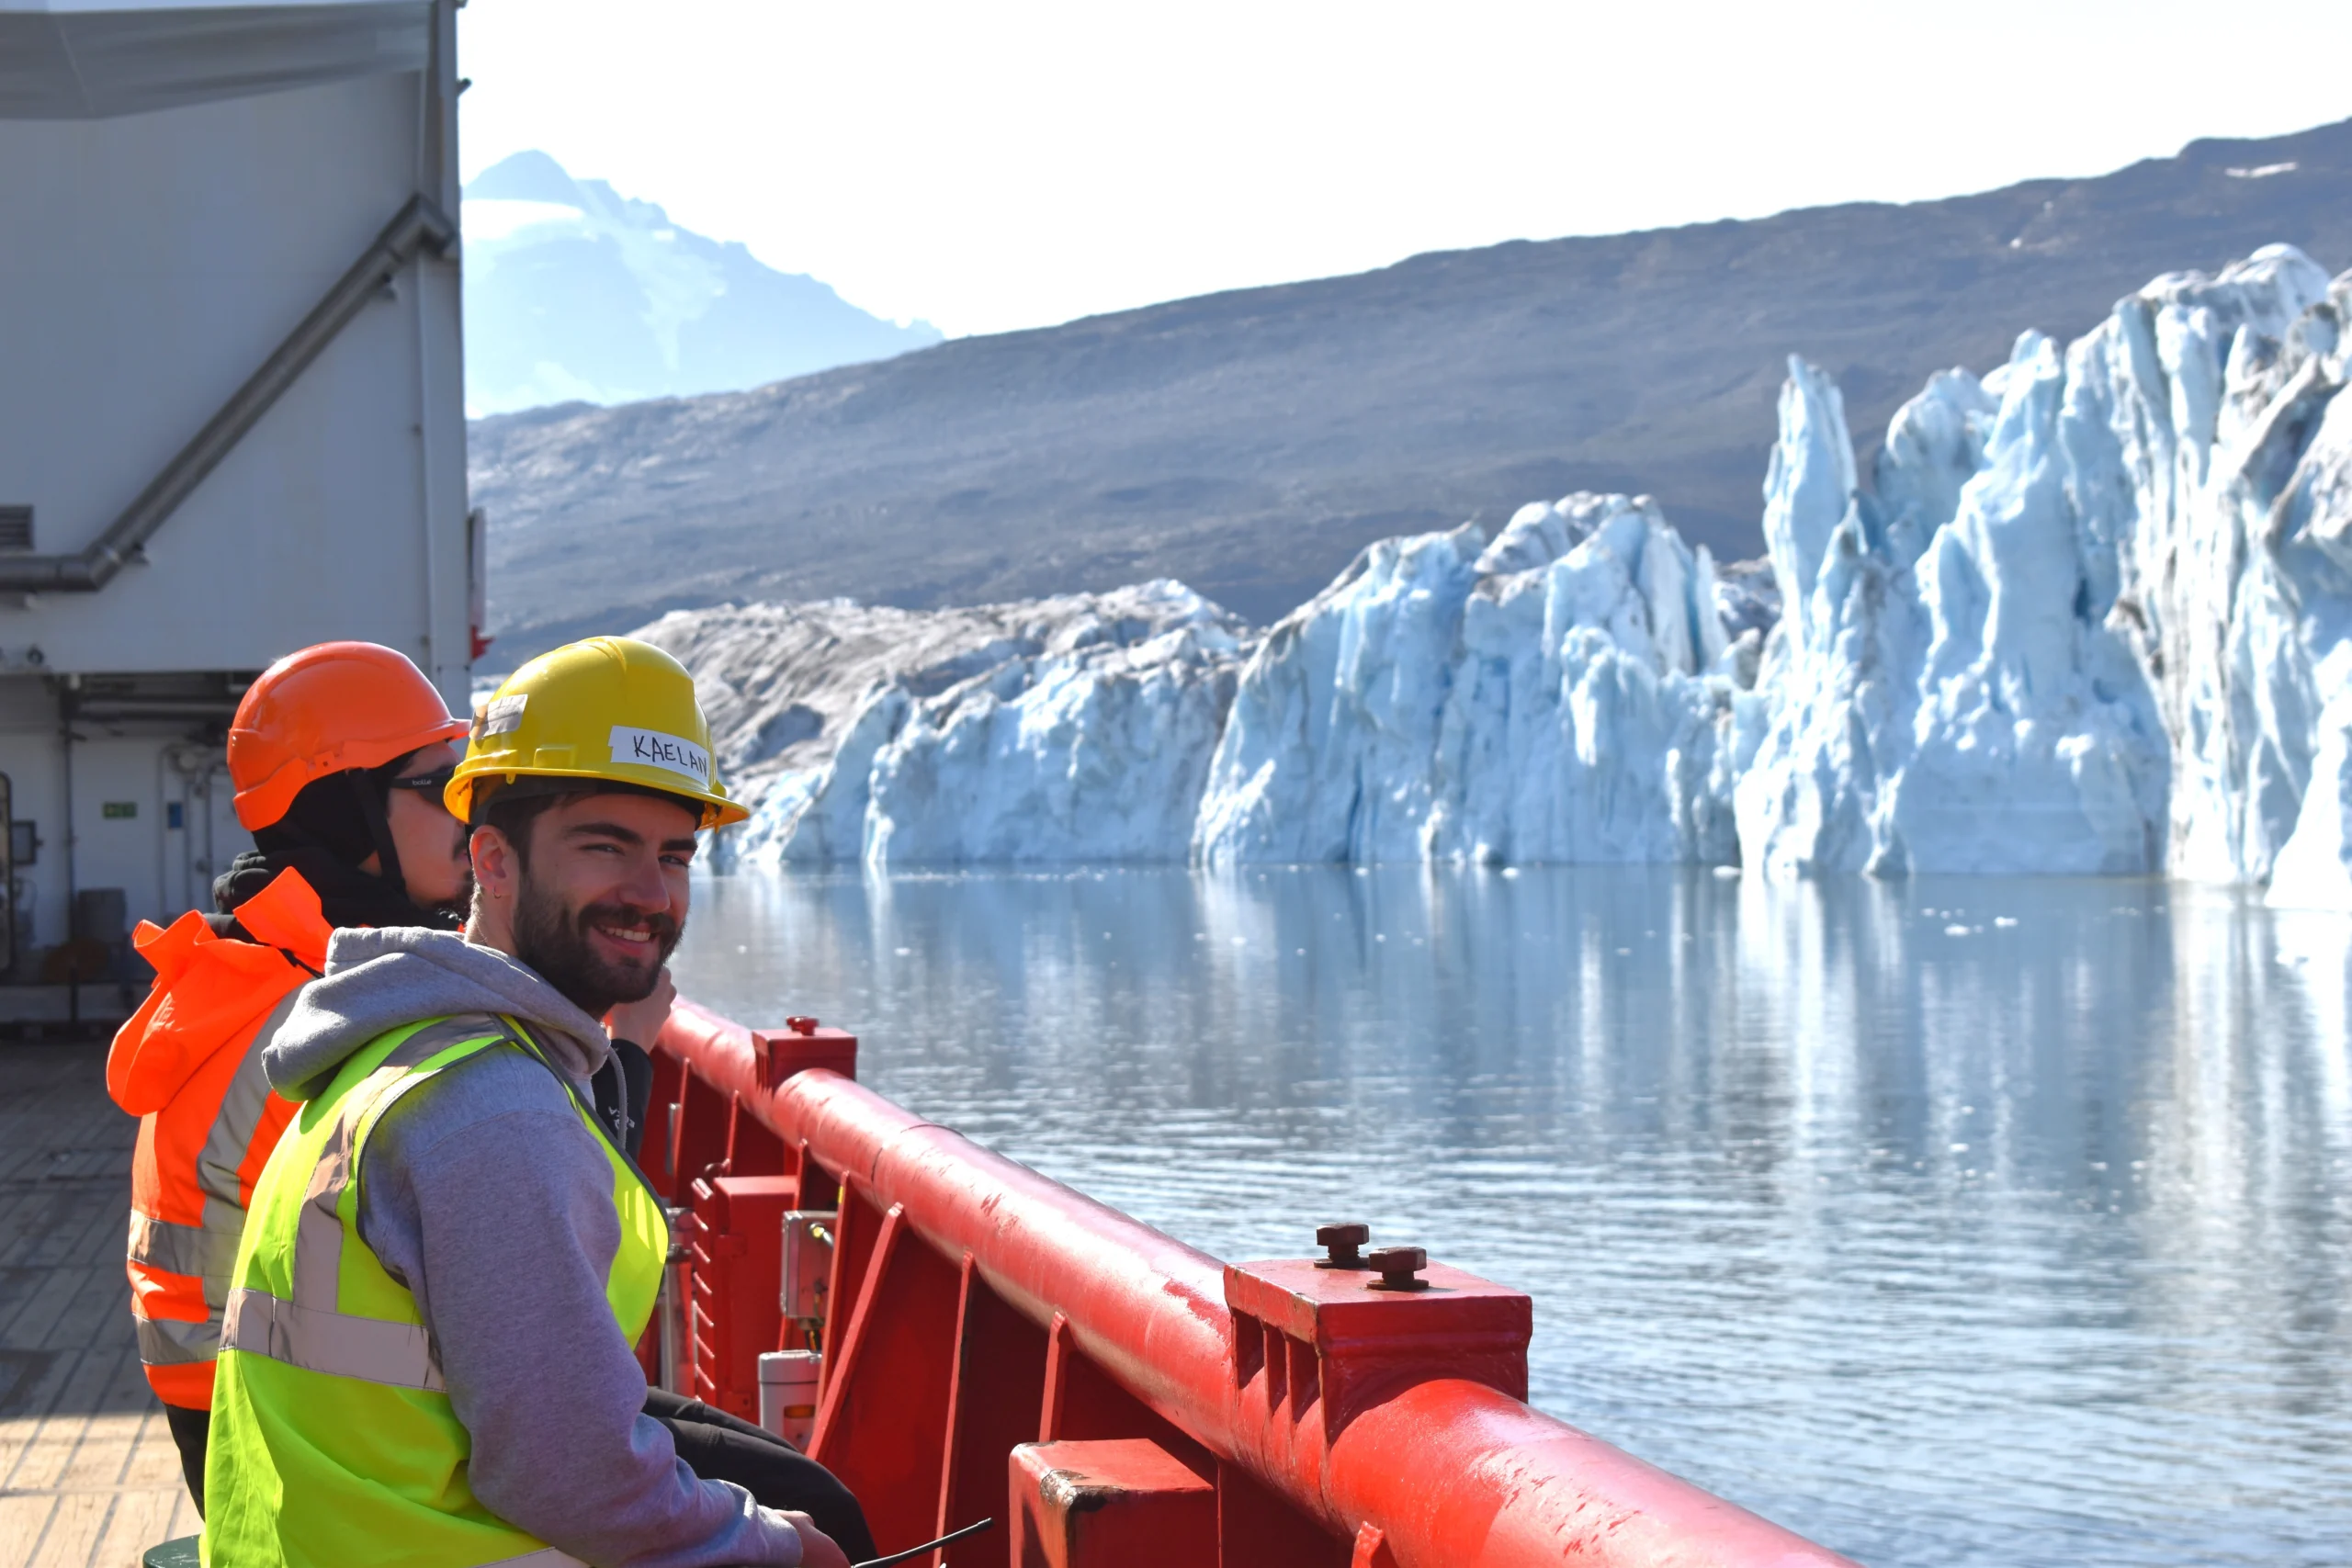
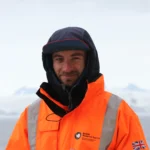
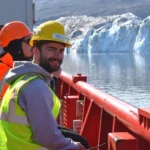
Kaelan Weiss and Thanasis Giannakopoulos during the ship’s arrival at the glacier. Photo Credit: Erin Pettit, Kaelan Weiss (Oregon State University)
Our team came on this trip to untangle the details of how ocean heat is delivered to the face of the ice wall. We are interested in everything from how subglacial discharge plumes (these are the gushing of meltwater from glaciers) stir up currents in the fjord all the way down to how tiny bubbles and ridges in the ice face churn up the water at the glacier-ocean boundary. Many of our observations come from the small inflatable boats that we piloted from the top deck of the SDA, but our main focus for this campaign was to use our boat-based ROVs (so many robots!) to mount Meltstakes into the submerged glacier face.
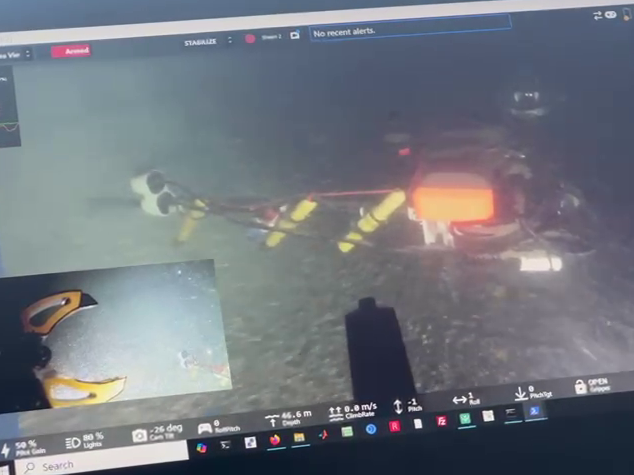
ROV camera view of the Meltstake mounted in the glacier. Photo Credit: Erin Pettit, Kaelan Weiss (Oregon State University)
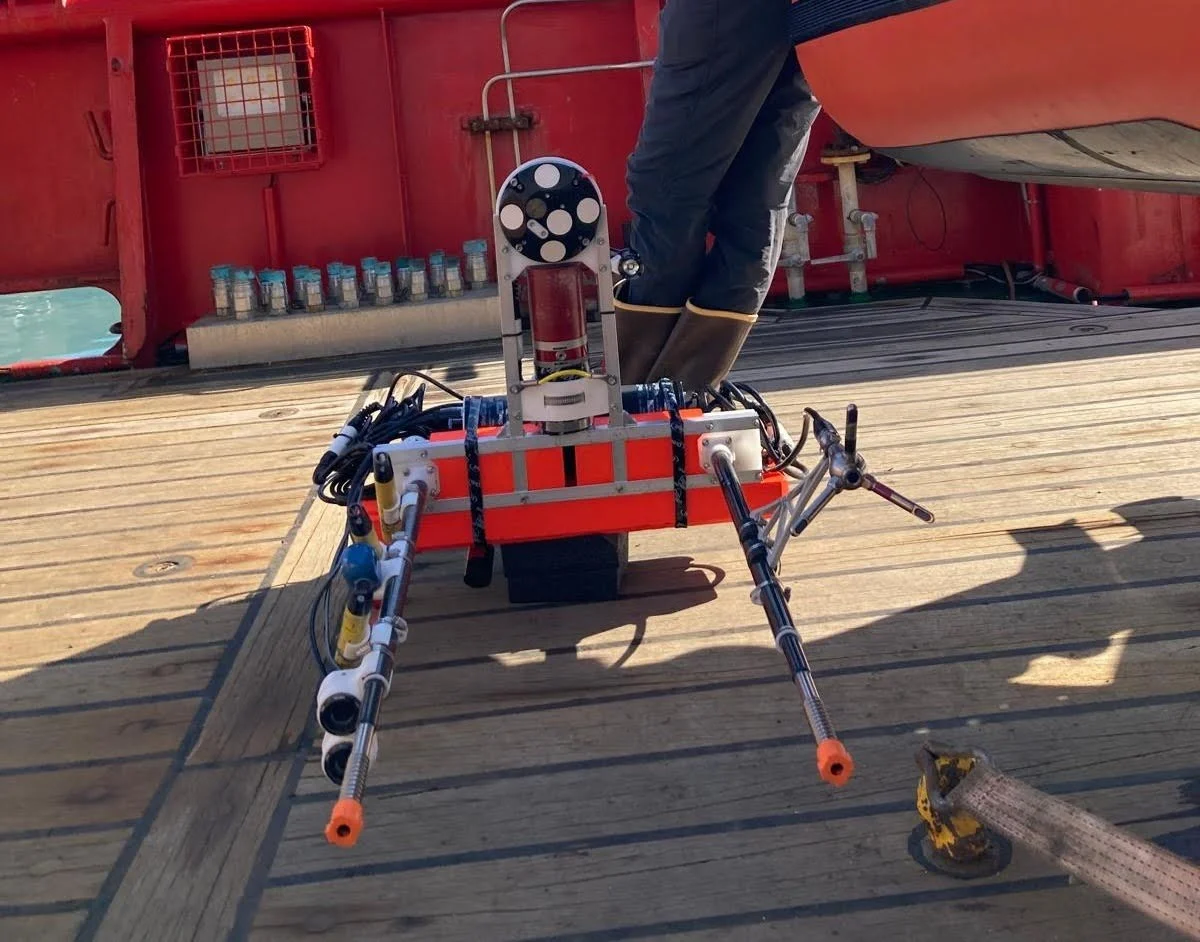
Meltstake ready for predeployment. Photo Credit: Erin Pettit, Kaelan Weiss (Oregon State University)
Meltstakes are small instrumentation platforms with motorized ice screws that let us measure how rapidly the ice is melting and the small-scale details of how the ocean is driving the melt. By mounting the Meltstakes at different depths and locations across the terminus, we found that those details are highly dependent on where you look! Near subglacial outlets, the flow along the glacier is strong and chaotic. By comparison, the flow is much more gentle at depth and far from subglacial outlets, although wandering packets of internal waves can still create bursts of current where you might not expect. The melt rates we measured (about 3 centimeters per day) are consistent with predictions based on the surrounding ocean conditions, so the next challenge is to understand the whole “zoo” of fjord processes that creates this patchwork of circulation along the ice face. Ultimately, we hope to use what we’ve found at Sorgenfri to understand how a warming ocean is affecting glaciers all around Greenland’s margin.
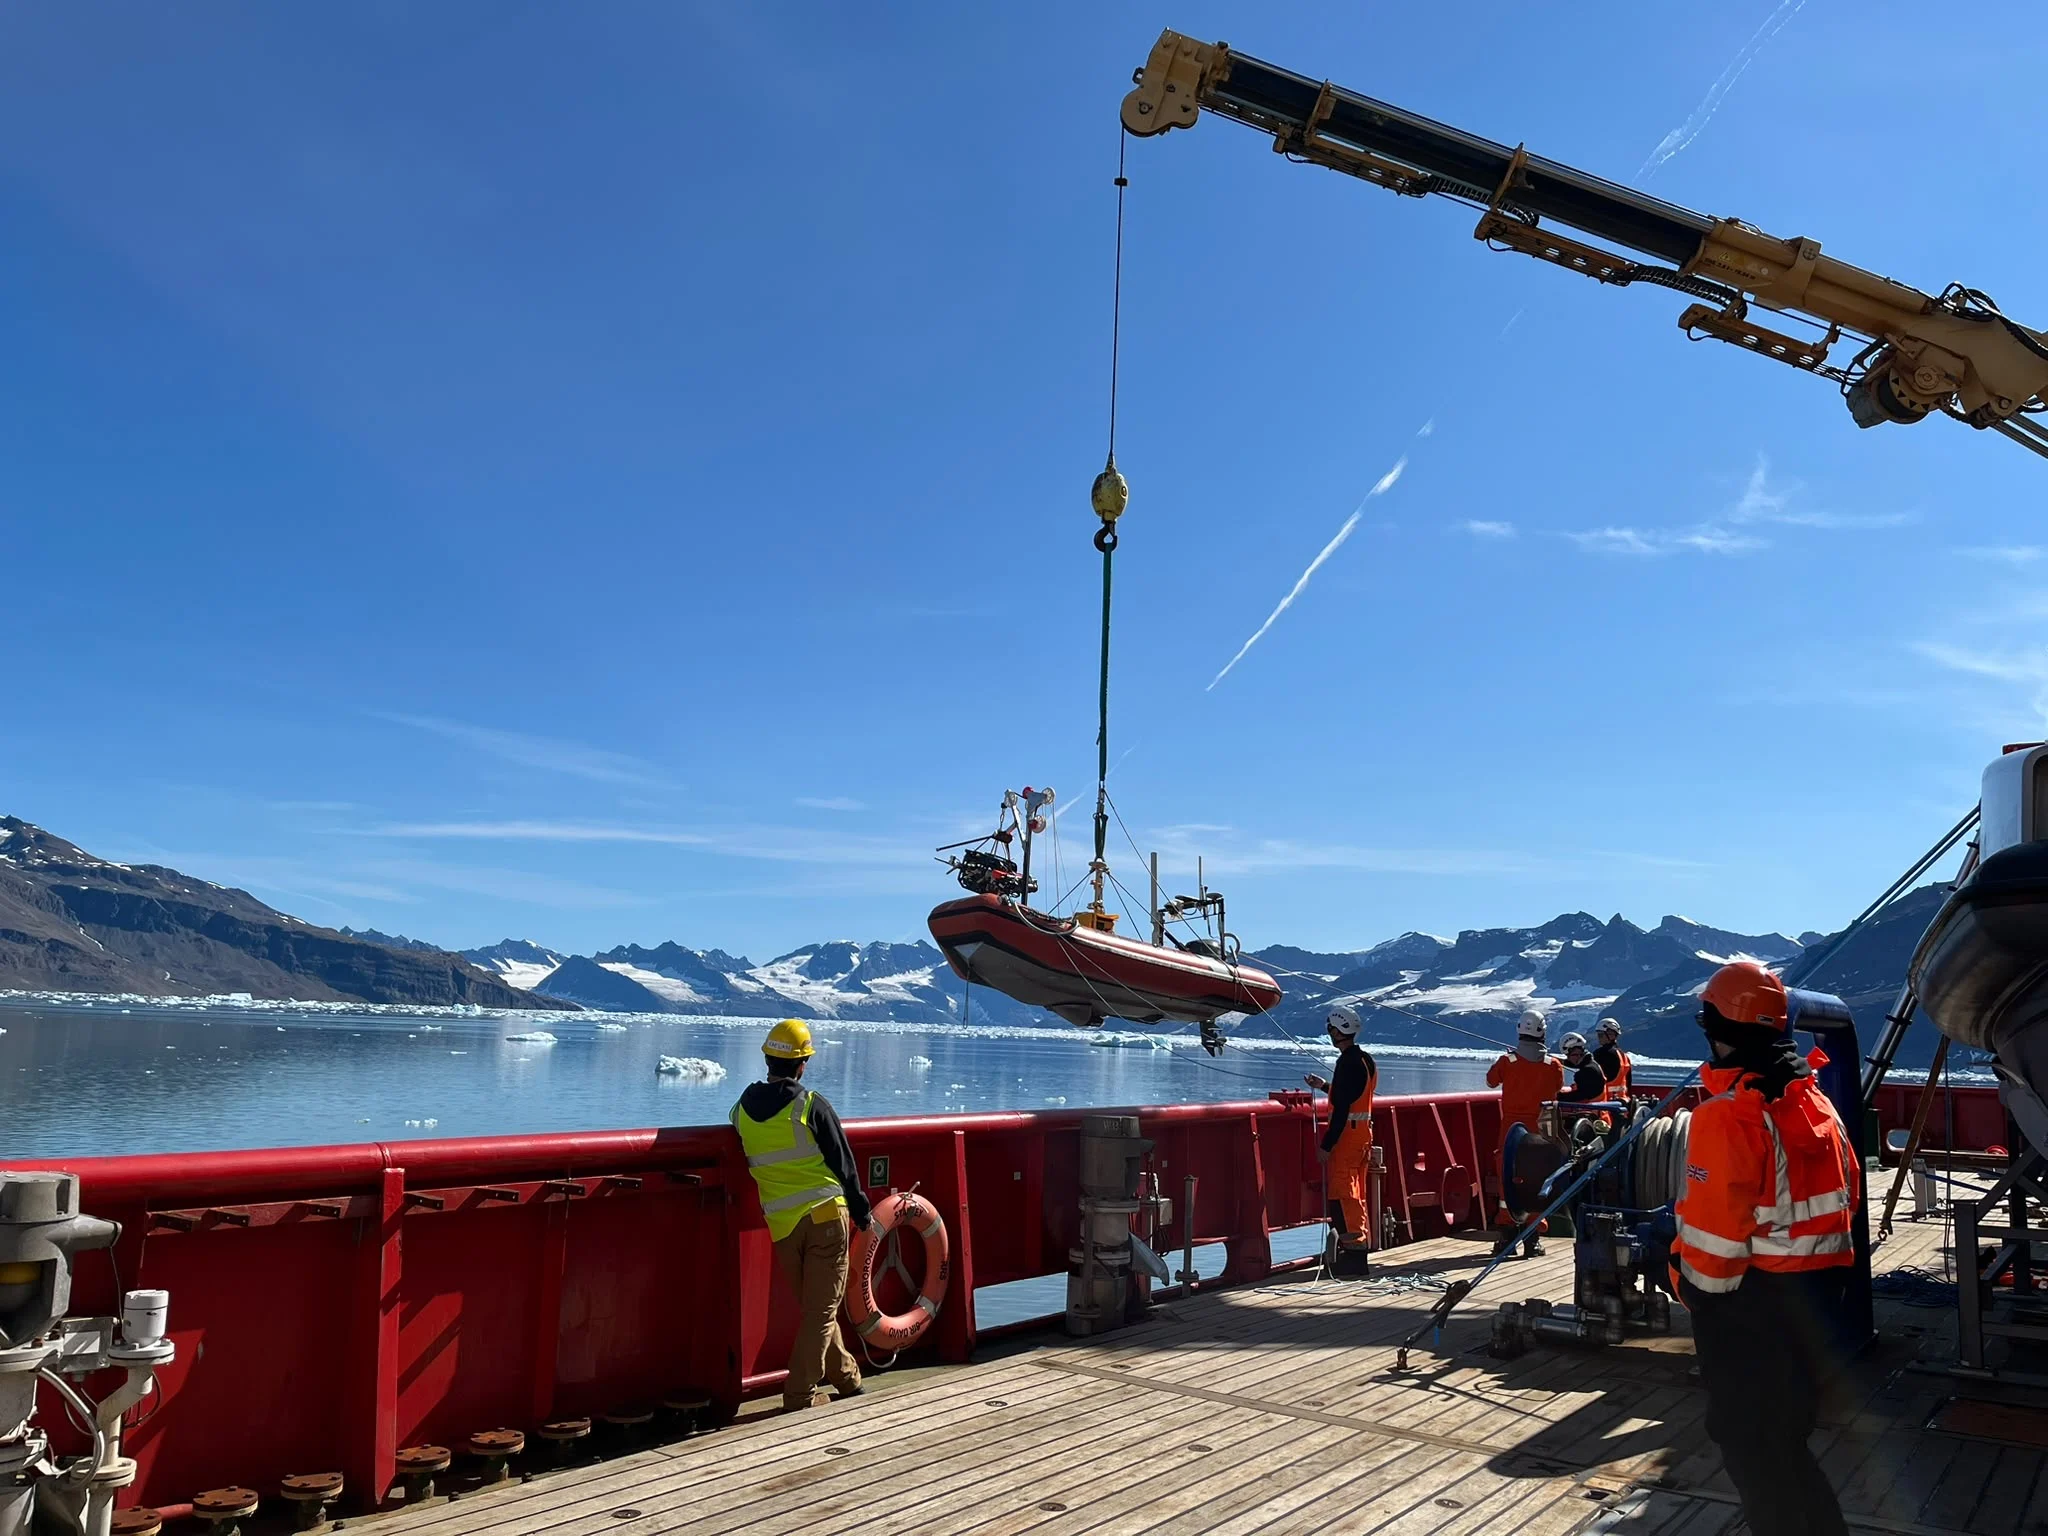
The Meltstakes boat goes overboard, loaded with ROV and Meltstake.
Photo Credit: Kelly Hogan (British Antarctic Survey)
Down to the depths
by Ellie Fisher
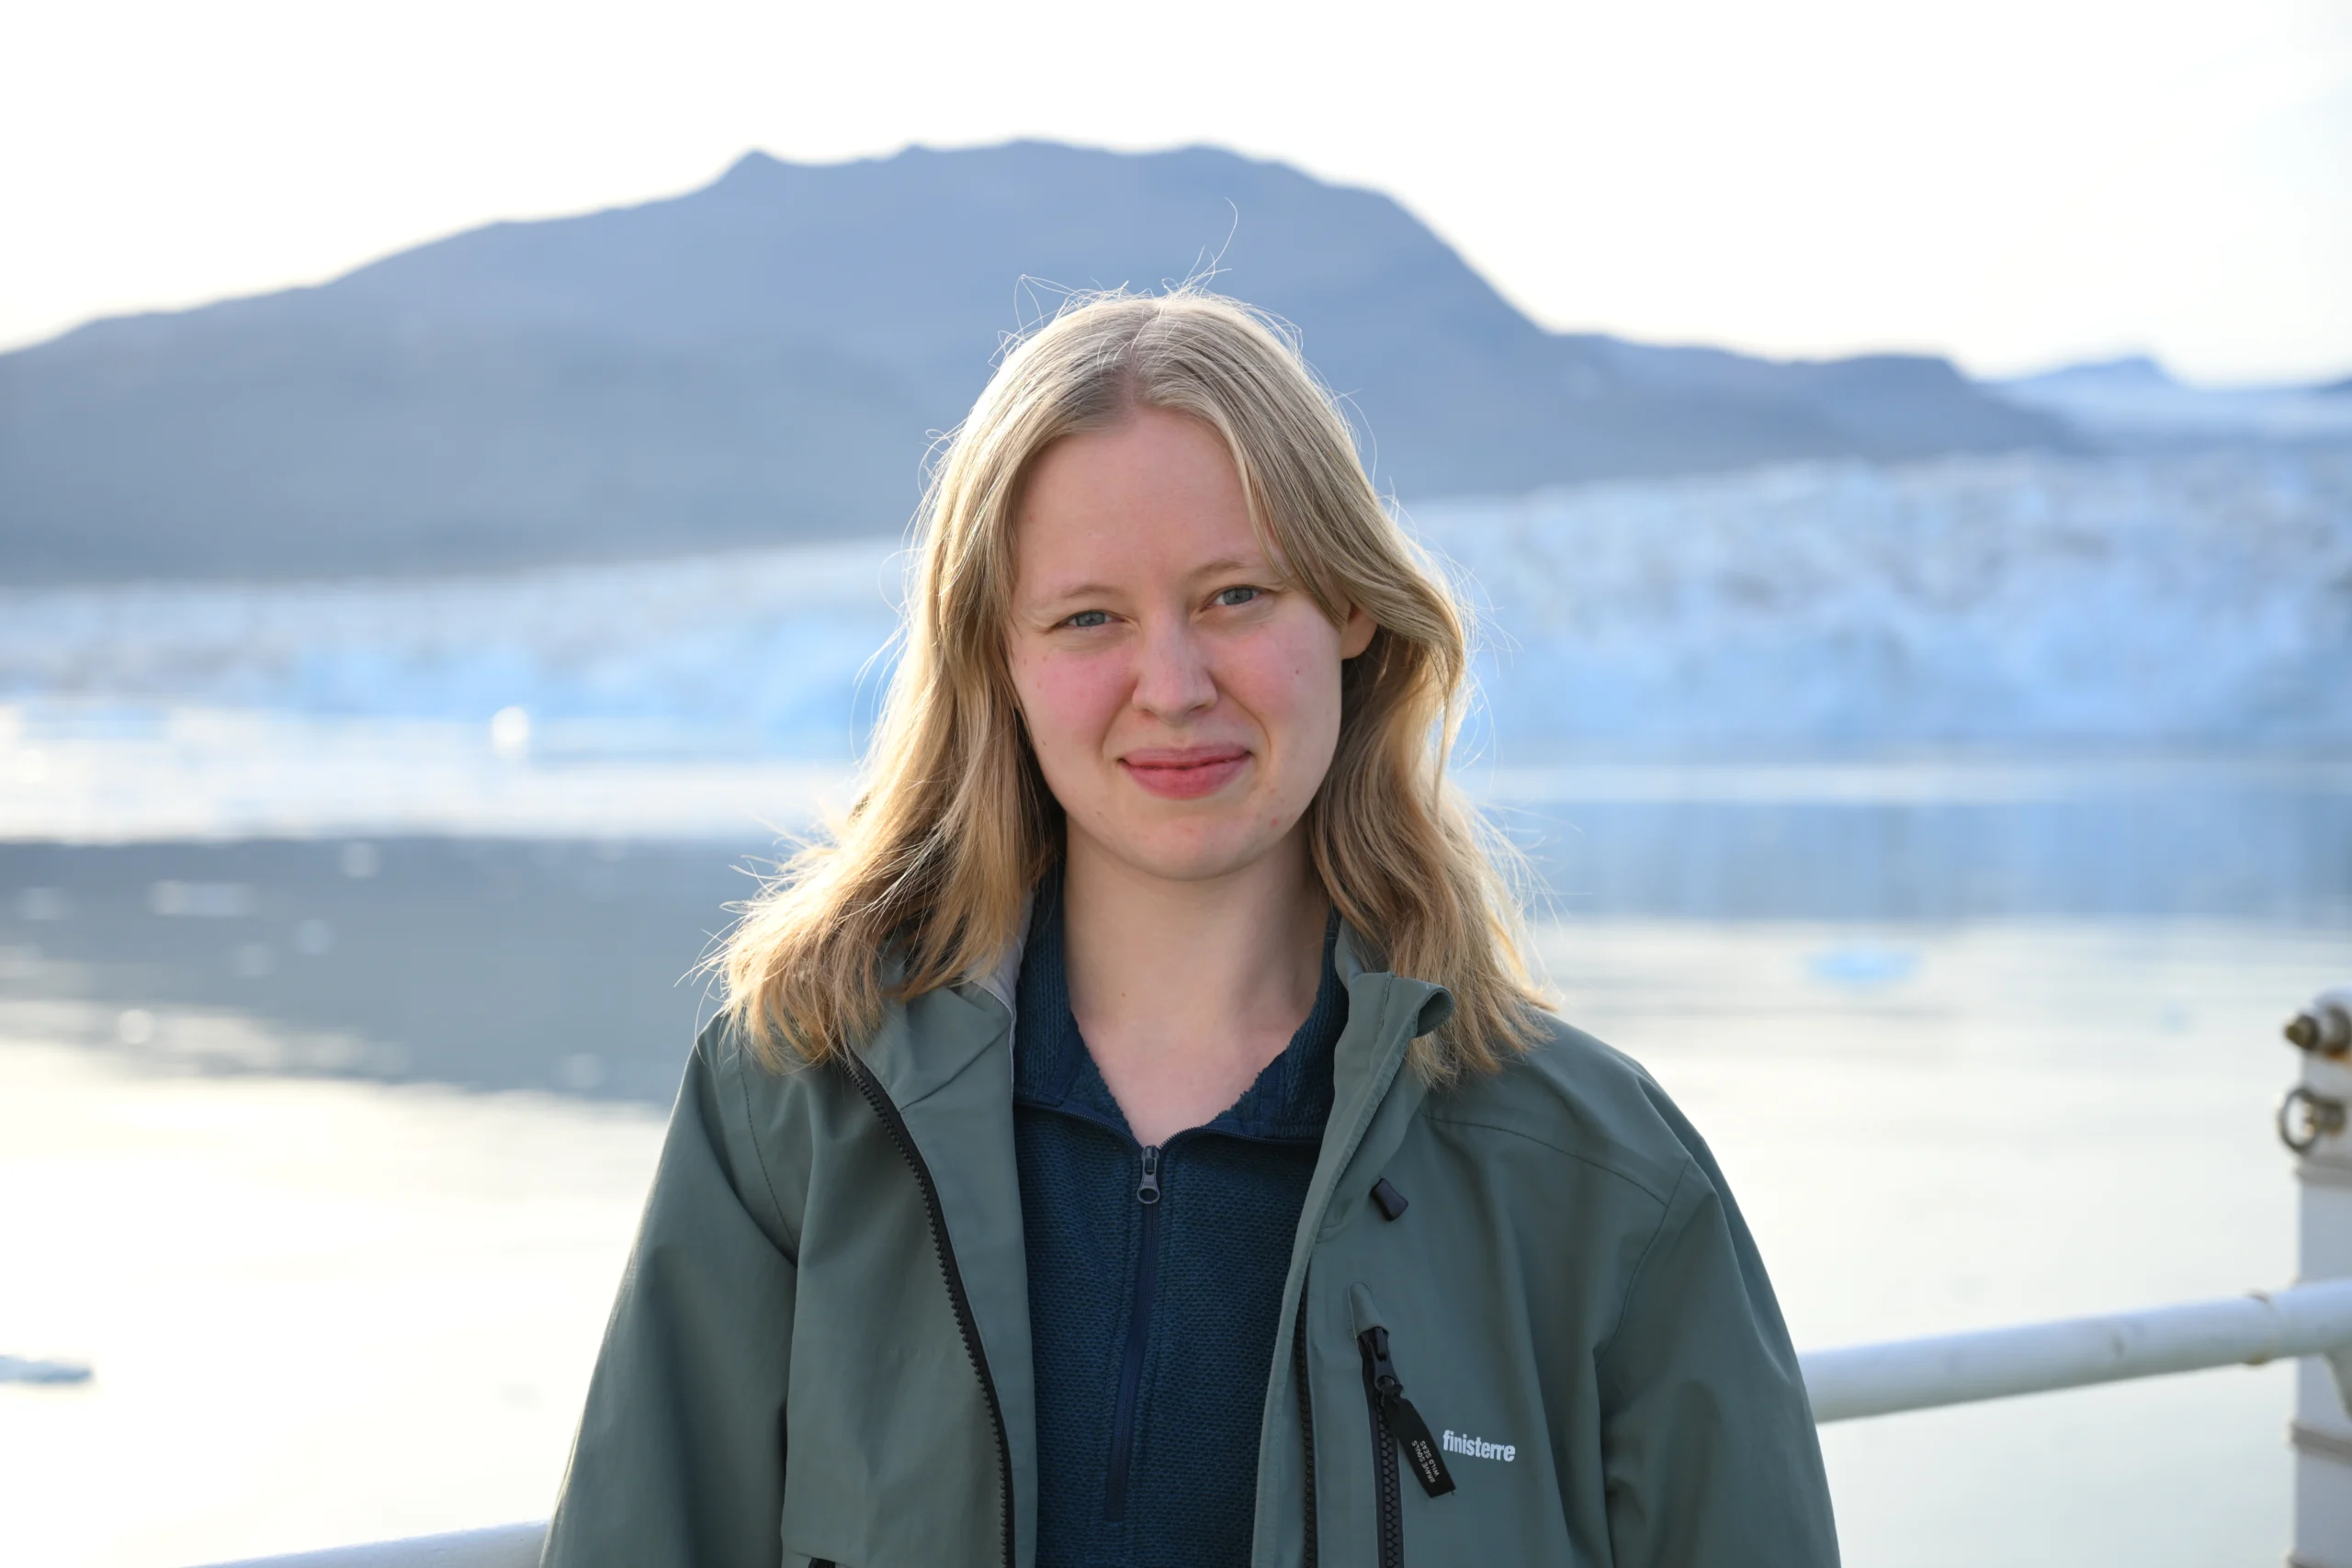
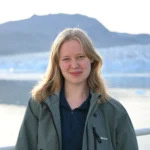
Portrait of Ellie Fisher in front of Sorgenfri Glacier. Photo Credit: Em Newton (British Antarctic Survey), Ellie Fisher (University of Leeds)
I was working with the physical oceanography team onboard, which meant that most of my time was split between three ship-based instruments: the CTD (Conductivity-Temperature-Depth) rosette, MSS (Microstructure Shear Profiler), and salinometer.
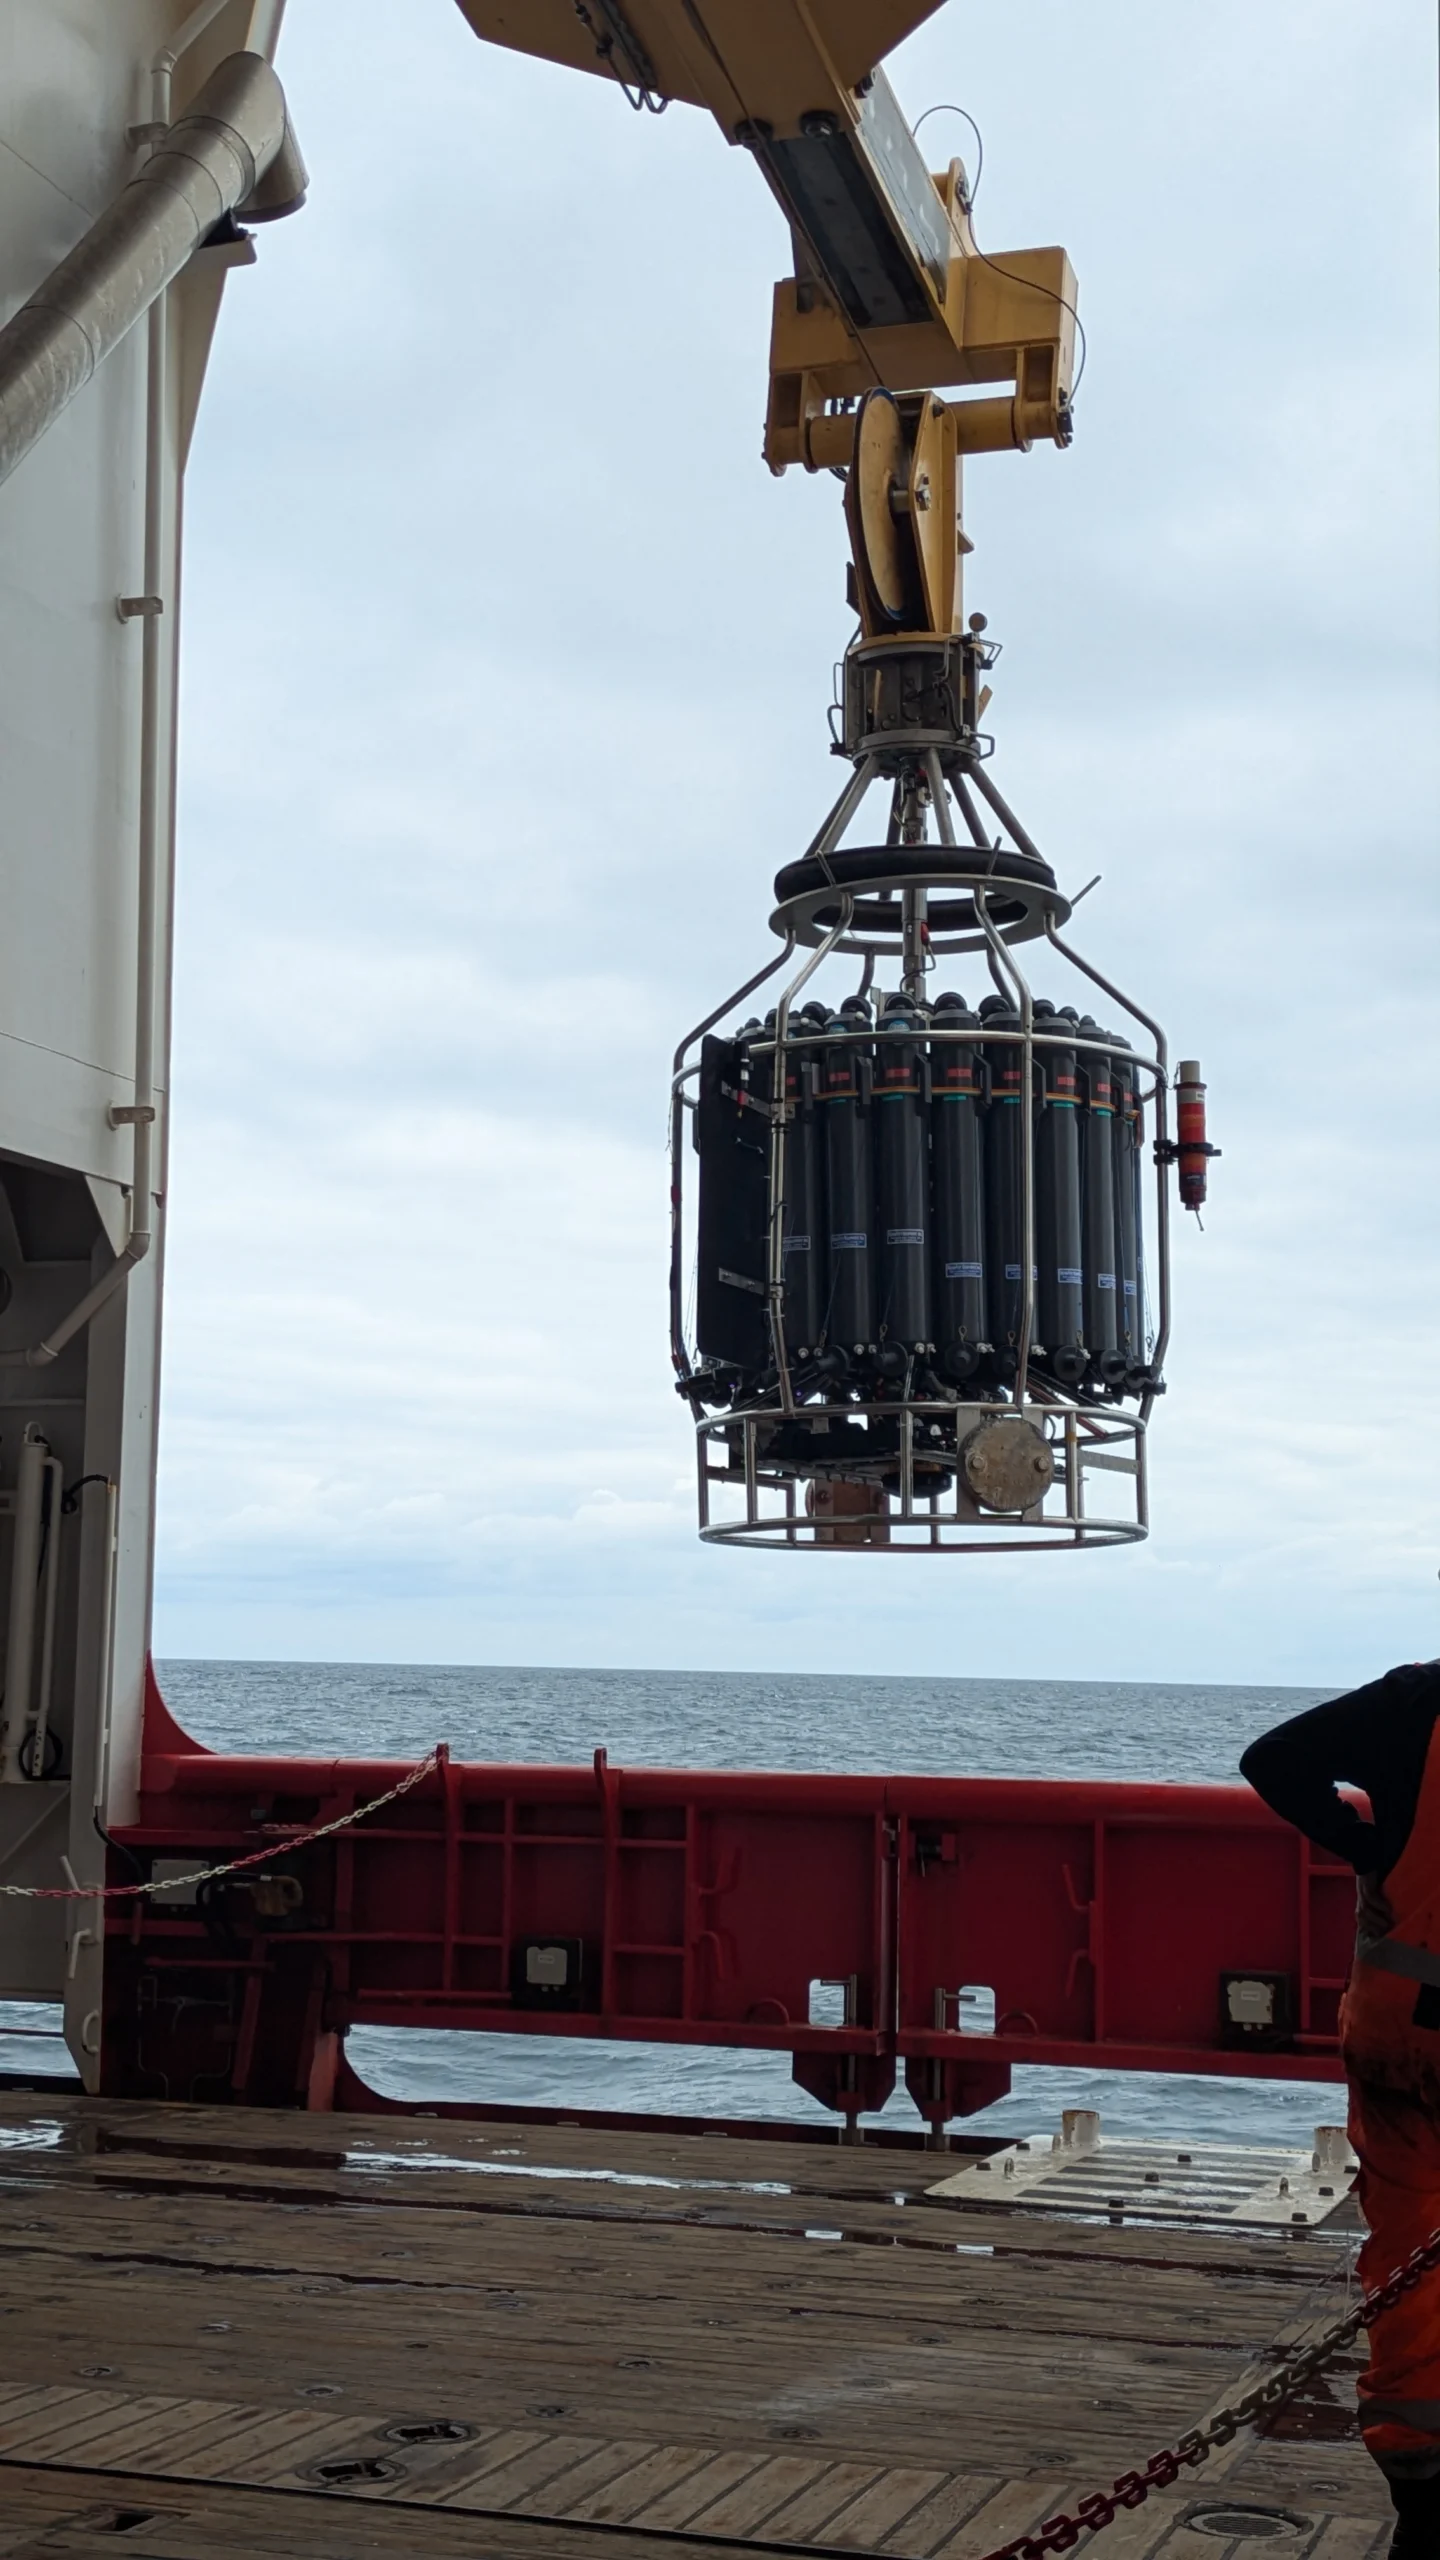
The CTD rosette being brought out to the side of the ship, ready to deploy. Photo Credit: Em Newton (British Antarctic Survey), Ellie Fisher (University of Leeds)
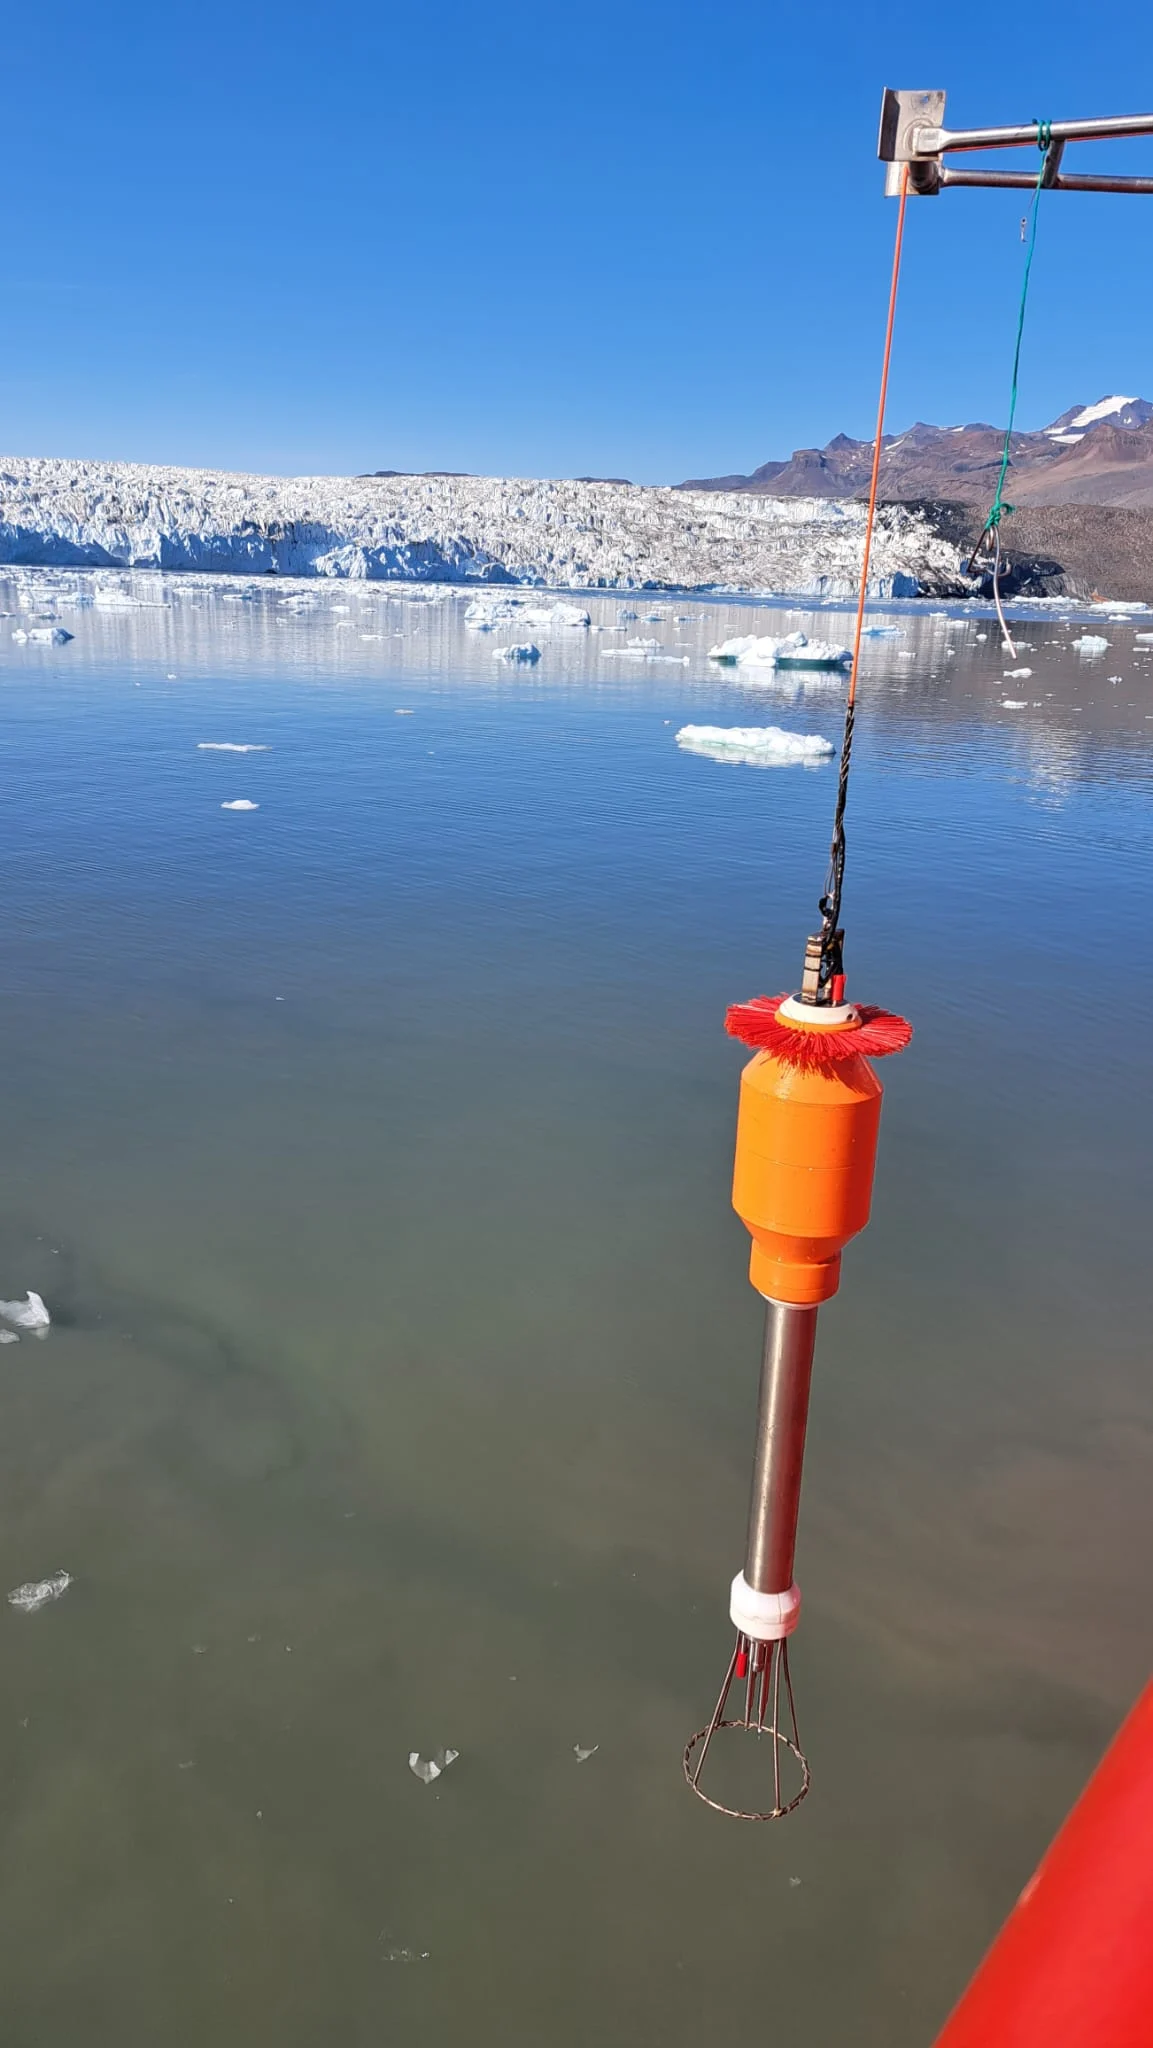
The MSS instrument being retrieved after a deployment, with Sorgenfri Glacier in the background.
Photo Credit: Em Newton (British Antarctic Survey), Ellie Fisher (University of Leeds)
On the GIANT cruise, we made a record-breaking 261 vertical casts with the CTD rosette, which gave us useful information about the temperature and conductivity profile through the water column in various locations. We could also then explore how heat and nutrients were being circulated on different scales. Thanks to this effort, we discovered that there was a strong semi-daily pattern in the temperature and salinity from the top to the bottom of the water column. This is partially due to the influence that the tide has on the waters mixing over the bottom of the fjord and the amount of warm water reaching the ice front. We used the MSS to measure turbulence near to the ice front, where strong subglacial plume activity was observed early on. I was fascinated by how intense this looked from the surface: you could watch it swirling like a jacuzzi! We also took water samples at different depths from the Niskin bottles on the rosette to measure for oxygen isotopes, macronutrients, chlorophyll, eDNA, and calibrated the salinity measured by other sensors using the salinometer lab results. This wouldn’t have been possible without the support of our night-time shift counterparts; it truly was 24-hour science.
The glacier’s side of the story
by Yoram Terleth
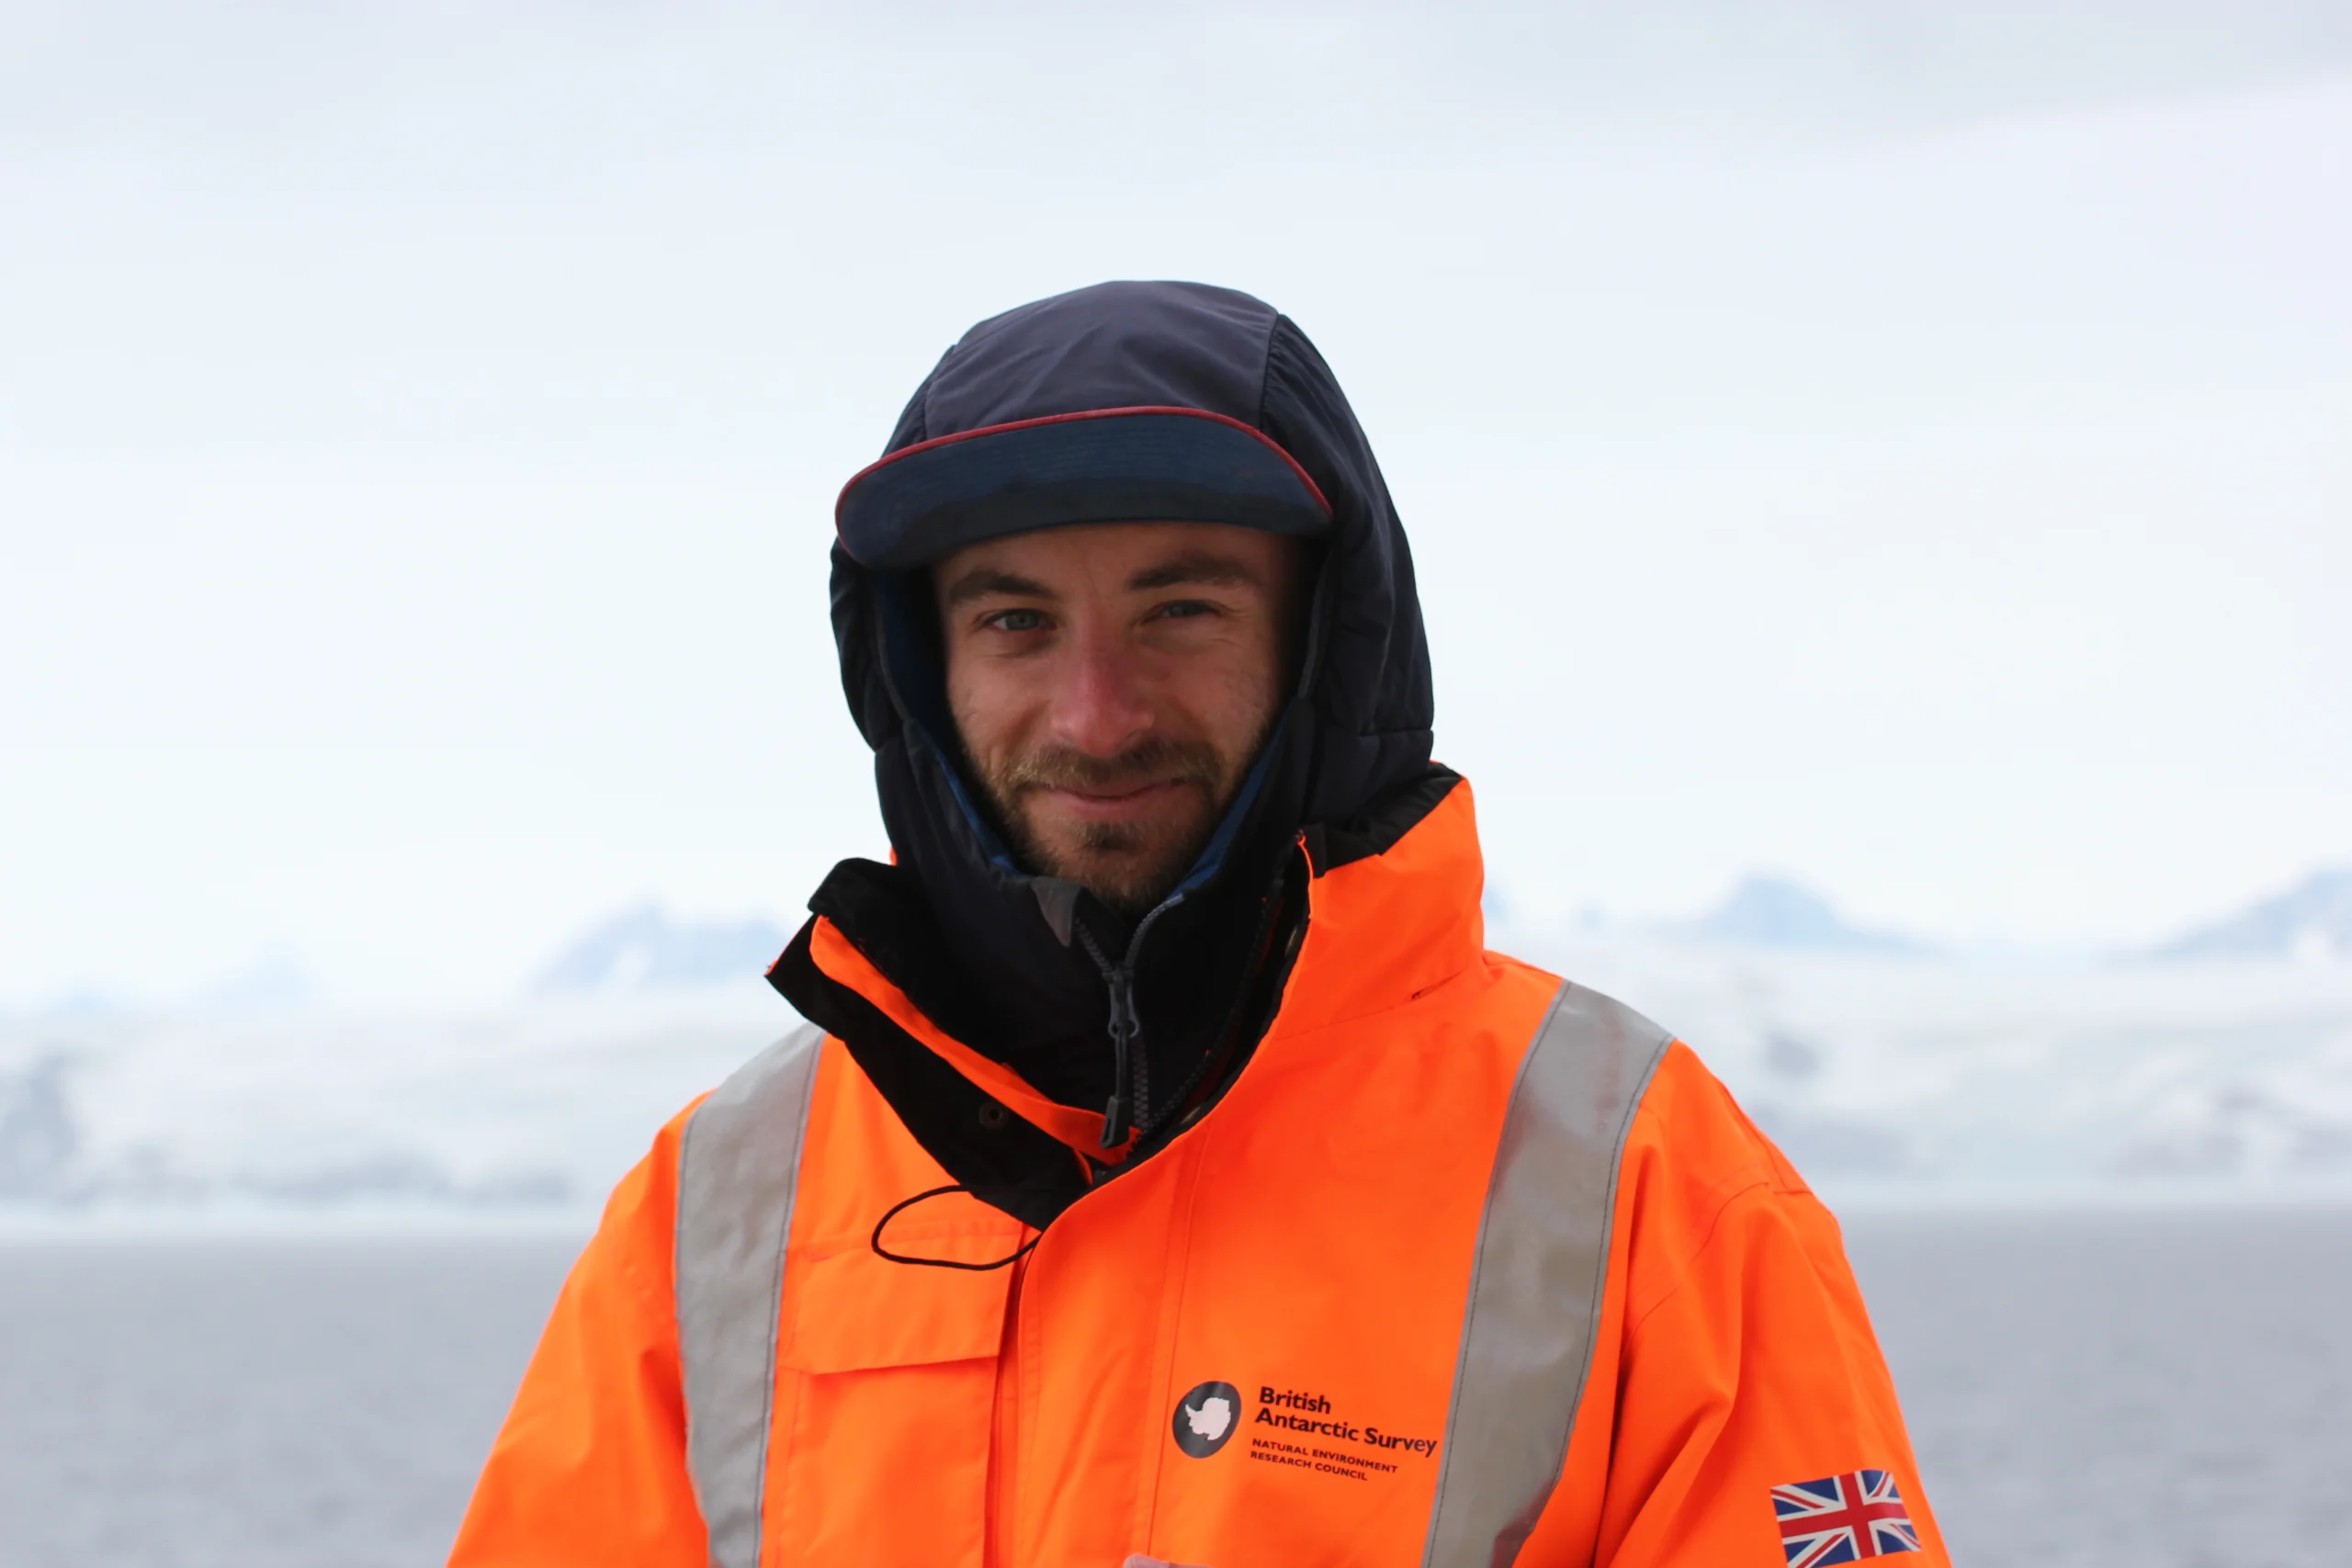
Yoram Terleth on the RRS Sir David Attenborough, with the Greenland coastline in the background.
Photo Credit: Em Newton (British Antarctic Survey)
The fieldwork conducted during the cruise also included a land-based component. On August 2nd, a team of 6 boarded “Terror”, the Sir David Attenborough’s landing craft, that took us to shore. We set up a comfortable camp a few kilometres inland, complete with a polar bear fence that definitely no-one accidentally walked into in the middle of the night, waking everyone up…
Over the course of 6-days, we installed a network of timelapse cameras, seismometers and GNSS (satellite movement-tracking) stations, including a series of low-cost TAGs (Tilt, Accelerometer, and GNSS), designed for the project. We also conducted near-daily drone surveys of the glacier, to map out exactly how it changed over time. The primary goal of the land-based fieldwork was to monitor the behaviour of the glacier leading up to, during, and after calving events. These events are inherently difficult to observe, and we were lucky to catch a few in our record. We hope that a detailed analysis of how these events occurred will support the rest of the team in their oceanographic work, as the cold freshwater supply from melting icebergs and the kinetic energy input into the fjord are crucial components of the system. A better understanding of the calving mechanism would also inform how we model calving at longer timescales, currently a major source of uncertainty in Greenland ice sheet models.
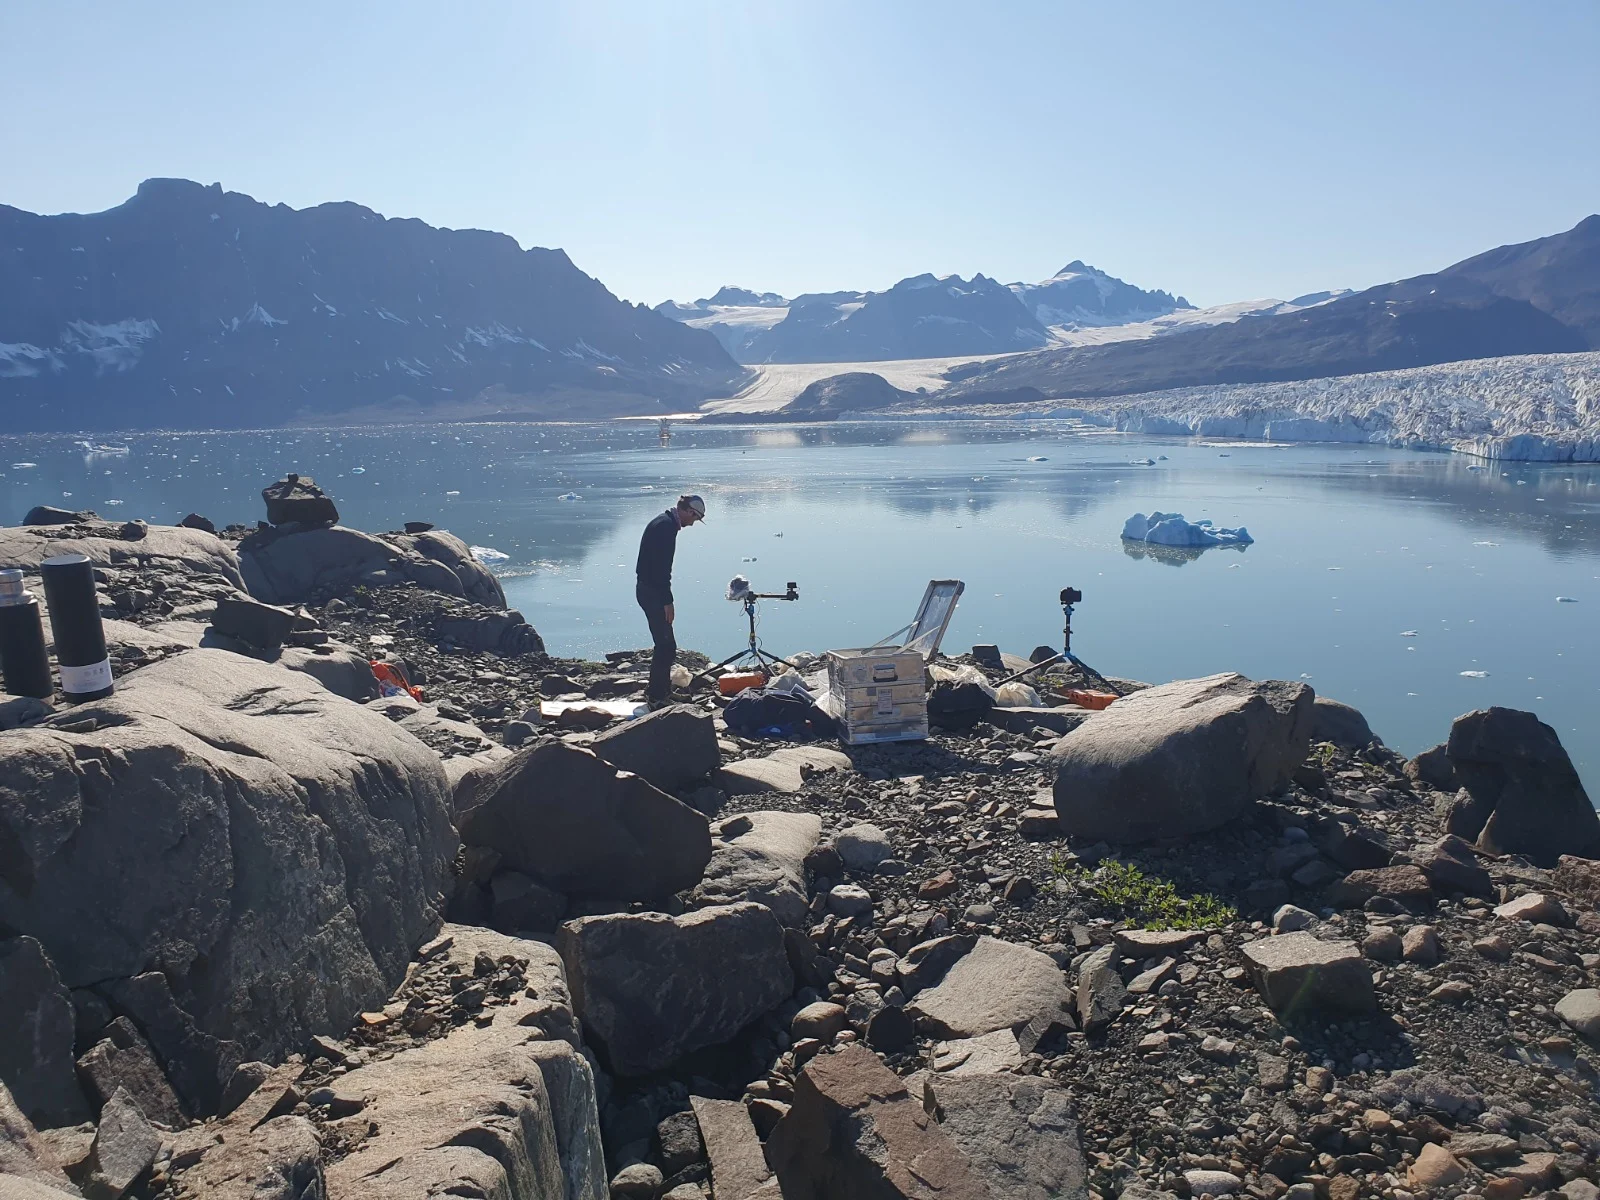
Installation at one of the more scenic time-lapse camera sites.
Photo Credit: Blair Fyffe (British Antarctic Survey)
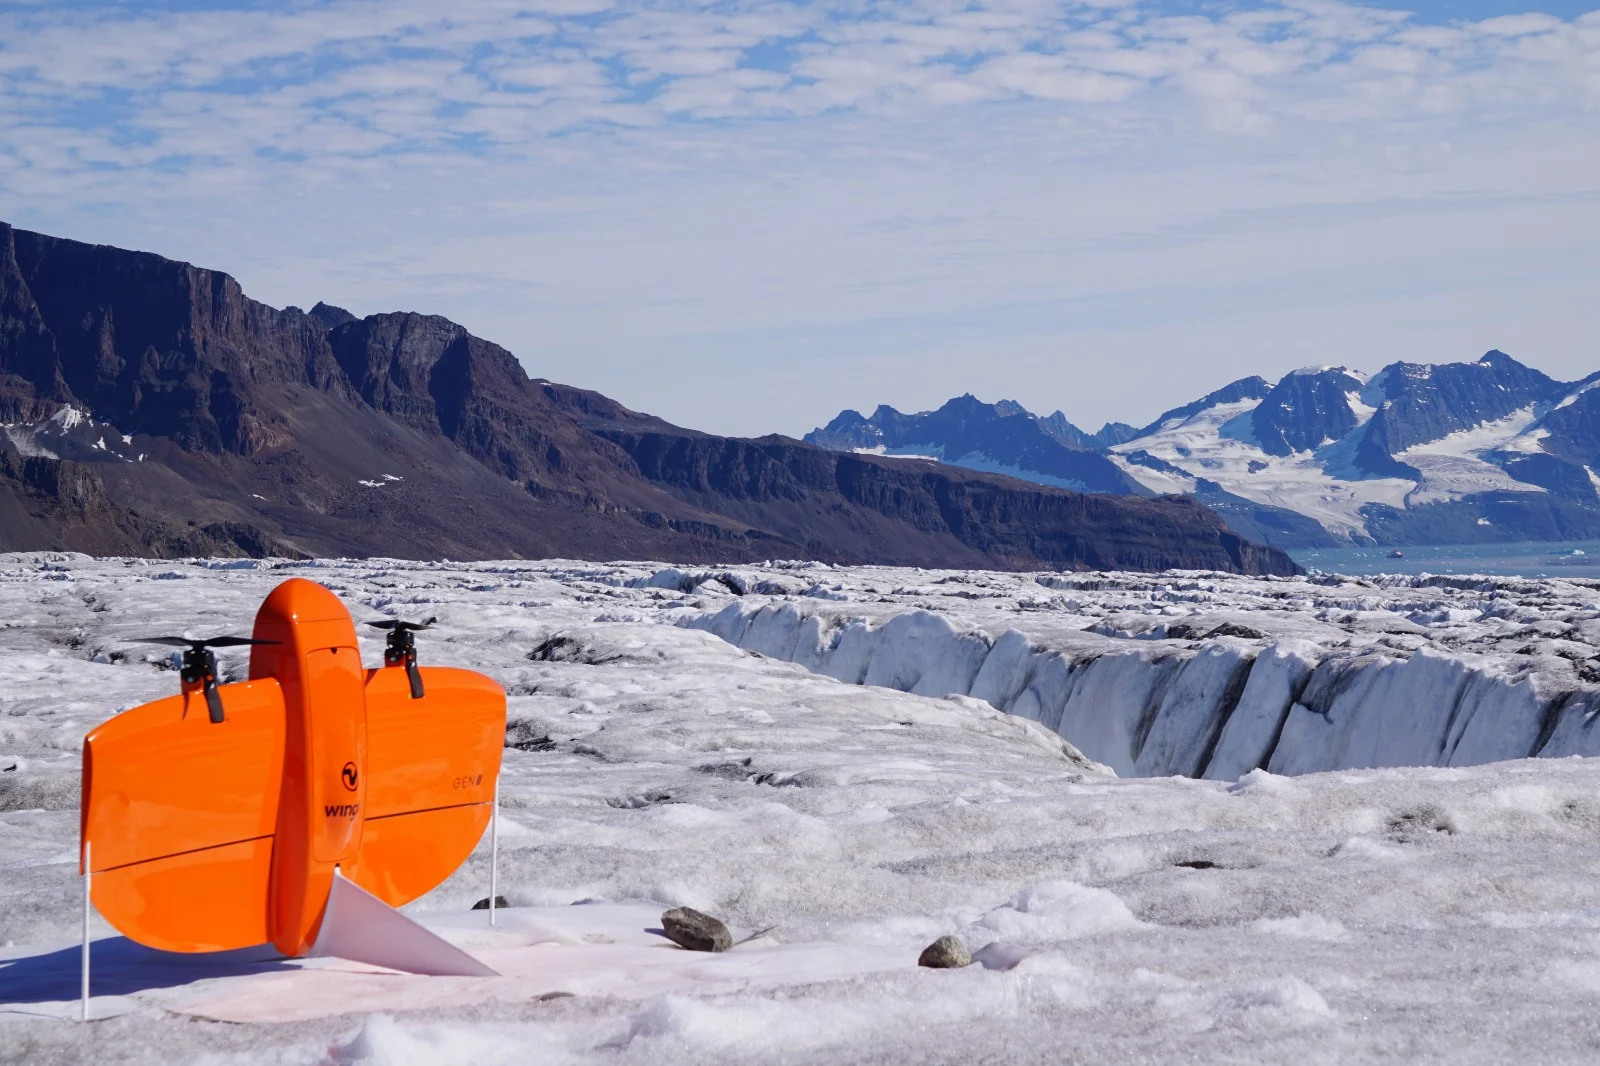
The Wingtra fixed wing UAS, with vertical take-off and landing capability.
Photo Credit: Geraint Raymond (British Antarctic Survey)
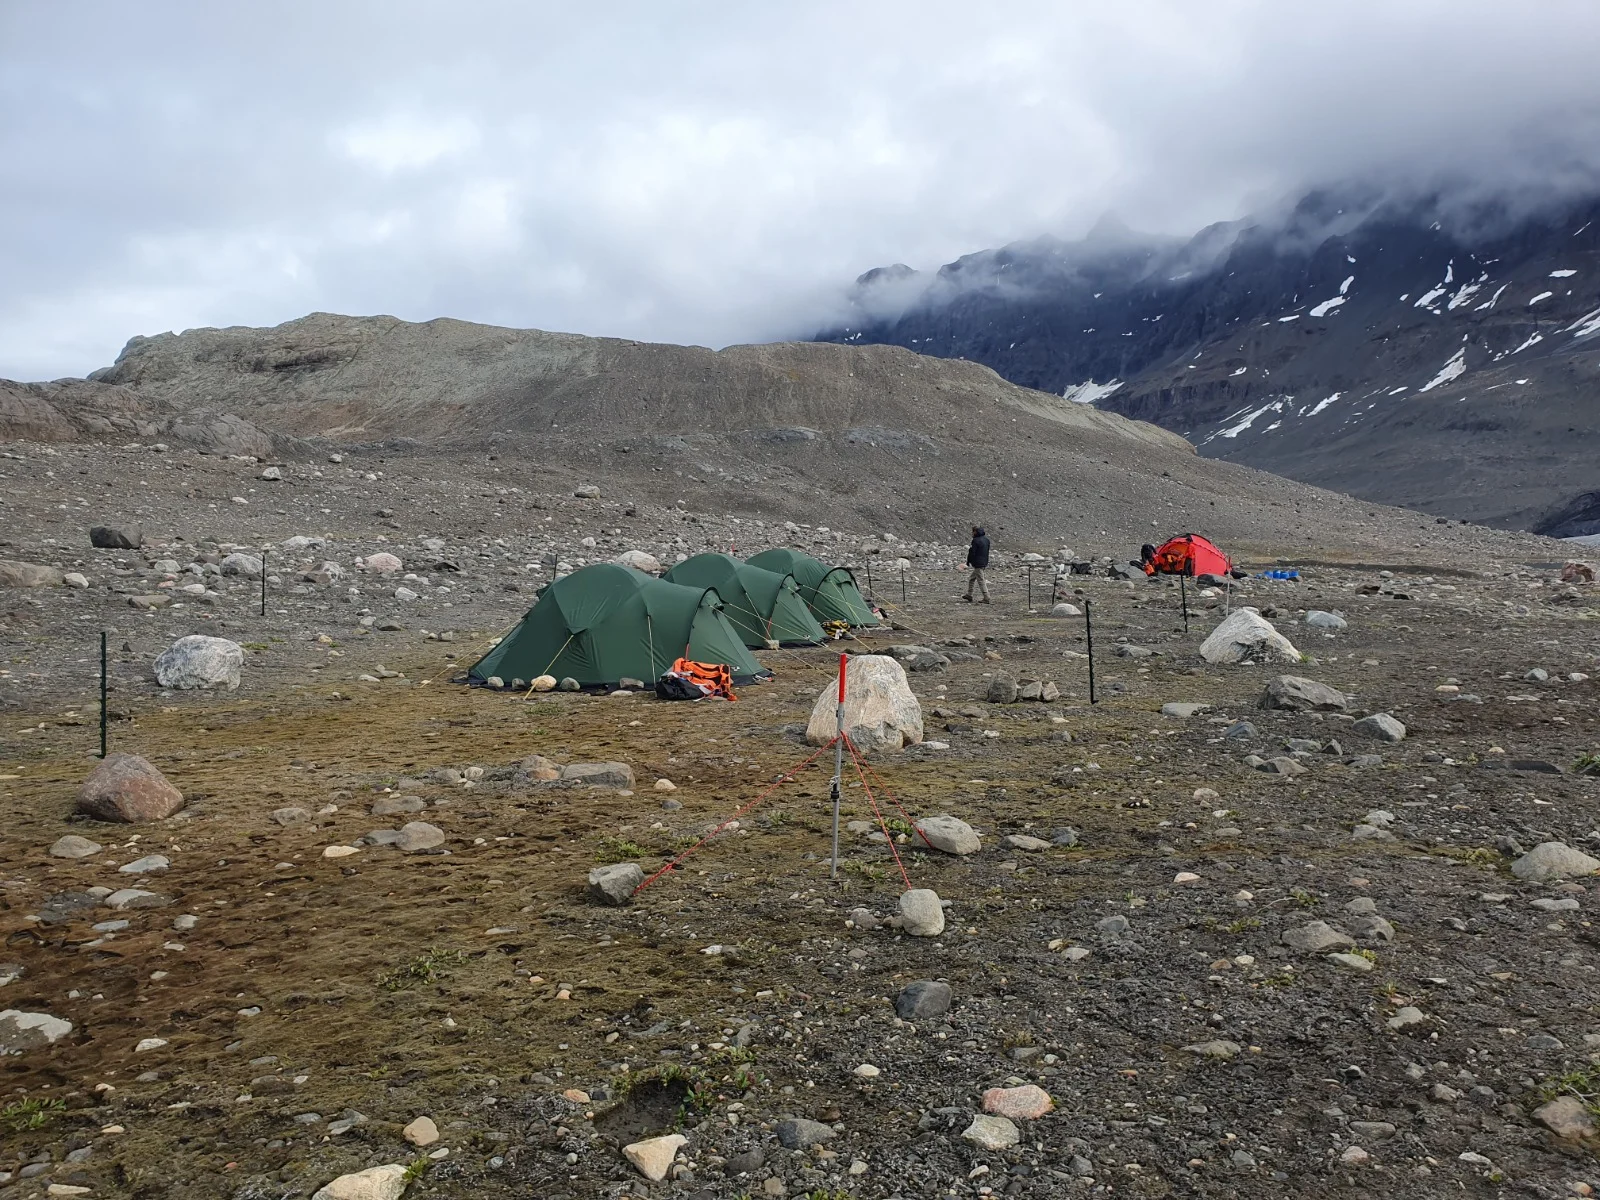
Our camp setup, with the polar bear fence surrounding the sleeping tents, and the red mess tent in the background.
Photo Credit: Blair Fyffe (British Antarctic Survey)
Life on-board and coming home
by Ellie Fisher, Kaelan Weiss, Yoram Terleth
Despite the long shifts and the energy that teams were putting in to bring everything together, it wasn’t all work and no play onboard. The ship had plenty to keep us entertained out at sea, including musical instruments, board games, crosswords, two gyms, and even a sauna! Our 90-strong group of crew and researchers got to know each other well over the course of the trip: forming friendships and finding new colleagues, exercising and relaxing together, and generally making day-to-day life during an intense research schedule more agreeable.
The kitchen team onboard the Sir David Attenborough was simply amazing, and the quality and creativity of meals kept everyone’s spirits high and stomachs full. Mealtimes were very social, and we shared our daily successes and frustrations with supportive ears. Even on a day with more of the latter, it was hard not to be buoyed by the anticipation of a bread and butter pudding, or a melt-in-the-mouth chocolate lava cake for dessert!
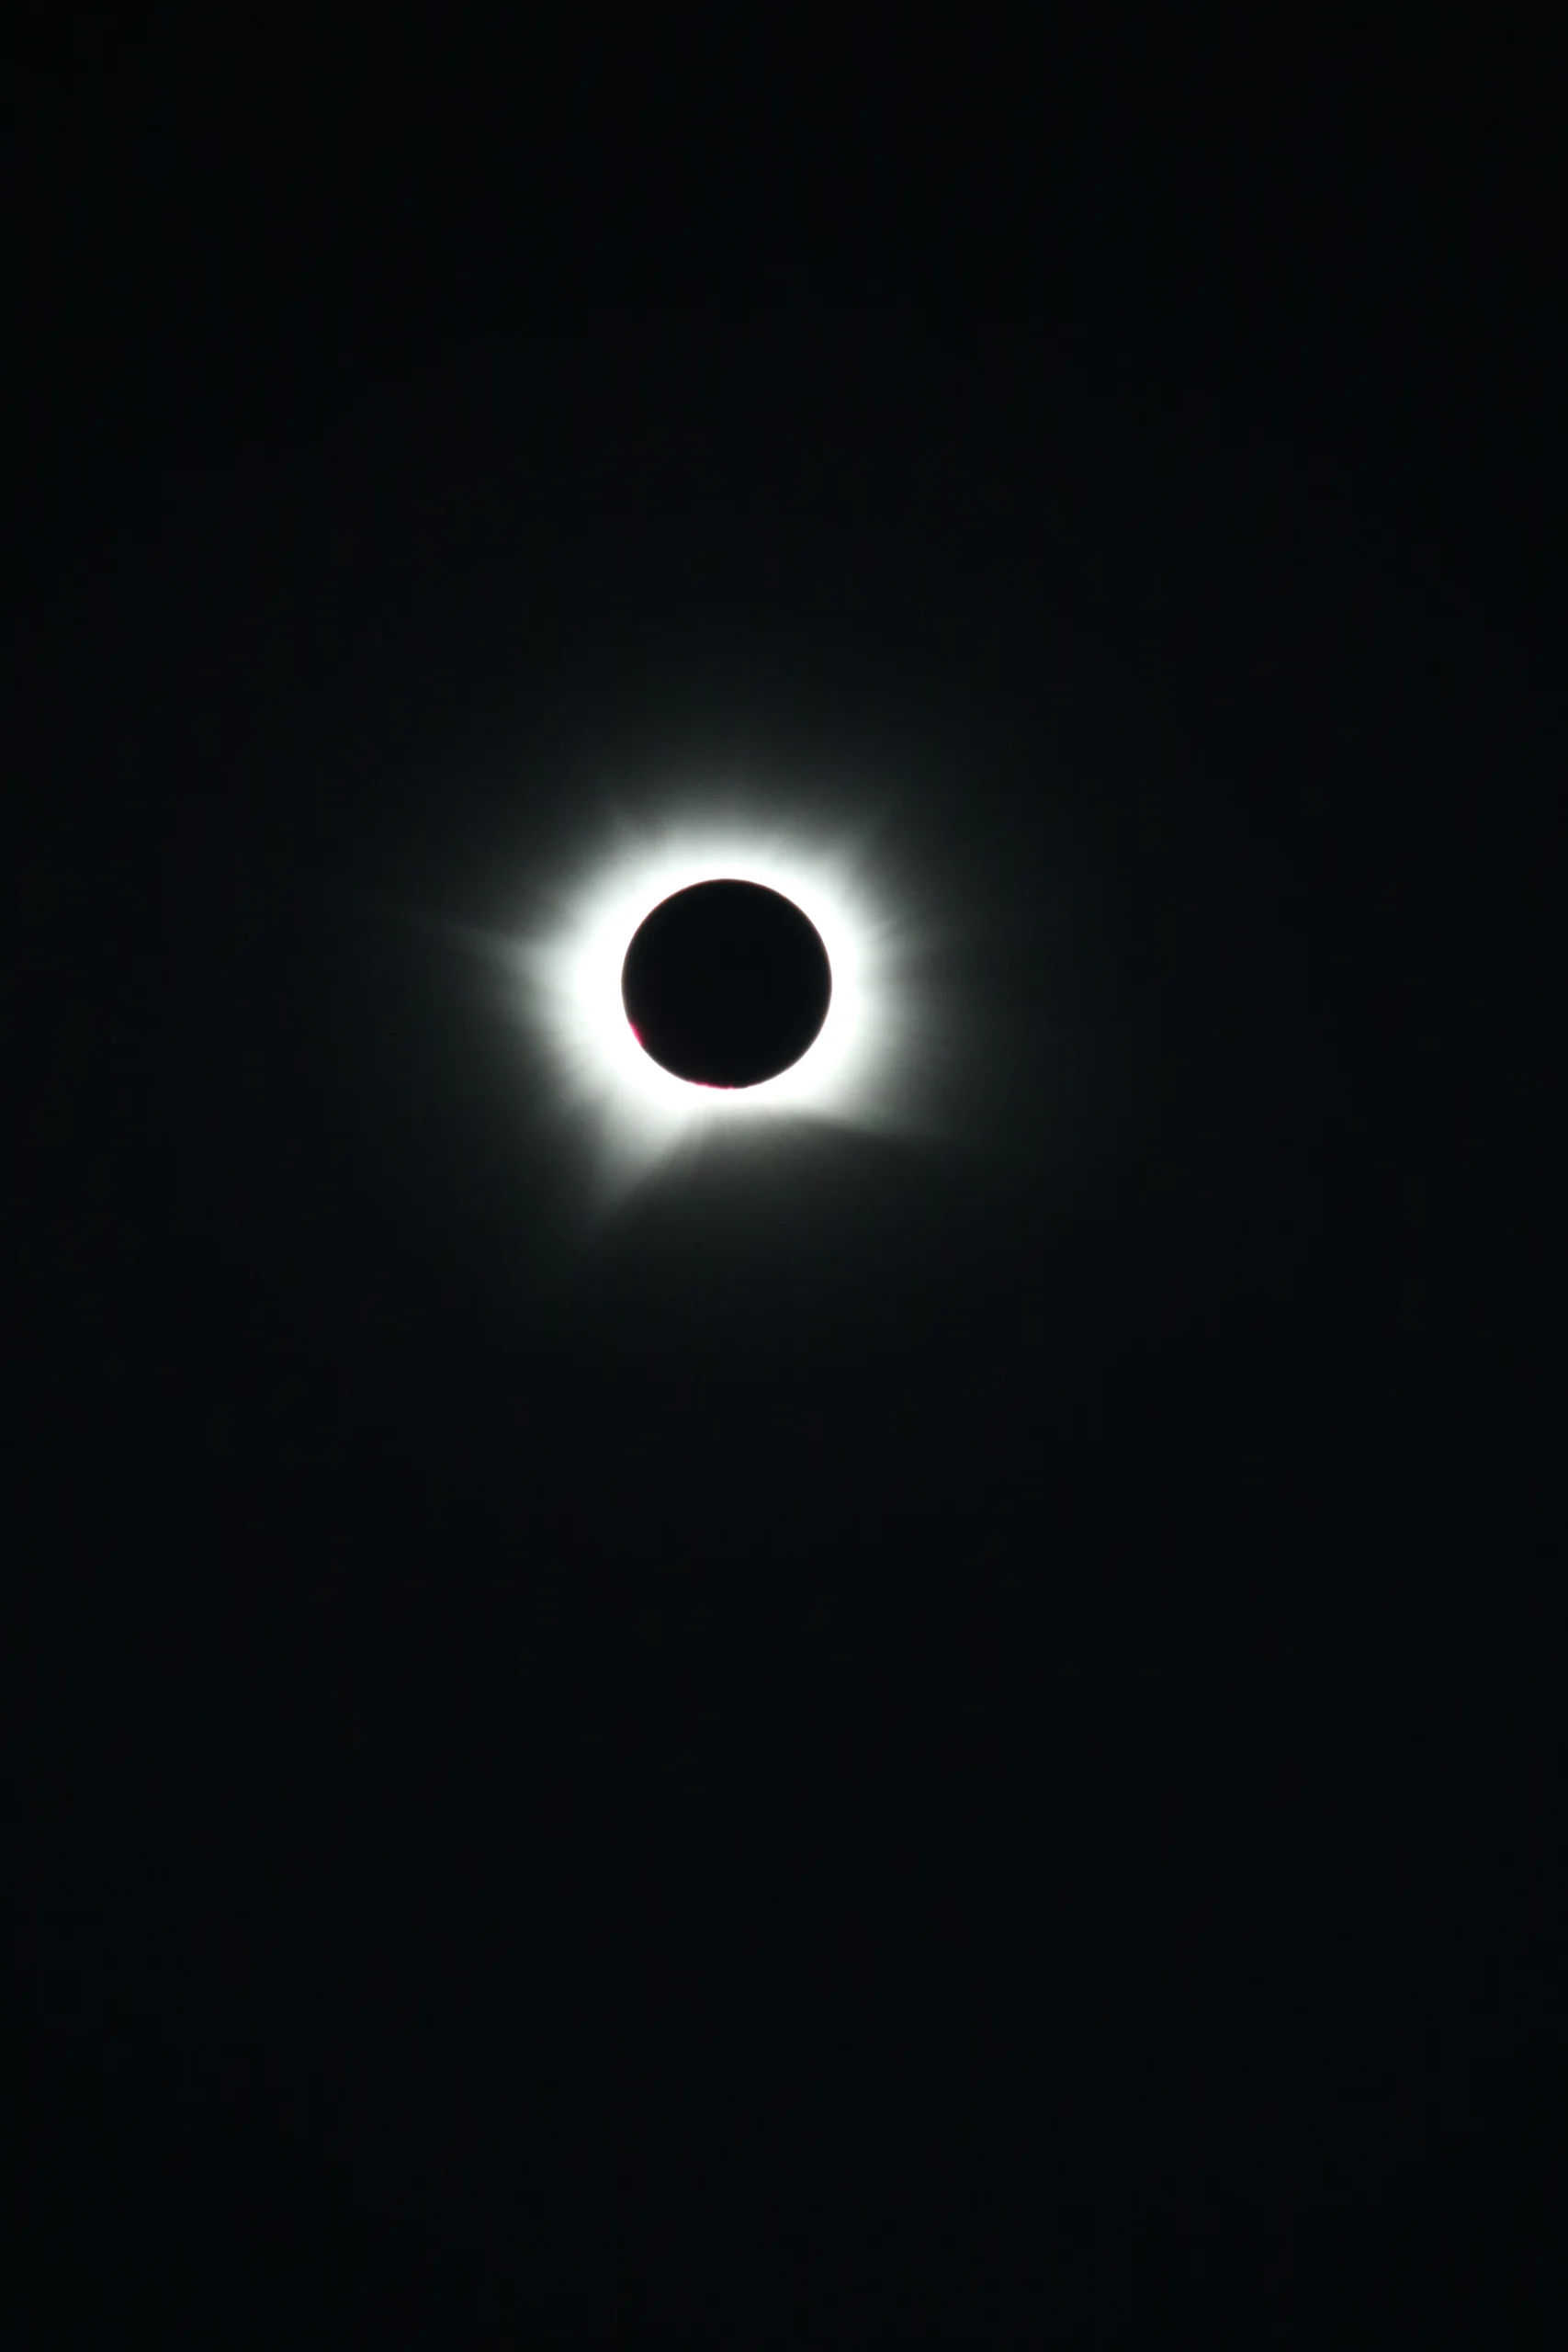
Total solar eclipse on 12th August 2026 at approximately 17:40 UTC-1. Photo Credit: Ellie Fisher
We also had the great fortune to be working close to the path of totality for the solar eclipse which happened on the 12th August, so we took the opportunity to make biological measurements of the water column in the Kivioq fjord (previously-visited by the KANG-GLAC cruise) slightly further up the coast from our “home base”, using echosounders to look at zooplankton activity during and in the aftermath of the eclipse. Ellie and Yoram worked with the Science and Technology Facilities Council (STFC) in the United Kingdom to deliver a live event to an audience of over 1100 members of the public, both online and on-site at the Rutherford Appleton Laboratory. It was fantastic to be able to share the moment of totality from our perspective, and it seemed to go down particularly well with the children in the audience, judging by the barrage of questions we were asked!
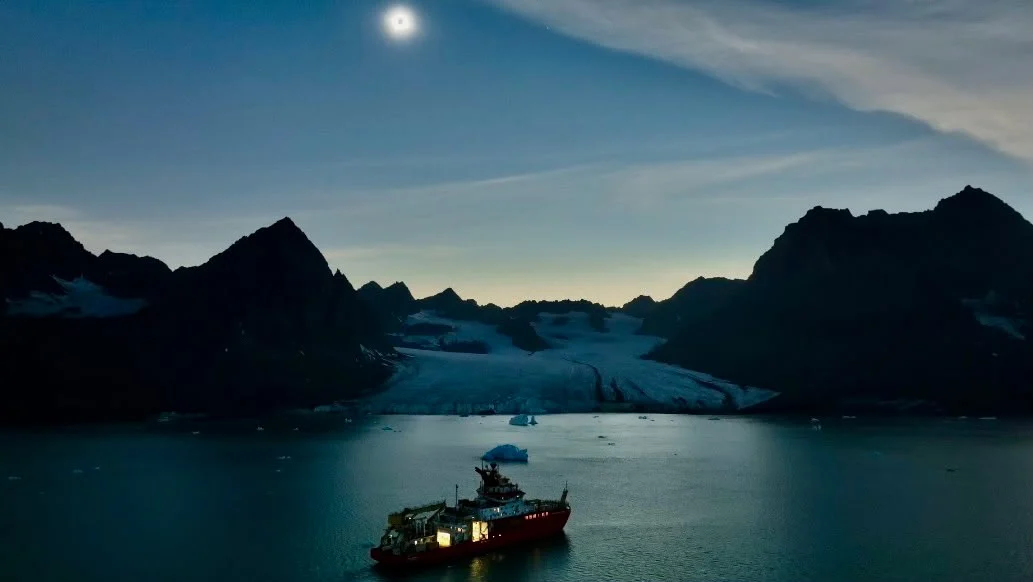
The RRS Sir David Attenborough in Kivioq Fjord, East Greenland during the eclipse. Photo Credit: Rich Dale (SAMS)
Finally, we were sharing the ocean with some pretty special wildlife, and were able to spot some of our marine companions along the way, such as humpback whales bubble feeding just off the coast, seals making the most of undisturbed nap time, and many seabirds of various kinds. The most exciting ID of the trip though, was undoubtedly a polar bear which was spotted just in front of the bow of the ship while transiting along the coast. This was very exciting for all onboard, and I’m sure ticked a bucket list item for many of us!
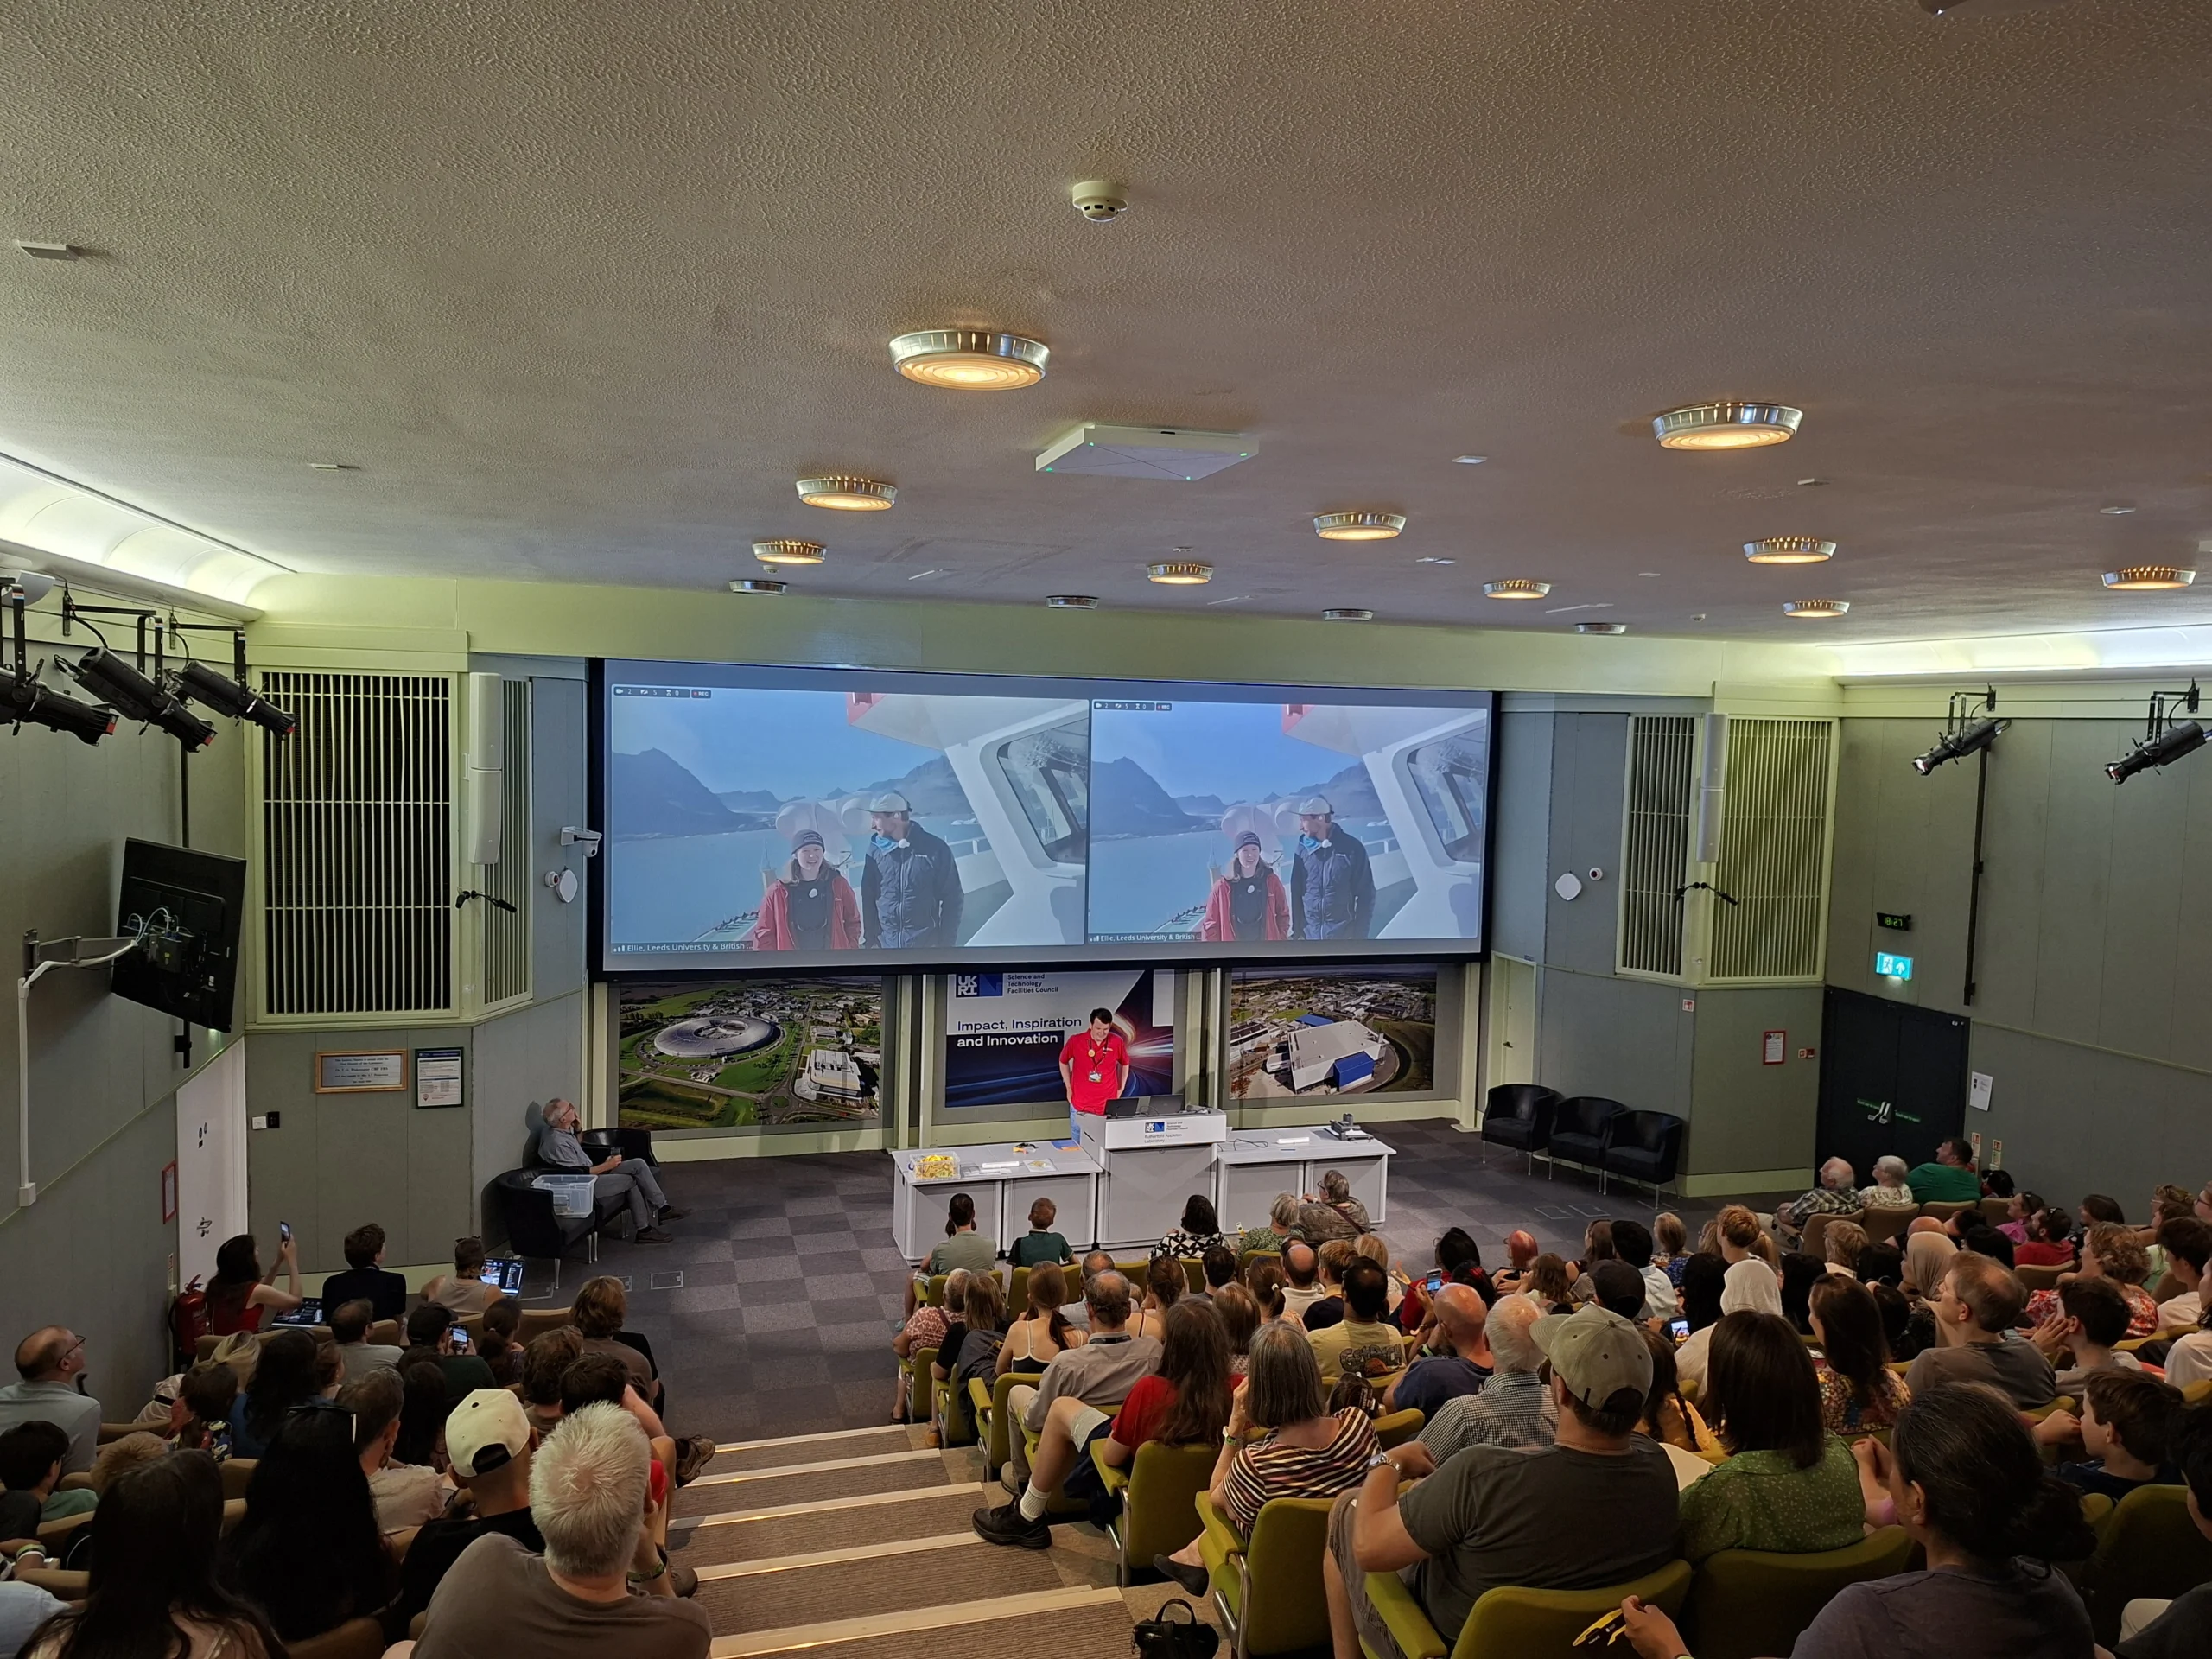
The public engagement event co-hosted between British Antarctic Survey and STFC for the eclipse. Yoram and Ellie are on the screen, and Simon Blackshaw (STFC) is presenting to the room.
Photo Credit: Science and Technology Facilities Council
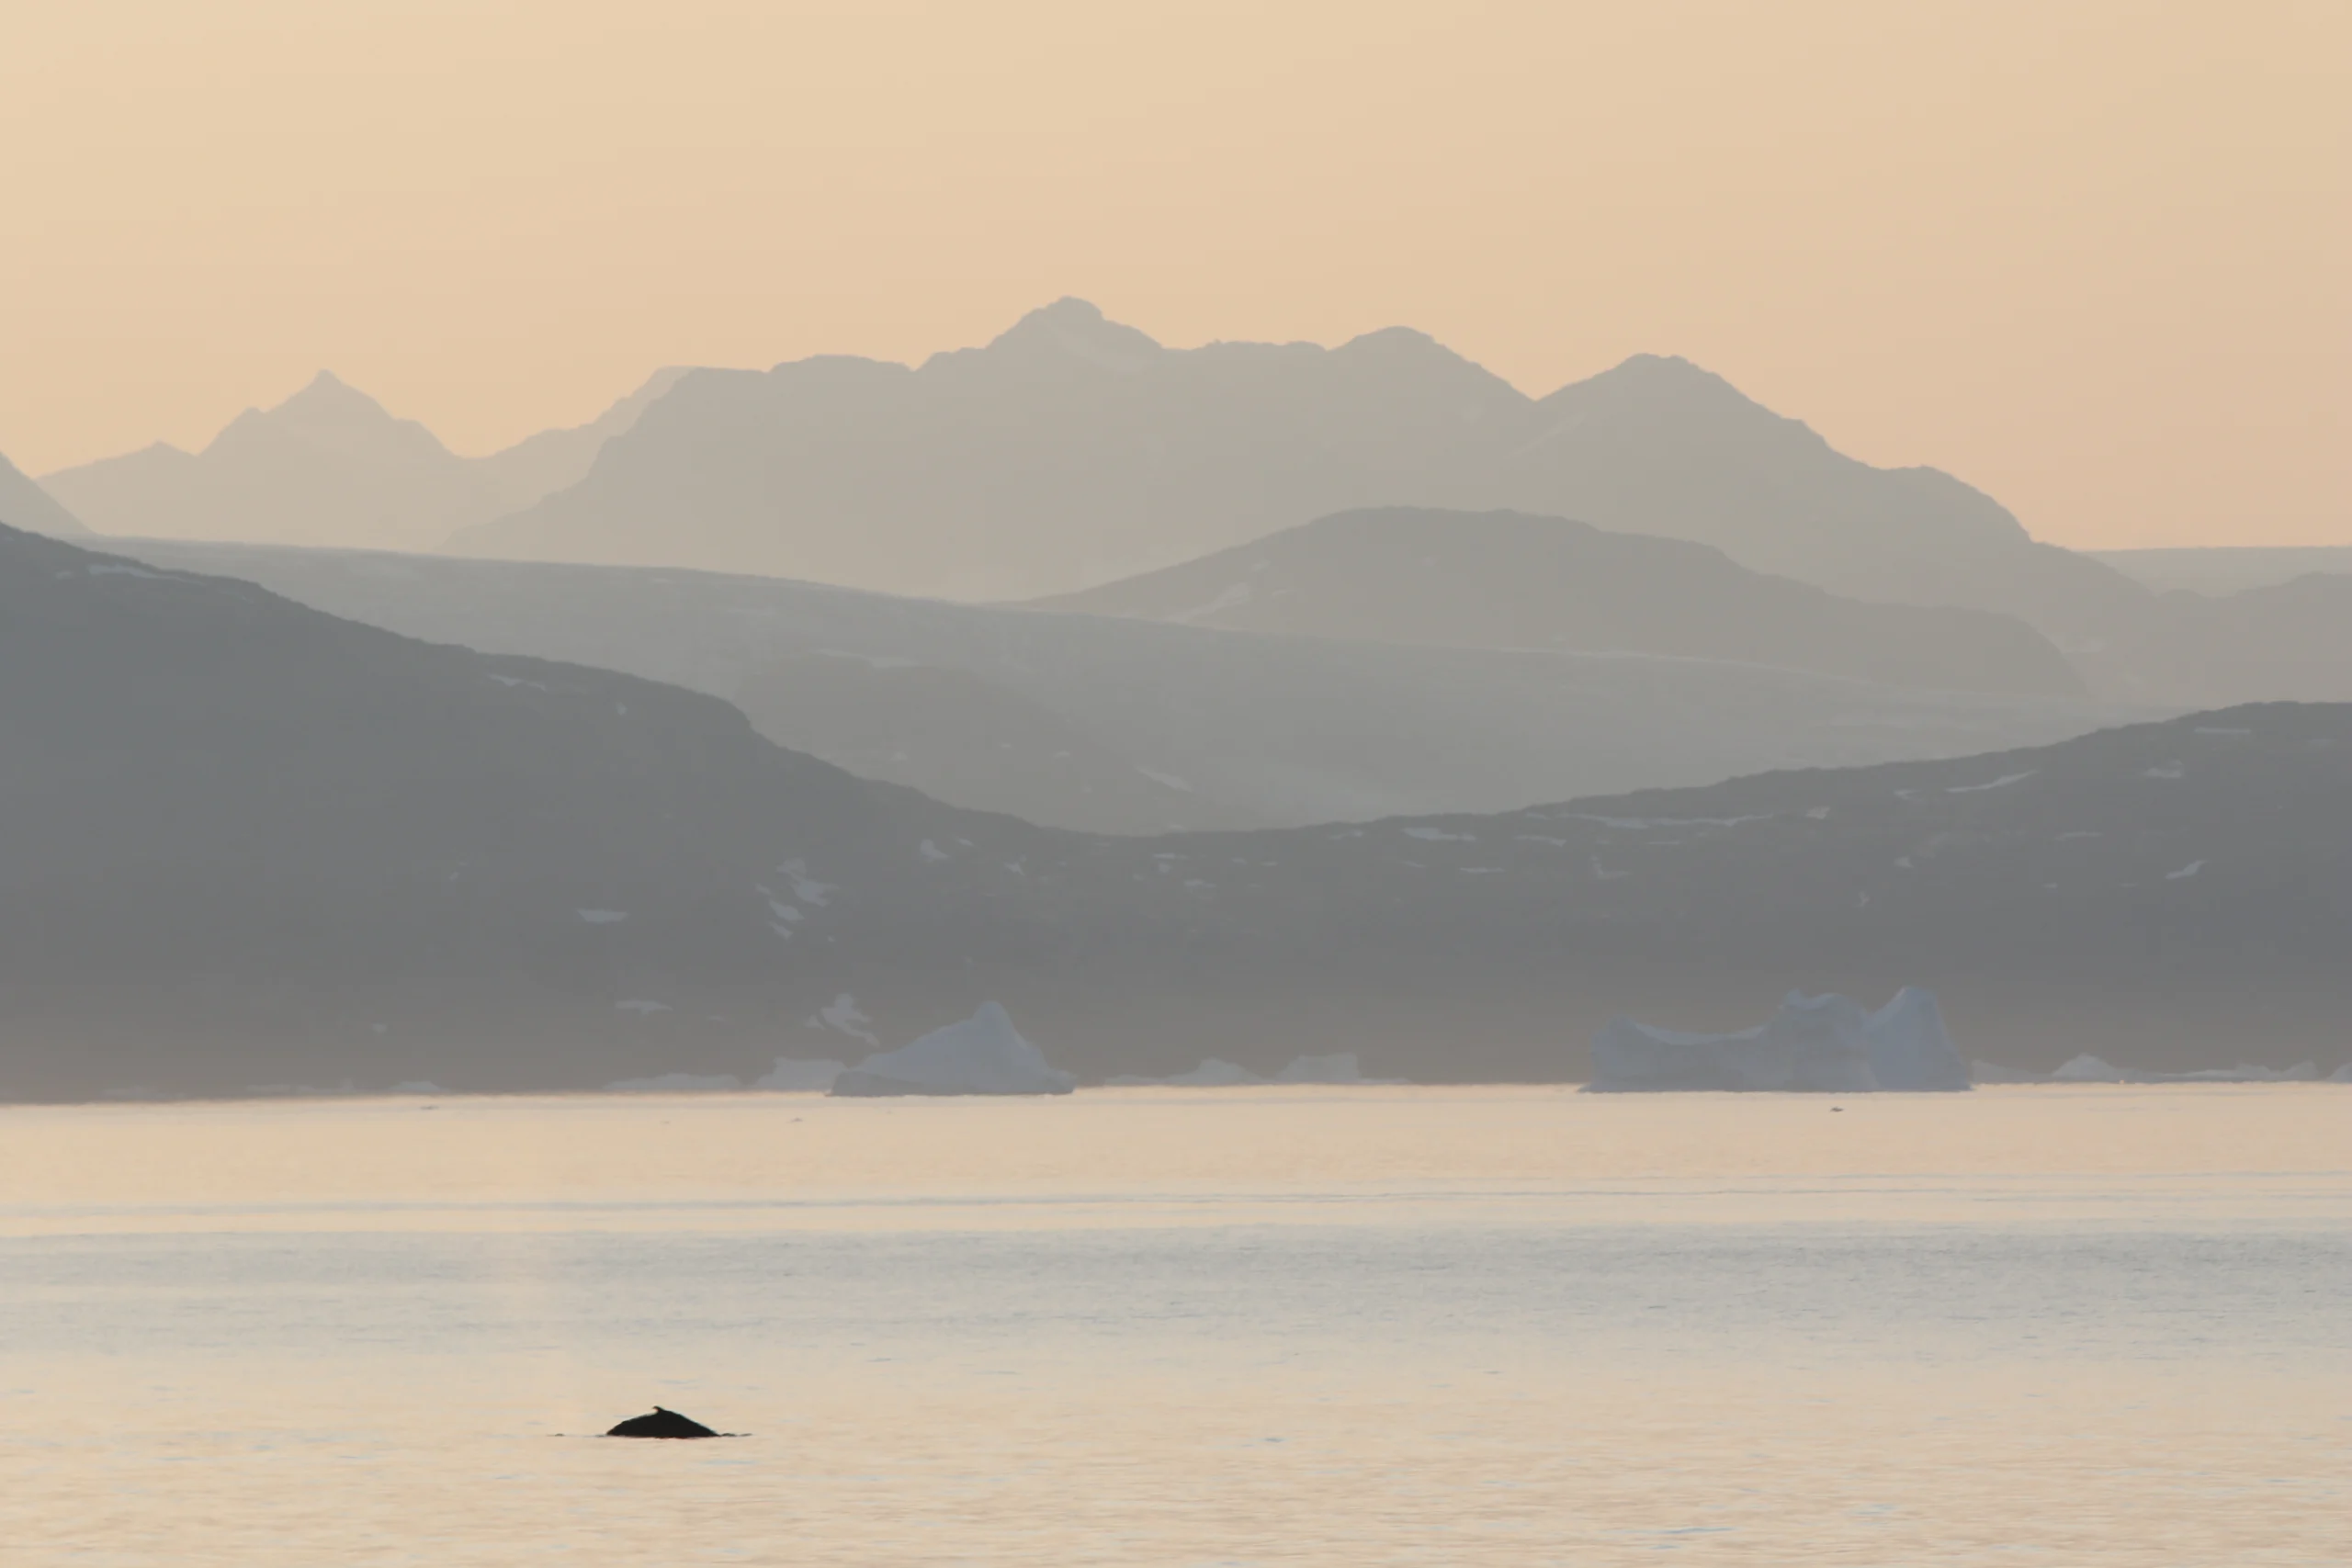
Humpback whale at sunset with Greenland coast in the background. PC: Ellie Fisher
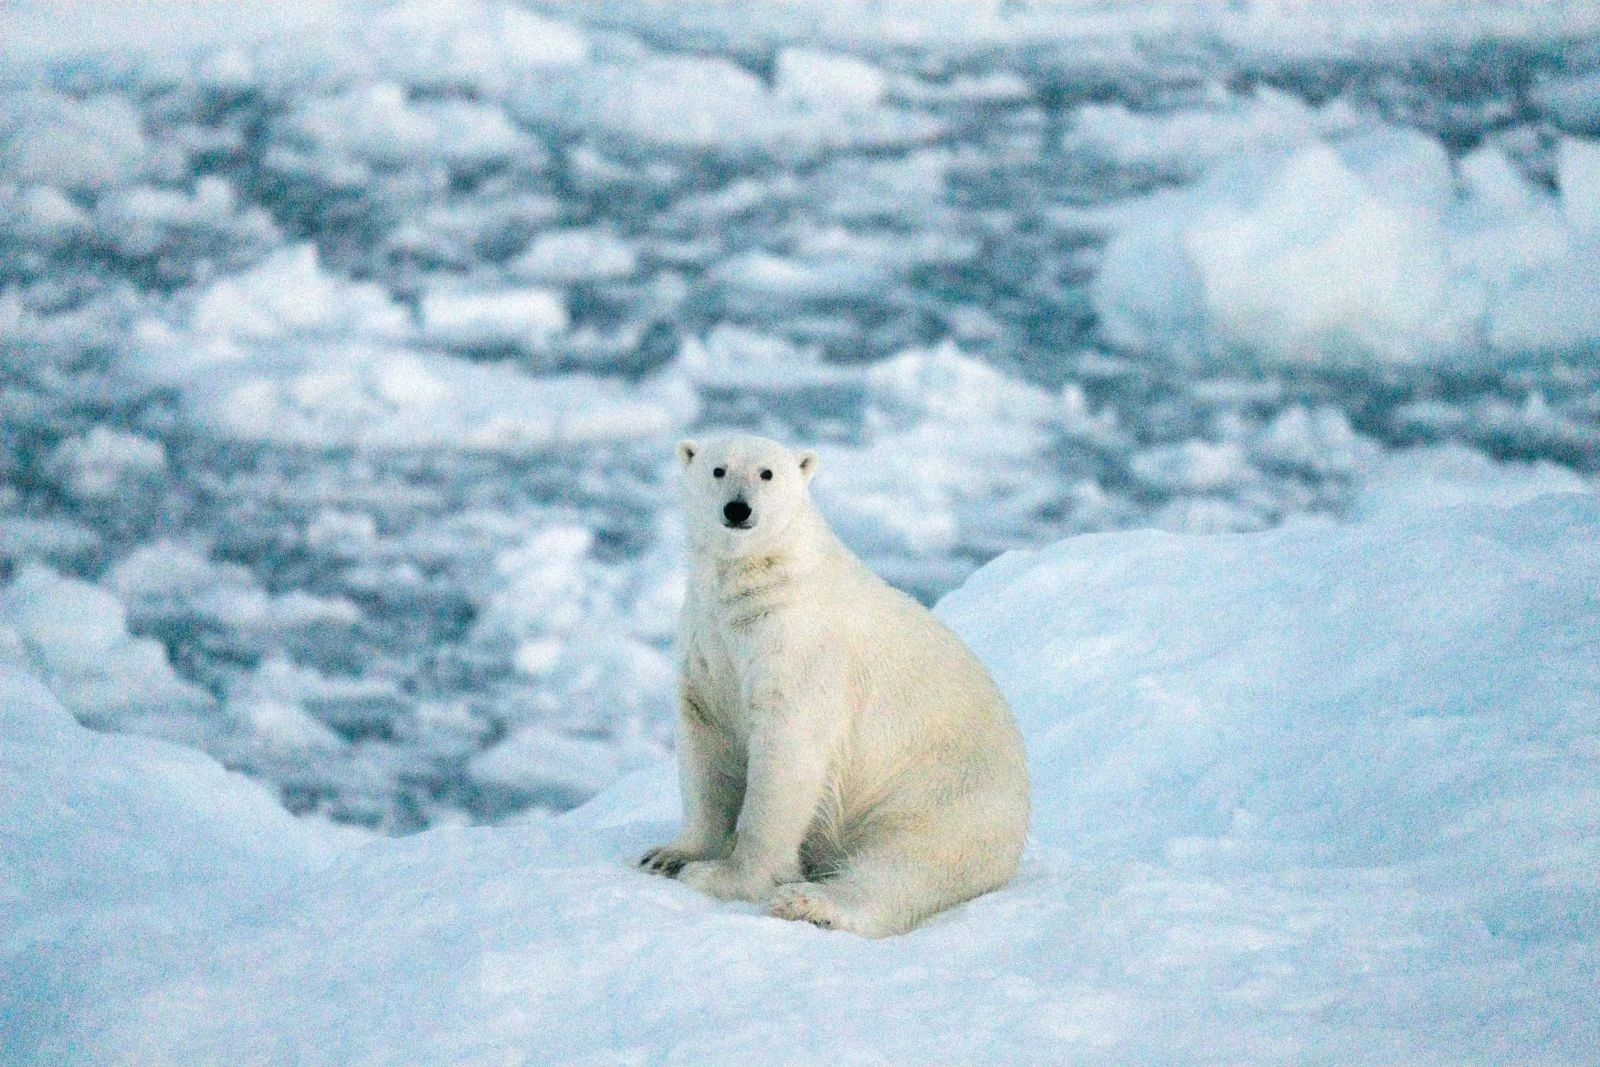
Polar bear spotted in coastal sea ice at night. Photo Credit: Simon Wright (British Antarctic Survey)
Want to know more?
If you’re interested in reading more about our journey and the results of the fieldwork campaign, there is a storymap with photos and behind-the-scenes details here: Inside the GIANT expedition. The project website for GIANT has lots of useful information, including explainers of the instruments used, the ocean modelling and ice sheet simulations being developed, and work being done with communities and collaborators in Greenland. You can read more here: https://giantgreenland.com/
Further Reading:
- In 2024, 3-miippugut was visited by the Sir David Attenborough during the KANG-GLAC scientific cruise (written about by Holly Jenkins here: https://durham-student.org/the-kang-glac-project/), which provided an excellent opportunity for repeat measurements and long-term monitoring on a return visit.
Edited by Mack Baysinger