From 1984 to 2015, approximately 71,000 Olympic size swimming pools worth of water were released from the melting Khumbu Glacier in Nepal, which is home to Everest Basecamp. Find out how Himalayan glaciers are changing and the implications for downstream communities in this Image of the Week. Himalayan glaciers supply freshwater Himalayan glaciers supply meltwater for ~800 million people, includin ...[Read More]
Image of the Week – Ice lollies falling from the sky
You have more than probably eaten many lollipops as a kid (and you might still enjoy them). The good thing is that you do not necessarily need to go to the candy shop to get them but you can simply wait for them to fall from the sky and eat them for free. Disclaimer: this kind of lollies might be slightly different from what you expect… Are lollies really falling from the sky? Eight years ag ...[Read More]
Image of the Week – How geometry limits thinning in the interior of the Greenland Ice Sheet

The Greenland ice sheet flows from the interior out to the margins, forming fast flowing, channelized rivers of ice that end in fjords along the coast. Glaciologists call these “outlet glaciers” and a large portion of the mass loss from the Greenland ice sheet is occurring because of changes to these glaciers. The end of the glacier that sits in the fjord is exposed to warm ocean water that can me ...[Read More]
Image of the Week – Ice Ice Bergy

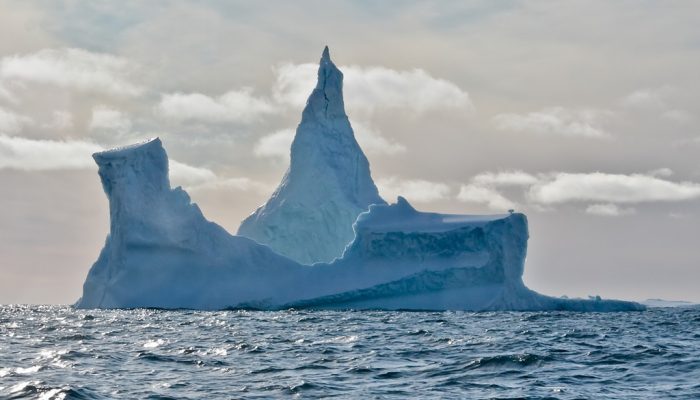
They come in all shapes, sizes and textures. They can be white, deep blue or brownish. Sometimes they even have penguins on them. It is time to (briefly) introduce this element of the cryosphere that has not been given much attention in this blog yet: icebergs! What is an iceberg? Let’s start with the basics. An iceberg, which literally translates as “ice mountain”, is a bit of fresh ice that brok ...[Read More]
Image of the Week – Antarctica’s Flowing Ice, Year by Year
Today’s Image of the Week shows annual ice flow velocity mosaics at 1km resolution from 2005 to 2016 for the Antarctic ice sheet. These mosaics, along with similar data for Greenland (see Fig.2), were published by Mouginot et al, (2017) last month as part of NASA’s MEaSUREs (Making Earth System Data Records for Use in Research Environments) program. How were these images constructed? The mosaics s ...[Read More]
Image of the Week – A rather splendid round-up of CryoEGU!
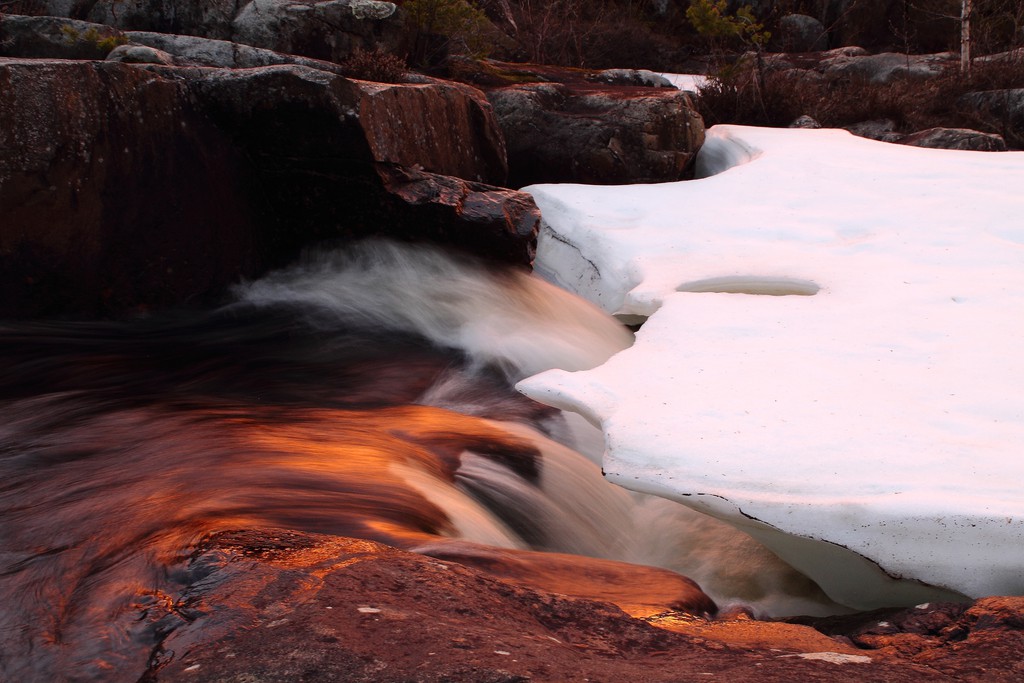
The 2017 edition of the EGU general assembly was a great success overall and for the cryospheric division in particular. We were for instance thrilled to see that two of the three winning photos of the EGU Photo contest featured ice! To mark the occasion we are delighted to use as our image of this week, one of these pictures, which shows an impressive rapid in the Pite River in northern Sweden. ...[Read More]
Image of the Week — We’re heading for Vienna
♫ Tatata taaa tatatatata Tatata taaa tatatatatatatata We’re heading for Vienna (Vienna) And still we stand tall ‘Cause maybe they’ve seen us (seen us) And welcome us all, yeah With so many miles left to go And things to be found (to be found) I’m sure that we’ll all miss that so it’s the … ♫ …congratulations, you’ve recognise the song….. ...[Read More]
A brief guide to navigating EGU 2017!
Are you going to the EGU General Assembly in Vienna next week? If so, read on for a quick guide to navigating the week: Where to start, what to see and how to meet people and enjoy yourself! After all, the meeting is as much about the opportunities meet scientists from all over the world as it is about the science itself. How on Earth do I know what is going on?! The EGU General Assembly is a mass ...[Read More]
Image of the Week – A high-resolution picture of Greenland’s surface mass balance

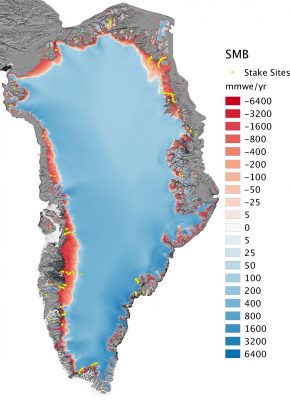
The Greenland ice sheet – the world’s second largest ice mass – stores about one tenth of the Earth’s freshwater. If totally melted, this would rise global sea level by 7.4 m, affecting low-lying regions worldwide. Since the 1990s, the warmer atmosphere and ocean have increased the melt at the surface of the Greenland ice sheet, accelerating the ice loss through increased runoff of meltwater and i ...[Read More]
Image of the Week – The ups and downs of sea ice!

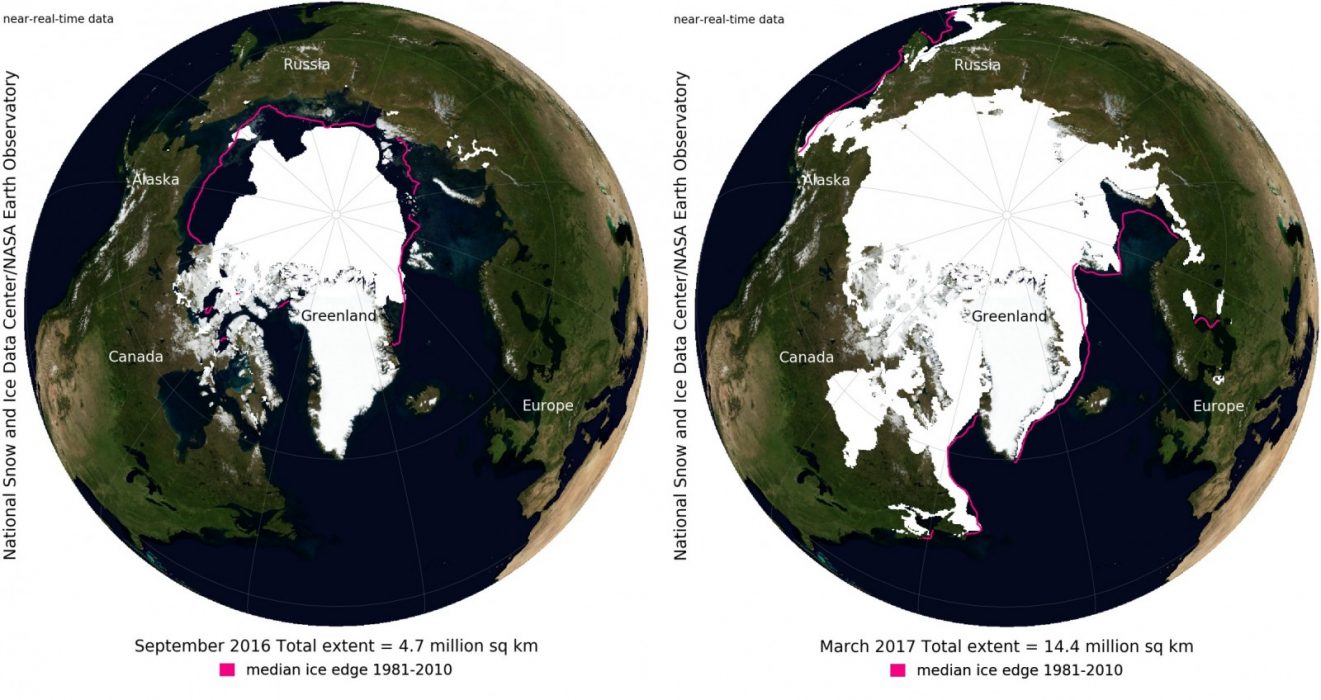
The reduction in Arctic sea-ice cover has been in the news a lot recently (e.g. here) – as record lows have been observed again and again within the last decade. However, it is also a topic which causes a lot of confusion as so many factors come into play. With this Image of the Week we will give you a brief overview of the ups and downs of sea ice! In general, Arctic sea ice is at its minim ...[Read More]


