Narrabeen–Collaroy Beach in New South Wales, Australia, just north of Sydney, is home to one of the longest-running shoreline-measurement programmes in the world. With colleagues at the University of New South Wales (UNSW) Sydney, Eli Lazarus, an associate professor in geomorphology at the University of Southampton, UK, has been analysing over 40 years of data from Narrabeen–Collaroy to better understand how shorelines recover from major storm events.
In this blog post, Lazarus shares a glimpse of the programme’s history and describes his experience of visiting a field site that for him is both familiar and brand new.
“Want to see what an old GPS unit looks like after it’s been up and down the beach a thousand times?”
Mitchell Harley, a Scientia Fellow and coastal researcher at the UNSW Sydney Water Research Laboratory (WRL), in Manly Vale, Australia, handed me a battered, corroded, steel-cased receiver the size of a grapefruit. “It’s also seen a lot of Duct Tape.”
He loaded a carbon-fibre survey staff and a yellow Pelican case containing a new, a top-of-the-line Trimble GPS handset into the back of a WRL vehicle. With two visiting masters students – Tim van Dam from TU Delft, and Yann Larré from École Polytechnique – we set off on our afternoon excursion, to Narrabeen.
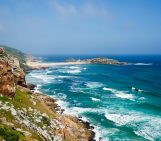
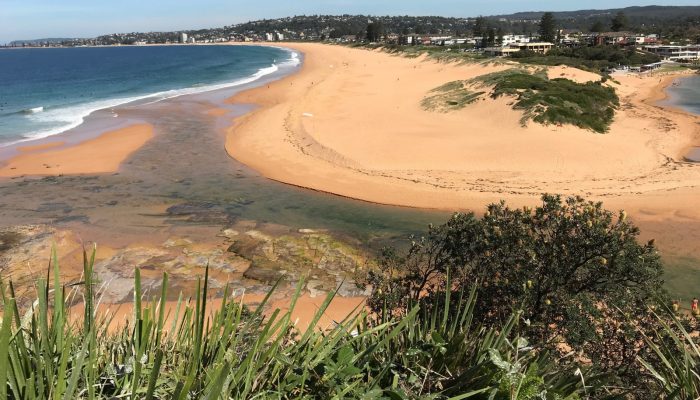
View of Narrabeen Beach, looking south from Narrabeen Headland. Credit: Eli Lazarus
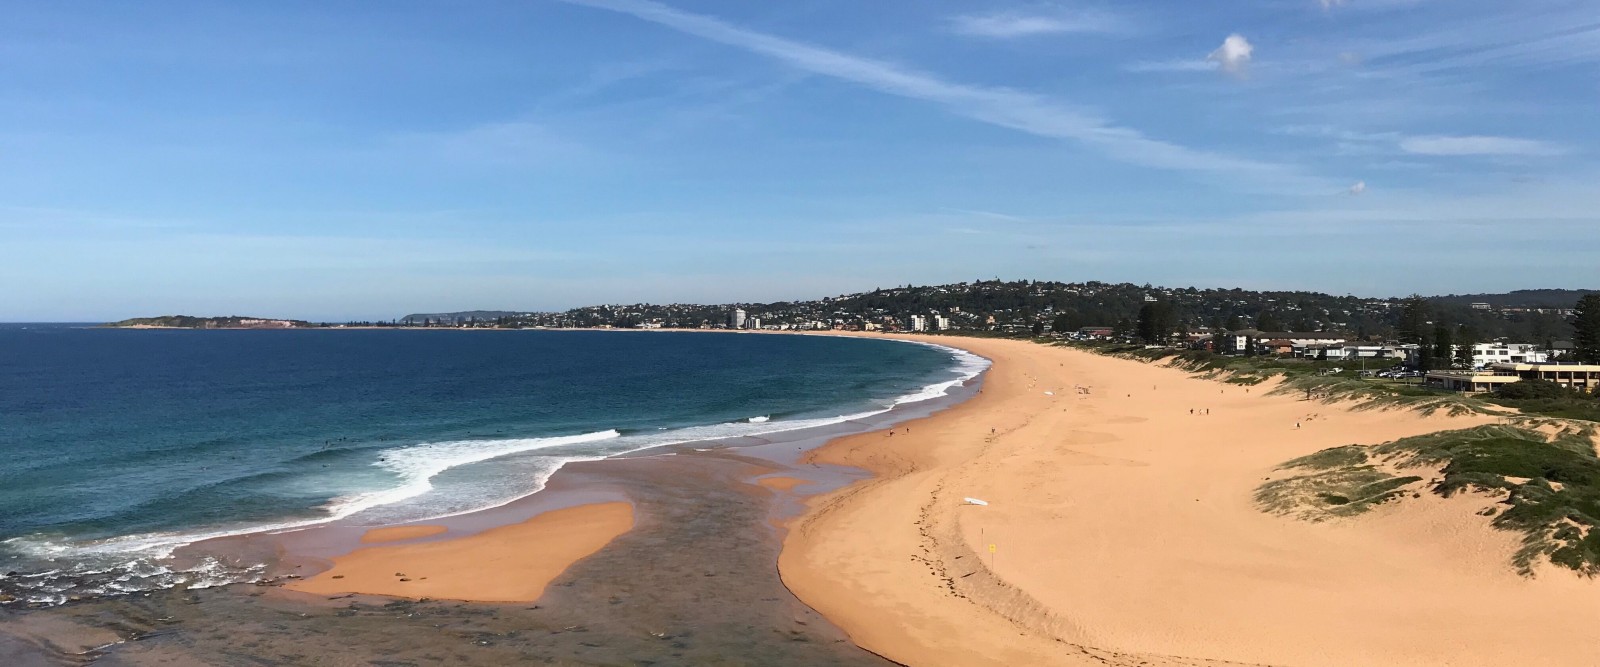
Facing the open South Pacific, Narrabeen and Collaroy are the northern and southern halves of an embayed beach, a reach of sand framed at either end by rocky promontories, that extends approximately three-and-a-half kilometres between Narrabeen Headland and Long Reef Point. Narrabeen is the keystone of the Northern Beaches, a chain of sandy pockets defining the coastal peninsula north of Sydney. The beaches darken in colour with each embayment, from dun in the south to a reddish ochre in the north, representative of the ancient sandstone bedrock units in which they sit.
Narrabeen is a legendary surf break and home turf to a roll of world champions, where, to date, the locals have successfully prevented the installation of anything that resembles a surf cam. But the beach is also home to one of the longest-running and most complete beach-survey programmes in the world (Turner et al., Sci Data 2016).
In 1976, the renowned coastal scientist Andy Short, who used to live in Narrabeen, began the programme from the beach across the street from his house. He and family members, colleagues, friends, and volunteers diligently measured a set of cross-shore profiles along the full Narrabeen–Collaroy embayment every month for 30 years.
All long-term monitoring endeavours are labours of love. But frequent, detailed measurements of beach morphology, maintained consistently over long time scales, are exceptionally rare, and they offer essential quantitative insight into coastal events, changes, and cycles that occur more rapidly than most records tend to capture.
Harley took over the measurement programme in 2006, along with Ian Turner, who now directs the Water Research Lab, and recorded more than 120 monthly surveys of the full beach with a quad-bike Harley would trailer back and forth from Manly Vale.

Harley’s quad-bike – and shoreline-survey workhorse – at the UNSW Sydney Water Research Lab. Credit: Eli Lazarus
The Water Research Laboratory team has continued to experiment with different measurement methods for the Narrabeen–Collaroy system. Mounted on the top floor of the Flight Deck, a beachfront hotel where Narrabeen blends into Collaroy, is an array of five cameras, known as an Argus station, that takes time-averaged photos of the shoreline and surf zone. Tucked in among the cameras is a smoked-glass dome that looks like a space helmet: a lidar unit that uses a laser to measure wave swash and a cross-shore profile of beach elevation five times every second.
On our outing, Harley first drove us up Narrabeen Headland, to get an unobstructed southerly view of the bay. At the overlook was a stainless-steel post with a frame to hold a smartphone. This was the Narrabeen CoastSnap station.
In 2017, Harley, along with collaborators from the New South Wales State Government, launched the CoastSnap programme to collect crowd-sourced observations of beach dynamics (Harley et al., 2019). The process is simple: take a photo, post the image on social media with the station hashtag (#CoastSnapNarra, for example), and if you don’t post it right away, then write in the date and time of the image. With some clever analytical tricks, an algorithm finds the shoreline in your photo. Harley installed the first CoastSnap station at Manly Beach, above the Manly Surf Life Saving Club. There are now more than 35 CoastSnap stations in nine countries around the world.
Harley pointed out the various permanent features the algorithm uses to identify the shoreline position in every #CoastSnapNarra photo: an inlet hazard sign, the corners of prominent buildings in the foreground and distance. “We get about an image a day from people up here,” he said. Watching a sparse line-up of surfers work a peeling break at Narrabeen Inlet, we stood eating steak pies from The Upper Crust – like the surfers, another local institution.
Pies finished, we looped back down to the north end of the beach and assembled the GPS. The four of us would take turns walking the GPS receiver down the five main cross-shore transects still sampled at Narrabeen and Collaroy every month, and the three visitors would get our names added to the dataset’s long list of contributors.

Harley, Larré (holding GPS) and van Dam working through a beach profile. Credit: Eli Lazarus
In a reversal of cart and horse, I had written a scientific article about Narrabeen but never seen it. In fact, I was there in Sydney to visit people I had co-authored with but never met in person.
Earlier this year, Harley, Chris Blenkinsopp (of Bath University in the UK, and a former postdoc at WRL), Turner, and I published a paper in the EGU journal Earth Surface Dynamics about the information that shoreline records retain or destroy regarding the environmental conditions that shape them (Lazarus et al., 2019).
Extreme storm events, for example, can inscribe dramatic changes in the shape of a coastline. A detailed, high-frequency record of shoreline position presumably should reflect something about the magnitude of those events. But sedimentary systems can be very effective at obscuring or erasing their own histories, and not all evidence of conditions that impact a shoreline gets preserved. This phenomenon is known as ‘signal shredding’. The exceptional data catalogue for Narrabeen–Collaroy enabled us to pursue the first empirical test of signal shredding at a sandy beach, an idea I’d puzzled over since geomorphic signal-shredding was first described for other sediment-transport systems almost ten years ago (Jerolmack & Paola, 2010).
Among our survey crew, I asked to take Profile 4, near the middle of the embayment, because that was the record I had used the most when working through the signal-shredding analysis. To me, Profile 4 seemed to best capture, in a single line, the spatially variable character of the beach overall.
As we leapfrogged our way south, the beach profile became steeper and narrower. Harley mentioned an article that he had published with Turner and Short (Harley et al., 2015) that described, among other patterns at Narrabeen, a spatial pattern in the beach slope. If one end of the beach was steeply sloping toward the water, then the other end would be flat. The steep stretches of the beach tended to be narrow, and the flat stretches tended to be wide. Under certain wave conditions, the narrow, steep end of the would switch to being wide and flat, and vice versa – a pattern typical of embayed beaches called ‘rotation’.
As Harley described the slope pattern, the observation struck me as the kind that comes from investing time at a field site: the intuition internalised by surveying the beach over and over again in the seat of a quad-bike, from tipping sideways in the steeps and tracing the long meanders of the shoreline across the flats.
Standing astride the sharp break in beach slope at Collaroy, looking south toward Long Reef. Credit: Eli Lazarus
We finished the day with a walk around Long Reef, at Collaroy, looking back into the embayment we’d spent the afternoon traversing. Hang-gliders drifted in slow figure-eights above us. I was headed back to the UK the next day. There is more work to be done at Narrabeen, for sure, and we talked about what’s coming next: algorithms for predicting shoreline position (Davidson et al., 2017), fresh insights into beach recovery after major storms (Phillips et al., 2019), identifying shorelines from catalogues of satellite imagery (Vos et al., 2019). We talked about possible funding avenues to keep fuelling our collaboration.
The wind picked up, and the waves set to work rearranging the shoreline we had just measured.
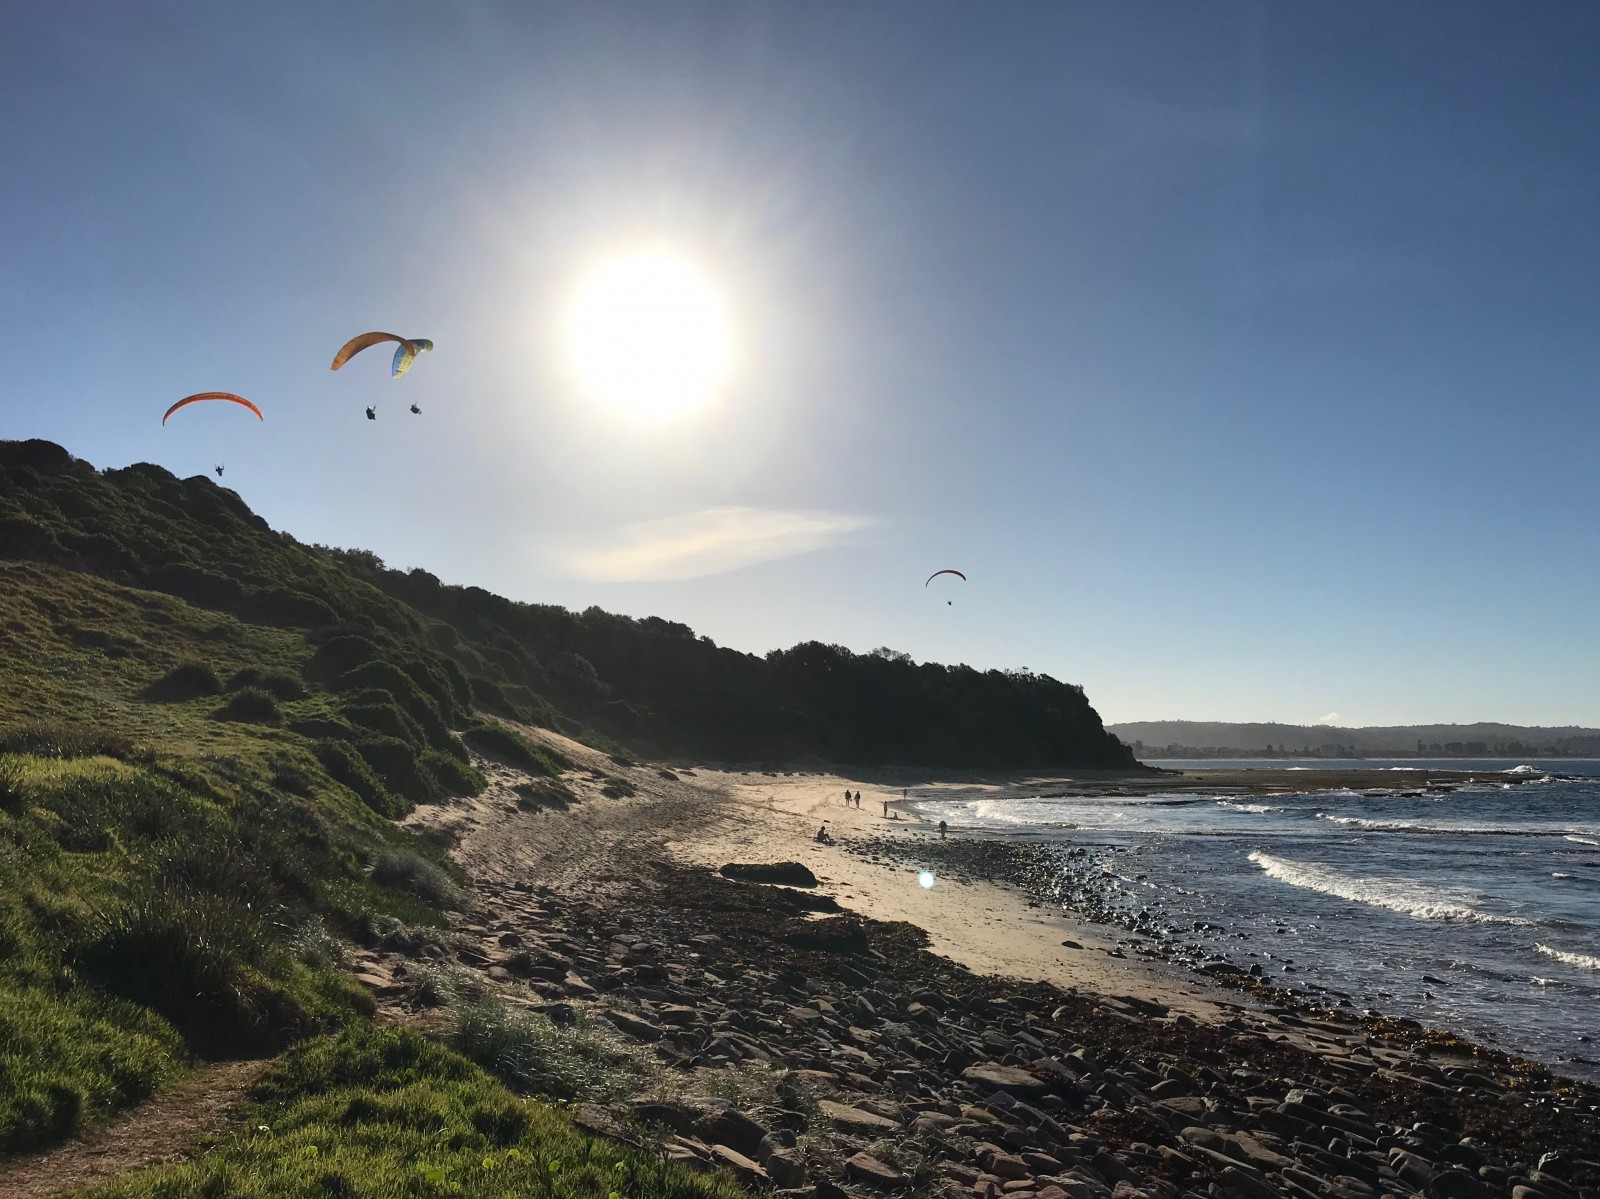
Day’s end and hang-gliders at Long Reef, looking northwest toward Collaroy and Narrabeen. Credit: Eli Lazarus
By Eli Lazarus, University of Southampton, UK
Dr Eli Lazarus (@envidynxlab) is an Associate Professor in Geomorphology in the School of Geography & Environmental Science at the University of Southampton, UK.