Bruce Springsteen was playing at Barcelona’s football stadium on 14th May 2016. 65,000 people were there to hear him as he launched into an encore including “Born in the USA”, “Dancing in the Dark” and “Shout”. But unknown to Springsteen, just 500 metres away, in the basement of the Institute of Earth Sciences Jaume Almera (ICTJA), Jorde Díaz and his colleagues were also listening in via their broadband seismometer. “We have beautiful recordings of rock concerts,” says Díaz, the scientific director of the Seismic Laboratory at ICTJA, part of the Spanish Scientific Research Council (CSIC).
The first global seismic networks, installed in the 1960s and 1970s, were set up, not to record earthquakes, but to listen in on human activities. Their primary goal was to monitor nuclear tests during the height of Cold War tension. Since then, the same devices have been used extensively and successfully to record the Earth’s natural vibrations, allowing scientists to study earthquakes and volcanoes, as well as map the interior of the Earth in remarkable detail. But researchers are now turning their attention to human activities again; this new field of urban seismology aims to detect the vibrations caused by road traffic, subway trains, and even cultural activities.
“Our motivation for installing this station was mainly for outreach,” Díaz says, “to show [people] how a seismometer works.” But Díaz soon realised that there might be useful information buried within the seismic noise at this new station. “We identified a number of signals and we wanted to know the origin of these signals. Some of them are quite amusing,” he recalls.
Some of these less conventional signals were so-called “foot-quakes”, tremors associated with goals scored at the Barcelona football stadium. “We can get information every time there is a goal,” says Díaz. “Or at least every time there is a Barcelona goal. Not the other side! People jump and then the shaking is recorded at our instrument.” Indeed, ever since the famous Gol del terremoto, Earthquake’s Goal, in Argentina in 1992, we have known that football fans could be picked up by seismometers.
Springsteen’s concert was another of the less orthodox events that the seismologists were able to study. As well as a simple seismogram of the whole four-hour show, which shows the magnitude of the shaking through time, Díaz also plots his data on a spectrogram. The spectrogram reveals the different frequencies present in the vibrations and how they change over time.
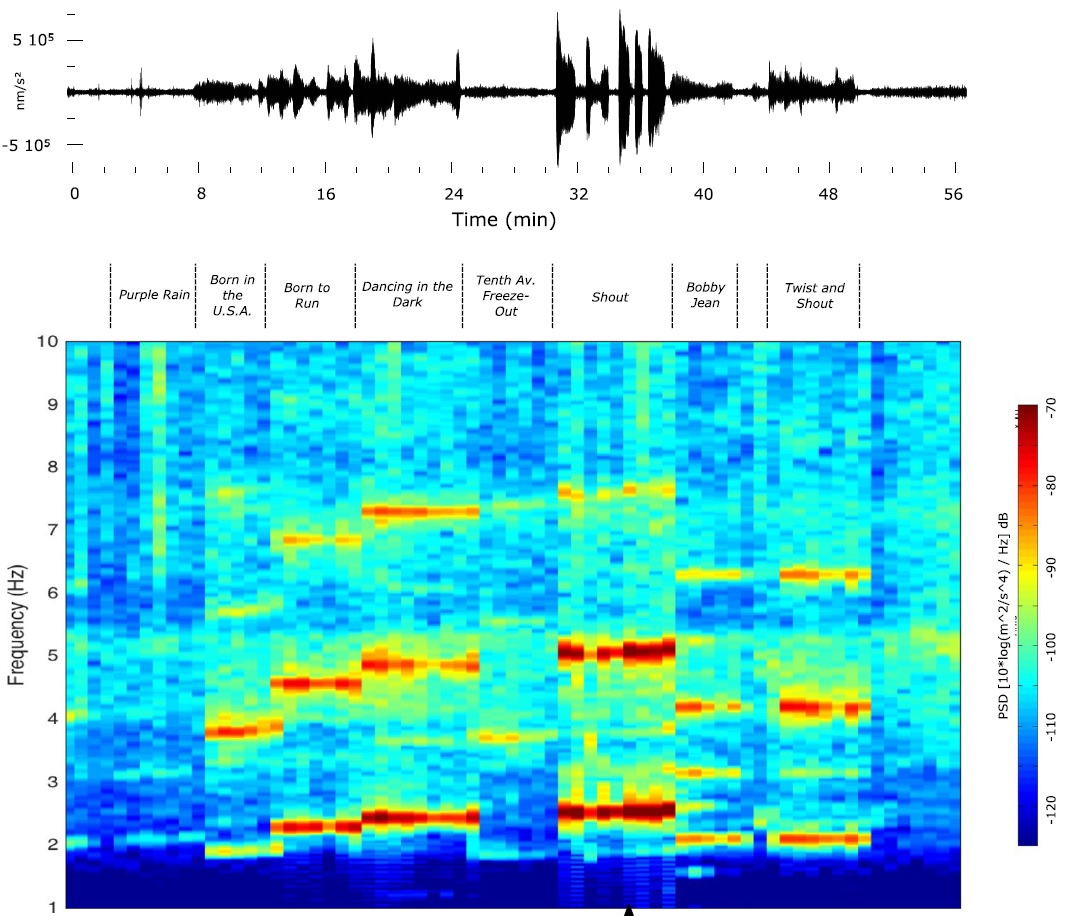
Seismic record captured by the seismometer during the Bruce Springsteen concert. The upper panel shows the seismogram, while the lower panel shows the spectrogram where it is possible to see the distribution of the energy between the different frequencies. (Image Credit: Jordi Díaz)
The colour on this diagram then corresponds to the amplitude of the shaking. “You can see that every single song has a particular pattern,” explains Díaz, “and you can even define from the seismic data when we are moving from one song to another.” The vertical stripes in Díaz’s spectrogram correspond to the different songs, whilst the horizontal, red stripes indicate the main frequencies that are present in each track. “In the goal celebrations… the energy is distributed all over,” says Díaz, “while here [at the concert] you can see what we call harmonic structures. You have energy localised at precise [frequencies]. This is because people are dancing, moving in a coordinated way.”
As Díaz explains in his paper, published last year in Scientific Reports, the harmonic structures are likely to be because of a phenomenon known as the Dirac comb effect. As the audience dance to a track with a specific beat, they create a series of equally-spaced pulses in time. This then transforms to a series of “evenly spaced harmonics in the frequency domain,” which is the series of horizontal stripes for each track. Furthermore, faster songs tend to produce higher frequencies.
Rock concerts in a football stadium might sound light-hearted, but Díaz’s work is not without important applications. The majority of the concert vibrations are in the range of 1.8 to 2.5 Hz. Meanwhile, building codes suggest that, structures should not be built with resonant frequencies higher than around 6 Hz. As Díaz and his team have demonstrated, the precise vibrations that the stadium experiences vary depending on the activity occurring. But some of the higher harmonics at the rock concert are close to the suggested building limit such that, if structures were to have resonant frequencies close to this limit, then there might be the potential for damage to the building. “Additional work, following a more engineering approach, is required to know if structure excitation has a significant contribution to the total shaking,” says Díaz.
The shaking in the city that Díaz and his colleagues have been observing is not only good fun, but also potentially of significant importance for civil engineers.
By Tim Middleton