Drought is inherently difficult to quantify due to its complex and multiscale nature. As a result, our ability to assess and monitor this phenomenon depends heavily on the availability of high-quality datasets.
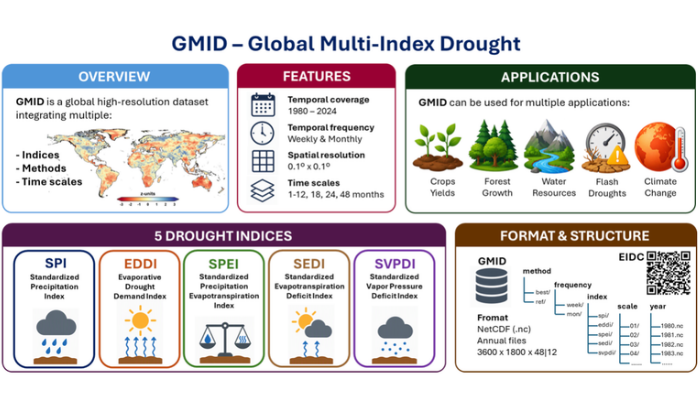
The Global Multi-Index Drought (GMID) dataset was developed to address key limitations of existing global drought products. Our goal was to create a comprehensive and high-resolution product capable of representing the many dimensions of drought across contrasting climatic and environmental conditions.
By integrating multiple drought indices, temporal scales, and methodological approaches within a single dataset, GMID offers a unique data resource for drought monitoring, impact assessment, and climate research while ensuring long-term accessibility and regular updates.
Multiple indices, time scales, and probability distributions in a single dataset
GMID provides access to five widely used drought indices:
- Standardized Precipitation Index (SPI)
- Standardized Precipitation Evapotranspiration Index (SPEI)
- Evaporative Demand Drought Index (EDDI)
- Standardized Evaporative Deficit Index (SEDI)
- Standardized Vapor Pressure Deficit Index (SVPDI).
Each indicator is available at time scales ranging from 1 to 12 months, as well as 18, 24, and 48 months.
By combining multiple drought indices across different time scales, GMID captures both the diverse hydrometeorological drivers involved in drought development and the varying roles these drivers play in shaping drought conditions (e.g., Figure 1), as well as the wide range of timescales over which droughts evolve, from rapid-onset events to prolonged episodes (e.g., Figure 2).
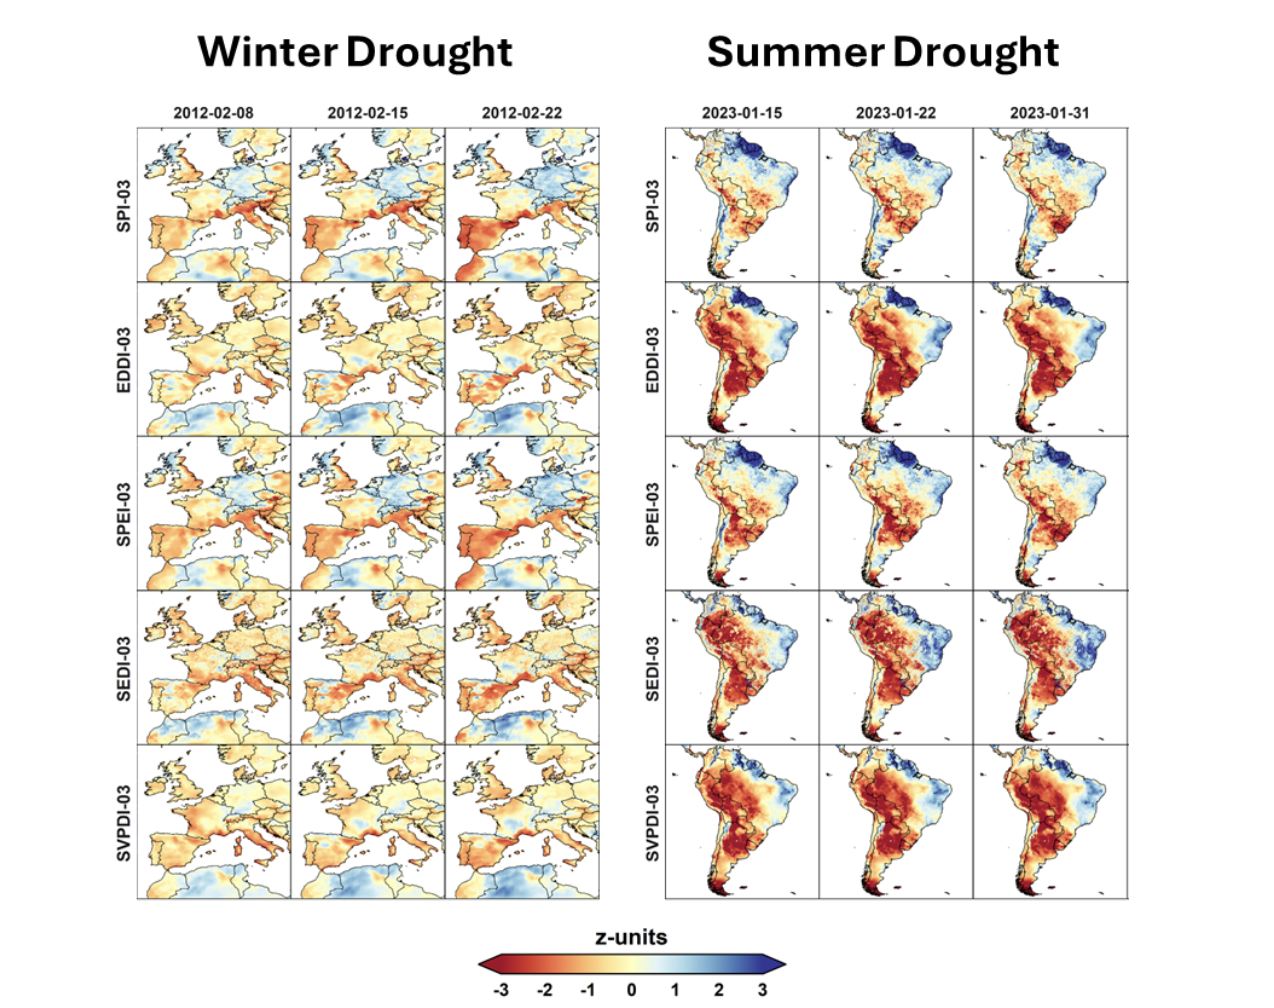
Figure 1. Left: The winter drought of 2012 affecting the Iberian Peninsula, which was primarily driven by a strong precipitation deficit. Right: The summer drought of 2023, affecting South America, which was mainly driven by a heat wave.
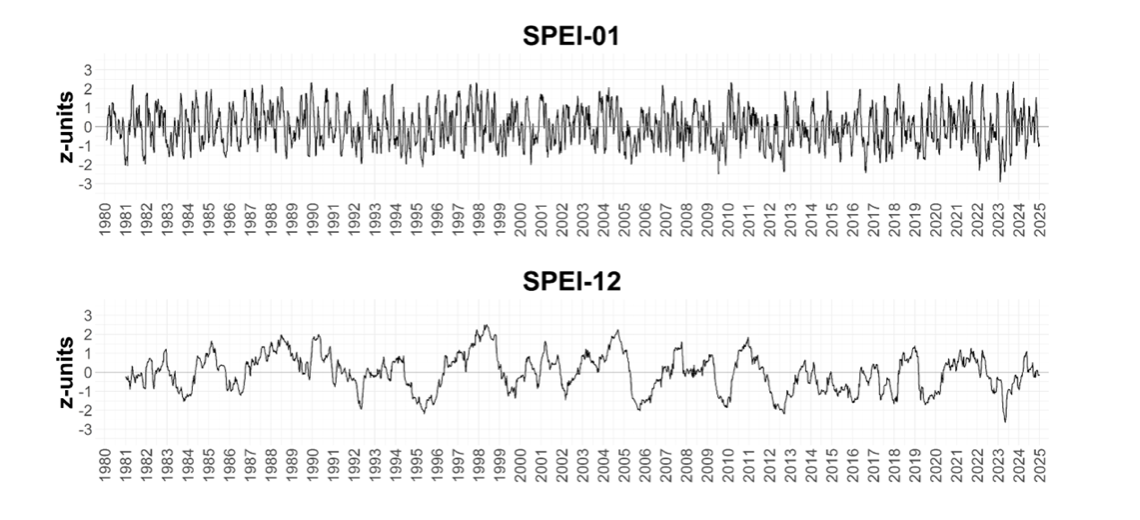
Figure 2. SPEI series in Madrid at short (1-month; top) and long (12-month; bottom) time scales for the period 1980-2024.
To develop the GMID dataset, several probability distribution options were tested for standardising drought indicators. The dataset provides two standardisation approaches: reference (based on commonly used methods in the literature) and best-fit (based on the best-fitting probability distribution), with documented recommendations to help users select the most appropriate option for their application.
Assessing drought (and flash droughts) at high spatial and temporal resolution
GMID provides data at a 0.1° spatial resolution and at both weekly and monthly time steps. The fine spatial resolution enables the identification of drought patterns and impacts at local and regional scales, while the high temporal resolution facilitates the analysis of drought propagation and evolution. This is particularly valuable for the study of flash droughts, whose rapid onset and intensification can be difficult to characterize using other drought datasets that are generally available at monthly time steps and at a coarser spatial resolution (Figure 3).
Together, these features provide a detailed view of drought dynamics across space and time, helping users better understand how drought conditions vary across regions and evolve over time. For applications that do not require high temporal resolution, monthly time steps are also provided in the GMID dataset.
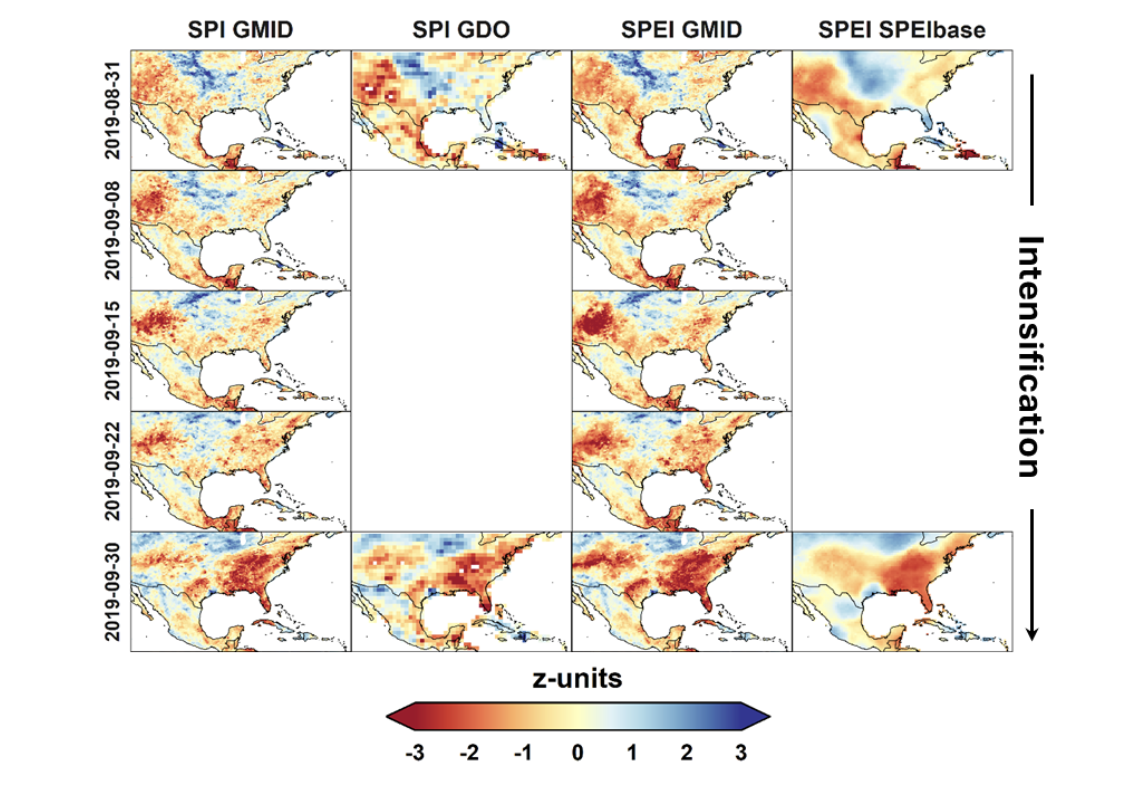
Figure 3. Comparison between weekly SPI and SPEI from GMID and the monthly SPI from the Global Drought Observatory (GDO; left) and the monthly SPEI from SPEIbase (right) during the 2019 flash drought affecting United States.
Accessing GMID: Availability and future updates
GMID is openly available to support drought assessment, management, and research across a wide range of applications for the period 1980-2024.
Users can access the dataset, documentation, and related resources through the Environmental Information Data Centre (EIDC).
To read more about the technical details about the GMID dataset and its validation please see the full paper, published in Nature.
As a long-term initiative, GMID will be updated annually as new data become available, ensuring that the dataset continues to expand and remains a valuable resource for studying drought variability, trends, and impacts.
Share your feedback
GMID is designed to evolve over time. Future developments, improvements, and new features will be guided by the needs, experiences, and feedback of the user community.
We welcome suggestions, comments, bug reports, and ideas that can help improve the dataset and enhance its usefulness across a wide range of applications. We also encourage users to get in touch if they are interested in exploring new applications or research activities involving GMID.
If you would like to share feedback, comments, or explore research opportunities involving GMID, please contact us at gmidrought@gmail.com.
Edited by Christina Oerischnig