I have just returned from nearly three months in Nuuk, the capital of Greenland, where I was doing my PhD placement at Asiaq Greenland Survey. Read on to find out what science I got up to… everything from mapping mountain glacier snowline change to avalanches!
How do you map glacier snowline evolution?
During my PhD research placement, I was working at Asiaq Greenland Survey in their Hydrology, Climate and Environment team on a variety of projects. Asiaq provides knowledge on climate, hydrology, soil conditions, surveying and mapping terrestrial Greenland. They are partners of the research monitoring programmes PROMICE (Programme for Monitoring of the Greenland Ice Sheet) and GEM (Greenland Ecosystem Monitoring).
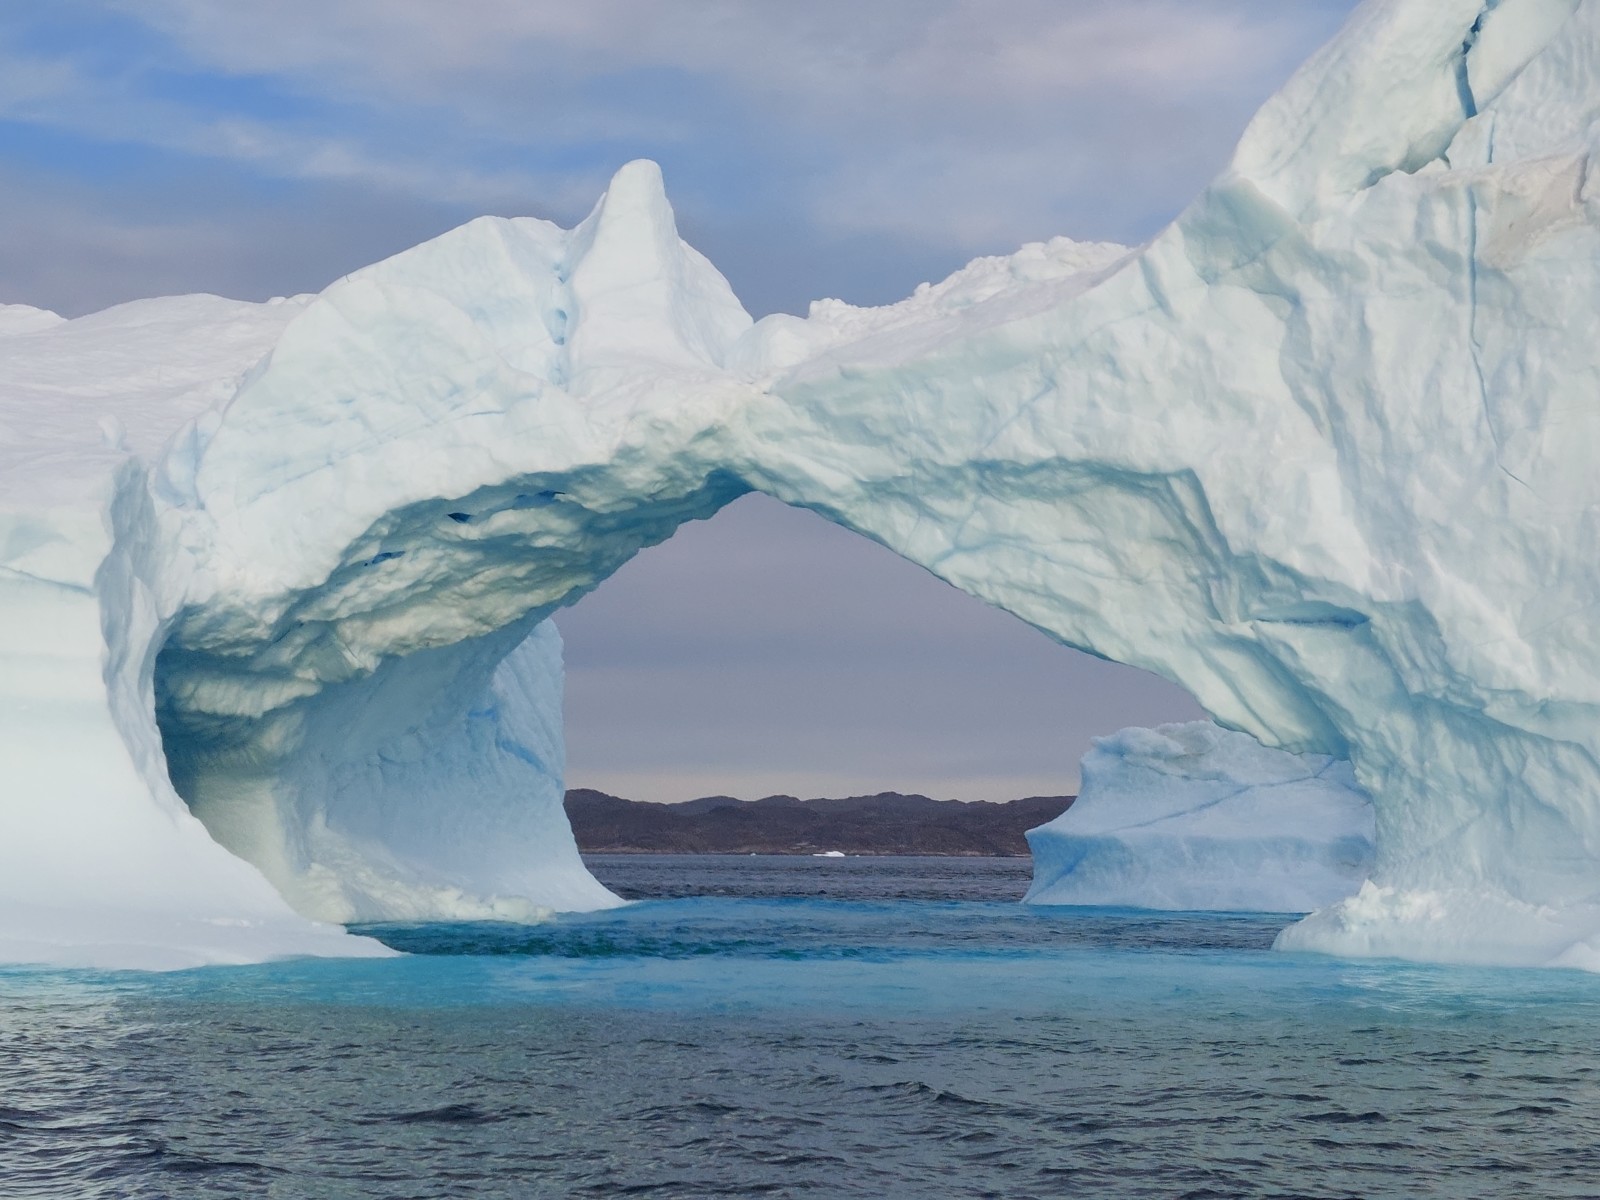
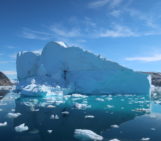
Iceberg in Nuuk fjord [credit: Jenny Arthur]
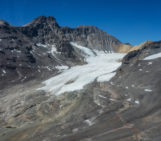
In order to track snowline evolution on this glacier and our knowledge of the snow and firn conditions, I used images from a time-lapse camera installed next to the glacier and satellite observations. The snowline is the boundary between the fresh snow and bare glacier ice. Its altitude at the end of the melt season represents the Equilibrium Line Altitude of a glacier, a parameter strongly related to the mass balance (the net difference between ice gain through snowfall, and ice loss through melting) of the glacier itself. You can imagine that the lower the snowline at the end of the melting season, the healthier the glacier, as it will have accumulated snow on a larger surface portion. To map snowlines from the camera images, I used automated methods developed by Dr Penny How.
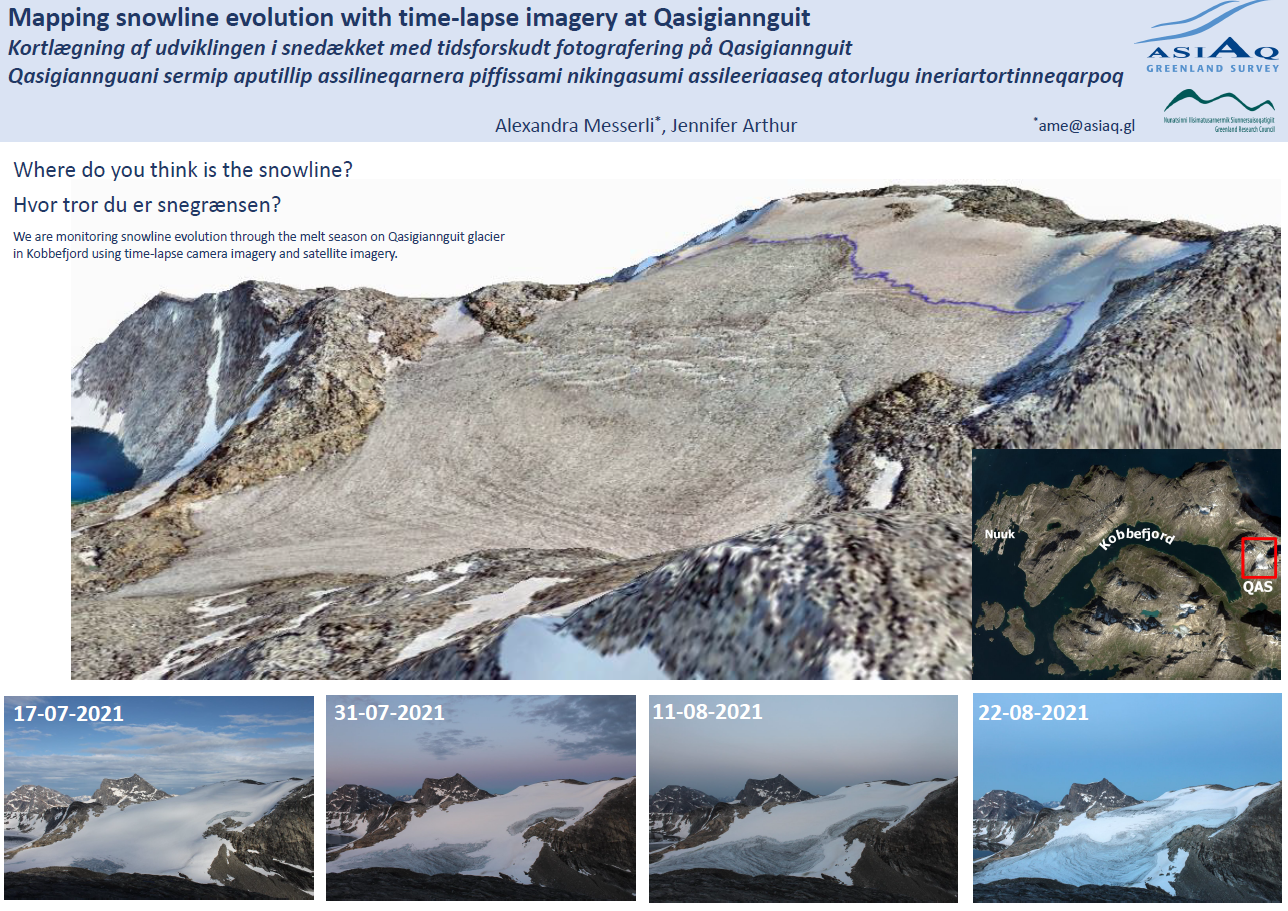
One of our public outreach posters used at Greenland Science Week showing how we are using time-lapse camera images to map changes in the snowline position on Qasigiannguit Glacier in Kobbefjord. [credit: Jenny Arthur]
Boat commuting into the fjord!
We made plenty of fieldwork trips into the fjord that neighbours Nuuk, called Kobbefjord. A boat into the fjord in the morning made for a nice commute! Our main work involved preparations for the end of the field season, and servicing and downloading data from the meteorological stations that form part of the Geobasis sub-programme of GEM. The monitoring data helps to describe the state of Greenlandic terrestrial environments and their potential feedback effects in a changing climate. Maybe a slightly more unusual fieldwork task, this also included making instruments Arctic-fox proof (to stop them chewing through cables!).
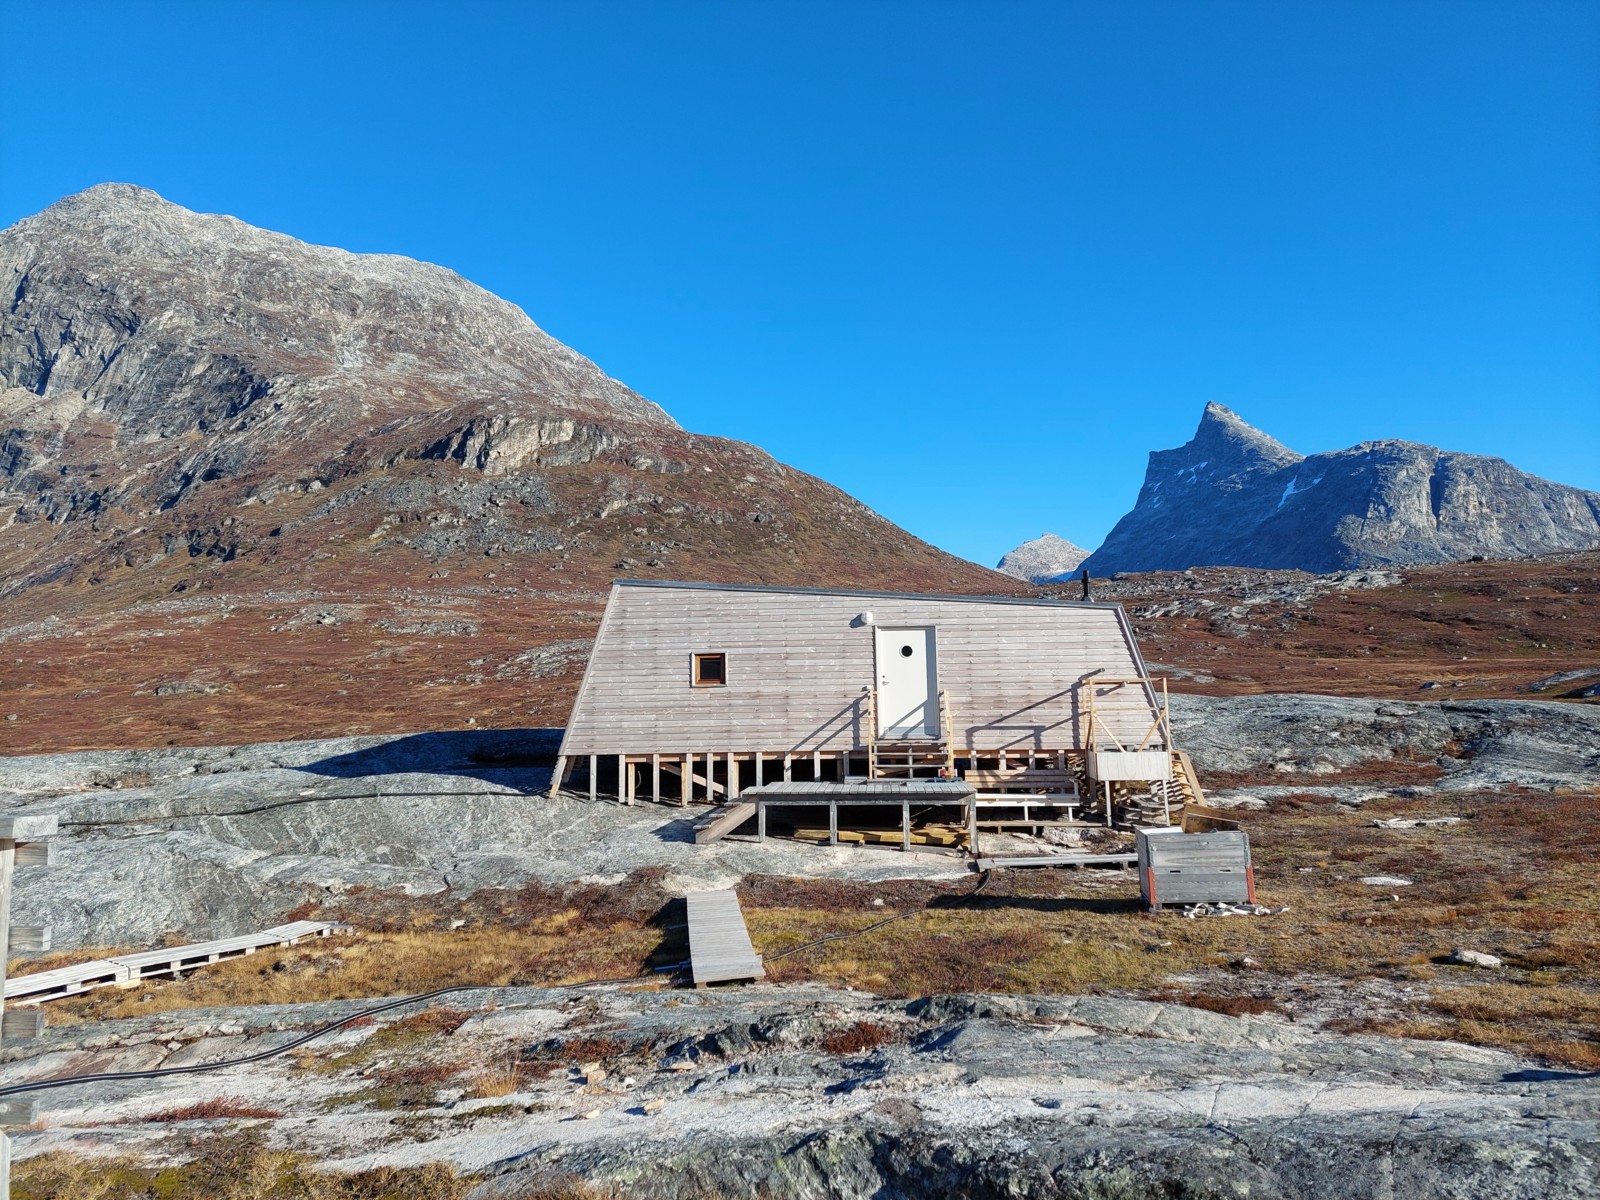
Kobbefjord research station, ~25 km from Nuuk. [credit: Jenny Arthur]
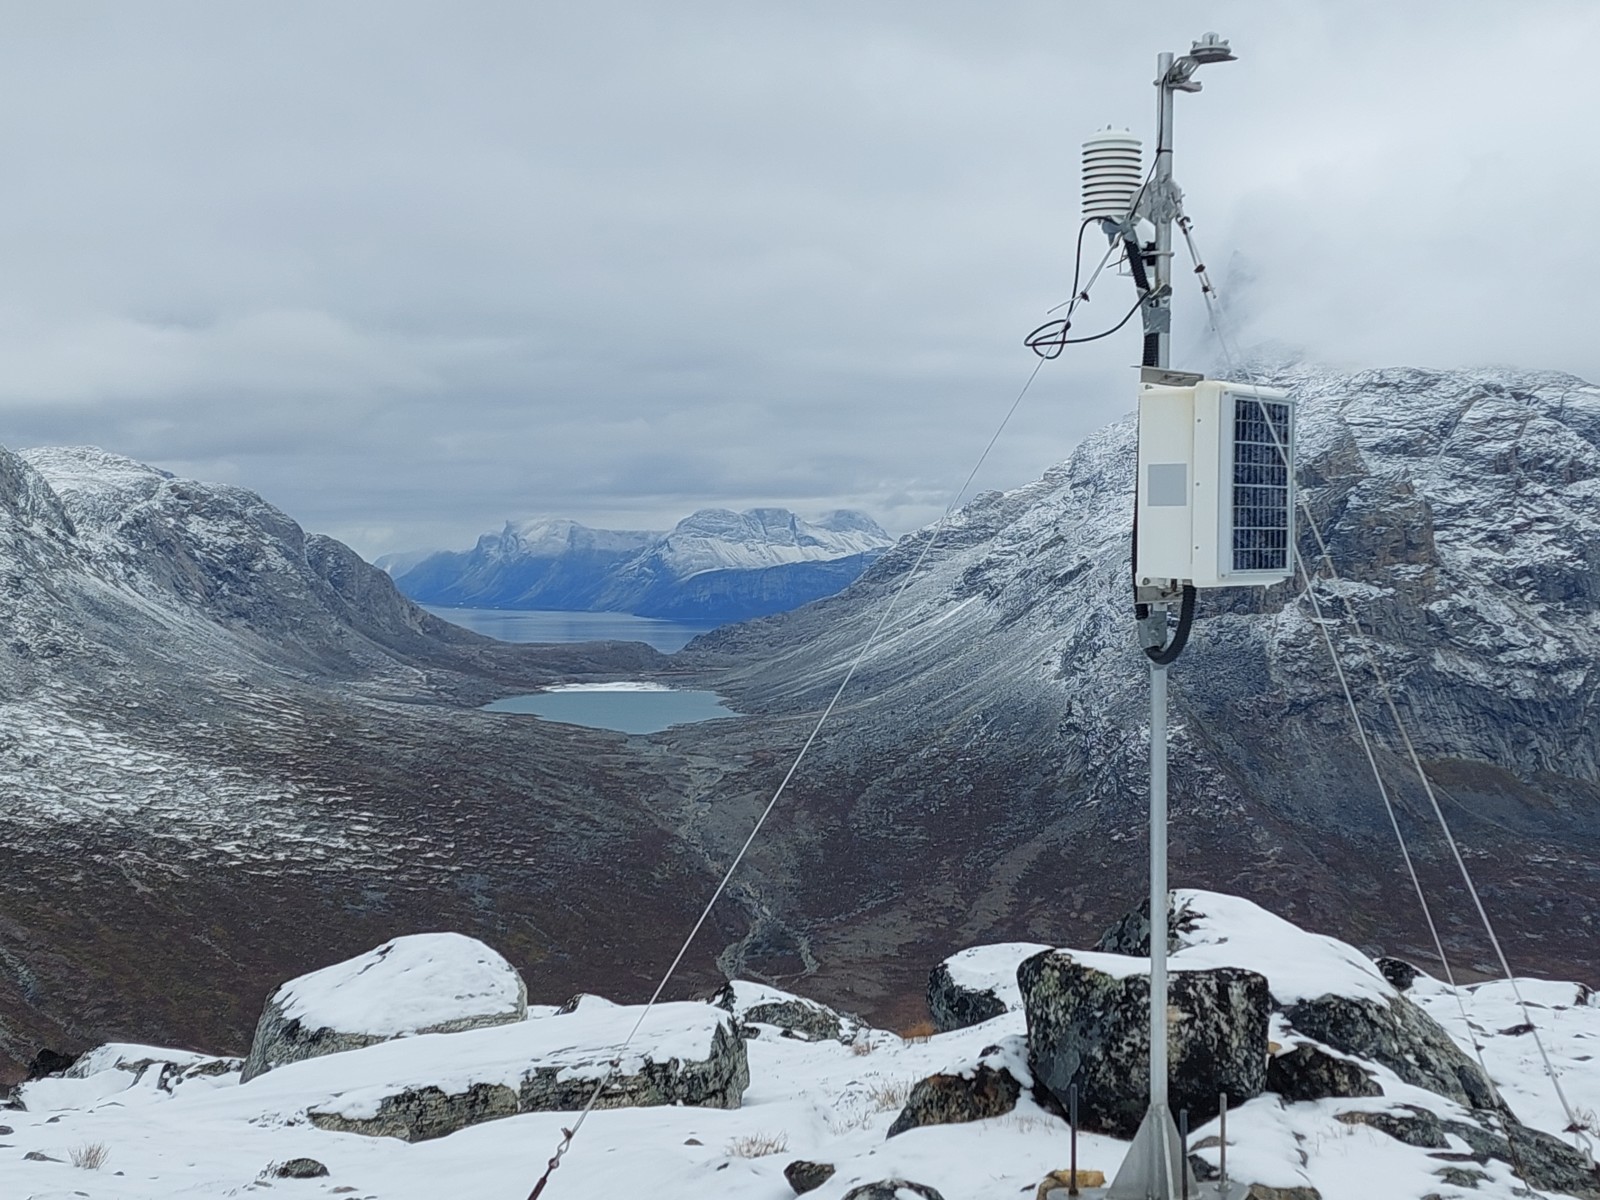
Servicing one of the meteorological stations in Kobbefjord. It was pretty freezing at the top trying to undo tiny screws and remove batteries with semi-functioning hands! [credit: Jenny Arthur]
Communicating Arctic science
I took part in a 2-day science communication workshop run by the Arctic Hub, which connects people, institutions, and countries within Greenlandic research. They also offer training on communicating research to different audiences and platforms. Activities ranged from writing and pitching press releases about our research to journalists from the Greenlandic and Danish media outlets, including their valuable feedback, to a discussion around how we can bridge the gap between science, research and the media and Greenland society.

Arctic Hub science communication workshop for researchers and journalists. [credit: Emil Nørgaard Stach]
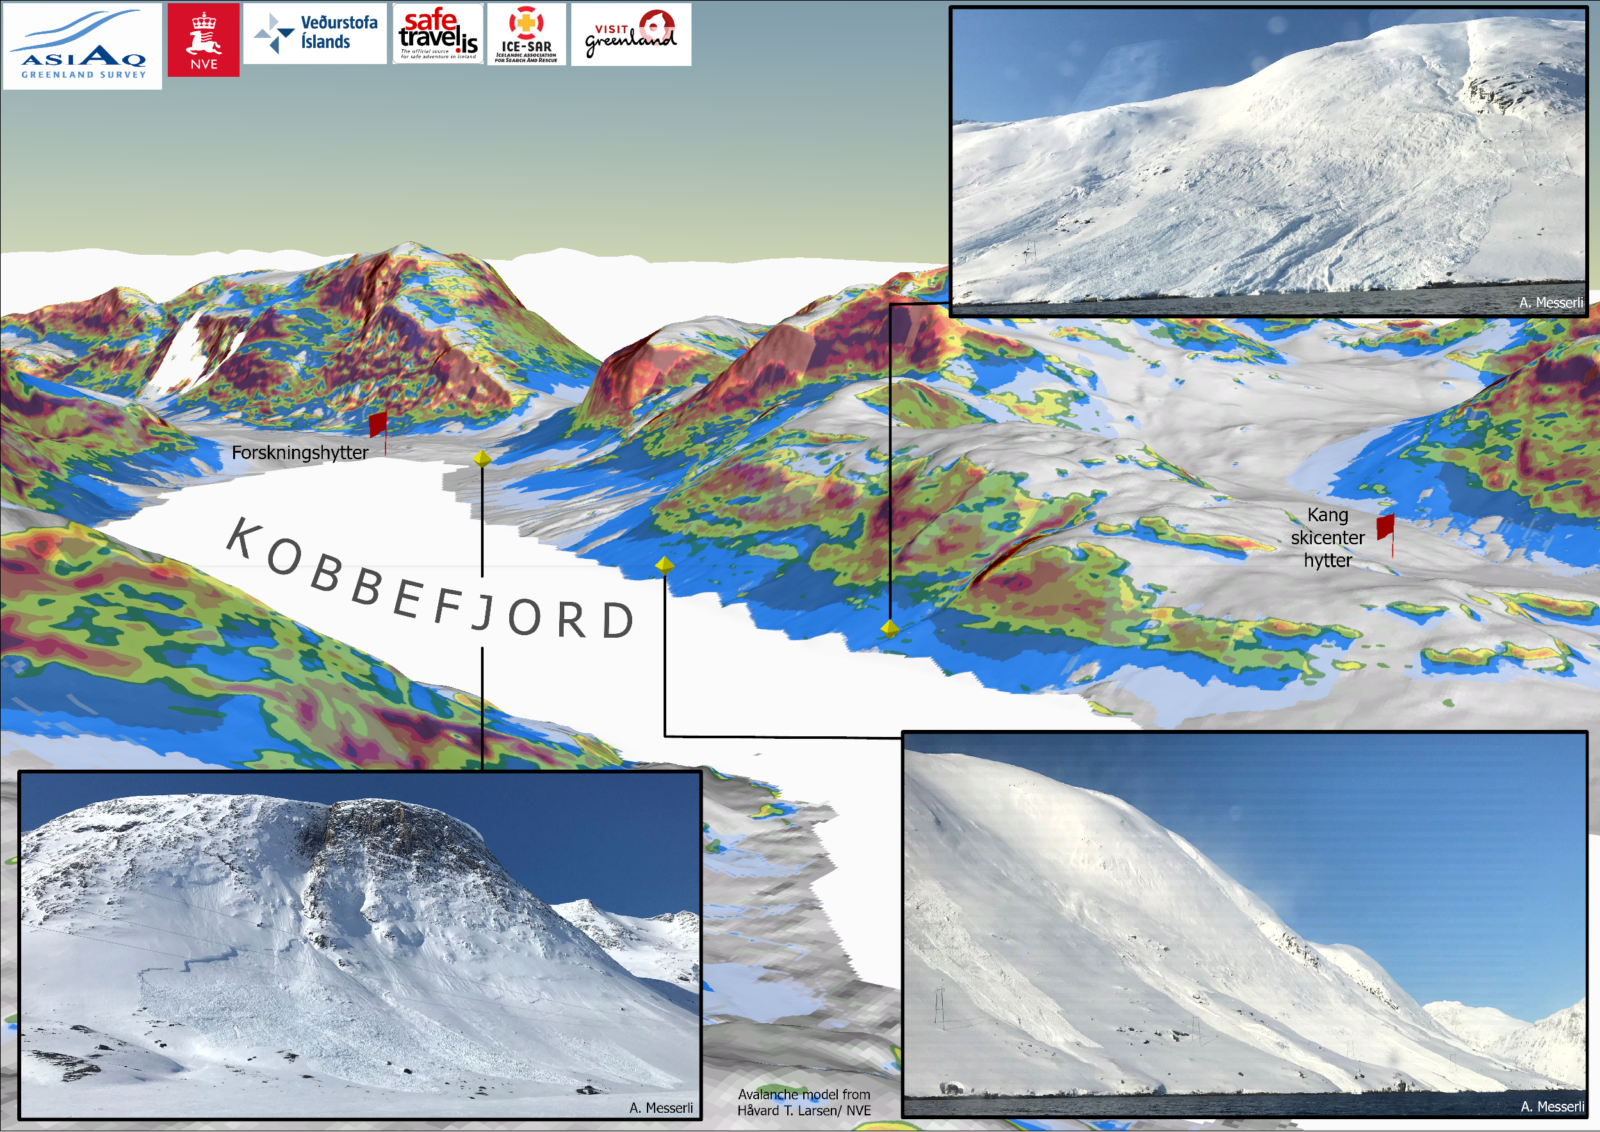
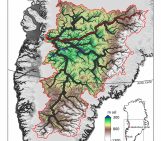
One of our public outreach posters used at Greenland Science Week showing preliminary demonstration avalanche risk mapping around Kobbefjord, near Nuuk. [credit: Jenny Arthur. Avalanche model: Håvard T. Larsen, NVE.]
I learnt a huge amount during my stay at Asiaq Greenland Survey and it was great to switch my focus from my own PhD research in Antarctica to Greenland! I can highly recommend doing a research placement and this has probably been the highlight of my PhD. If you have any questions or would like to know more, please get in touch!
Further reading
- If you would like to find out more about what I got up to during my stay in Nuuk, check out my blog.
- Learn more about Asiaq Greenland Survey on their website.
- PyTrx (short for ‘Python Tracking’) has a great Python terrestrial photogrammetry toolbox for glaciology, if you want to learn more about this method.
Edited by Giovanni Baccolo & Maria Scheel
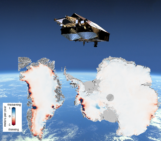
 Jenny Arthur (she/her) is a PhD Student at Durham University, UK, specialising in Antarctic surface hydrology and ice shelf dynamics. She is interested in the distribution and seasonal evolution of supraglacial lakes and the potential influence of surface meltwater on outlet glacier and ice shelf stability. Her PhD research uses satellite remote sensing to investigate this on the East Antarctic Ice Sheet. She tweets as @AntarcticJenny and is part of the @EGU_CR blog team and @UKPolarNetwork. Contact Email: jennifer.arthur@durham.ac.uk