Does measuring the surface of the ice sheets provide more than superficial knowledge of their current status? Read further to find out why the answer is definitely yes! Measuring surface elevation changes actually tells us where Greenland and Antarctica are thinning or thickening and how much they contribute to sea level rise. Scientists have been doing this for the past three decades, so keep on reading to find out exactly how this is possible thanks to radar altimeters flying hundreds of kilometers above us.
Altimetry – what’s that?
Working with satellite altimetry can be a bit intimidating at first, but the principle behind it is actually really simple! Altimetry is about measuring distances between two objects (most often the altitude of an object with reference to the ground or sea level). Even if you haven’t heard of altimetry before, you’ve probably been relying on altimeters to some extent at some point in your life. Ever travelled on an airplane? Then altimeters were the instruments used to navigate and measure the altitude of the aircraft! This type of altimeter measures the atmospheric pressure to deduce the altitude of the aircraft, as atmospheric pressure decreases with altitude.
But what are altimeters used for in the cryosphere? Well, instead of atmospheric pressure, radar altimeters measure the travel time of a radio wave they sent but the principle is the same: they measure the distance between the sensor and the surface. Altimetry has a very wide range of applications for climate science, as it can be used to map the surface elevation of the ice sheets (the focus of this post) and ice caps but also sea ice thickness, sea level variations or water levels from rivers and lakes.
So, how can we measure ice elevation changes from space?
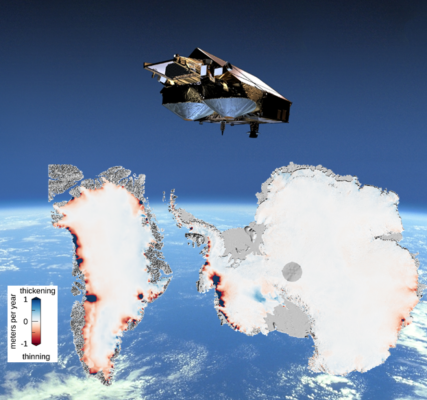
Well, radar altimeters orbiting the Earth send an electromagnetic pulse towards the ice surface and record the time taken for this pulse to reach the ice sheet’s surface and come back to the sensor. This gives us a ‘waveform’, which is the power received by the altimeter through time and which contains lots of useful information. From these waveforms, we can measure the surface very precisely. By doing this every time the satellite passes over the ice sheets, we can measure ice sheet elevation changes over time. For instance, it is thanks to altimetry that we now know Thwaites and Pine Island Glaciers in West Antarctica are thinning very rapidly, losing more than one metre of ice per year in places!
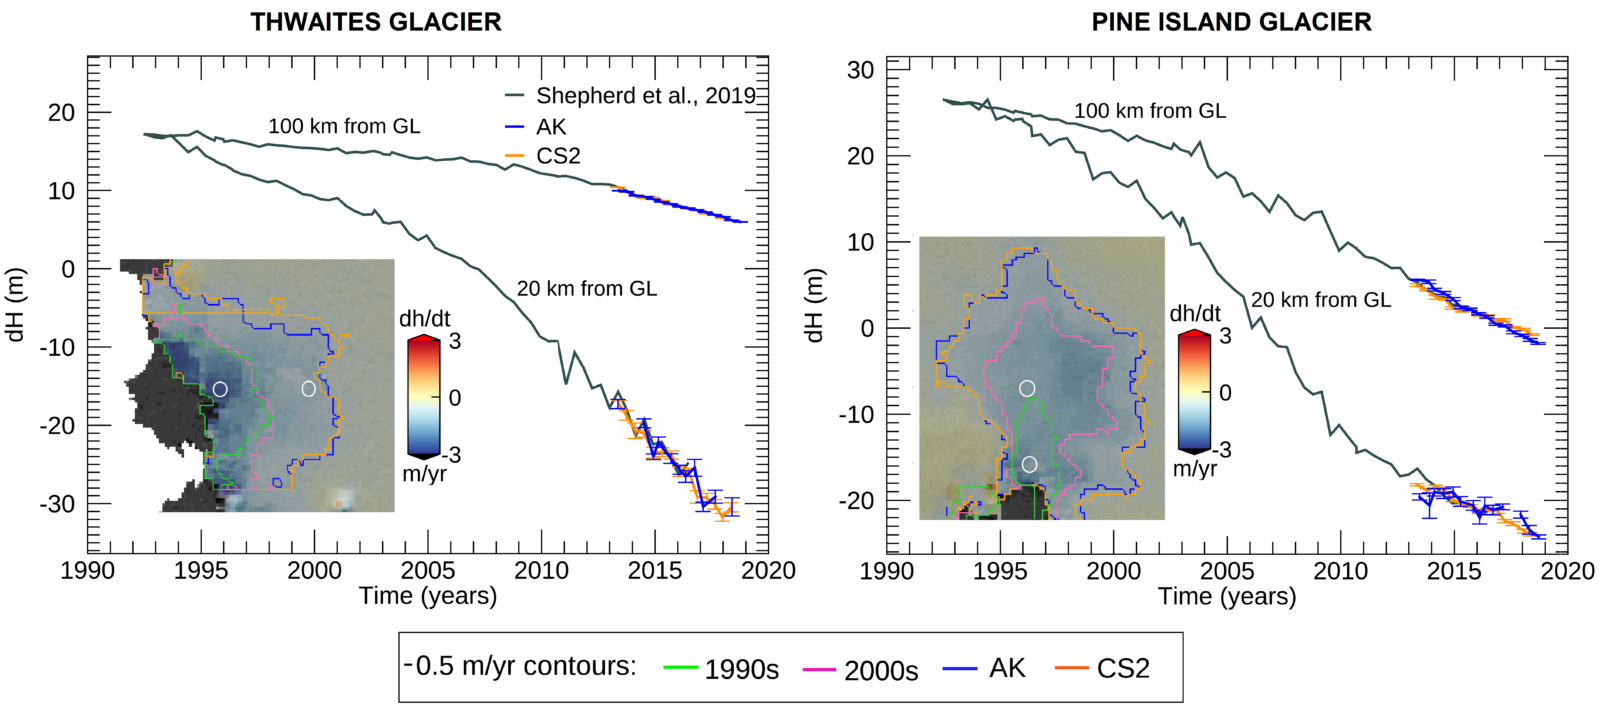
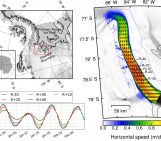
Time-series of elevation change of Thwaites (left) and Pine Island (right) Glaciers from the full radar altimetry record and extended in time with CryoSat-2 and AltiKa radar altimetry data at two locations (at 20 km and 100 km from the grounding line (GL)) shown by the white circles. The inset maps are maps of rates of elevation change of these two glaciers. The coloured contours on the maps represent the 0.5 m/yr contour of thinning rate from the 1990s, 2000s, and from the 2010s from CryoSat-2 and AltiKa, showing how thinning has spread further inland over time. Credit: Inès Otosaka.
Radar altimetry has been used to measure changes in Greenland and Antarctica’s topography since the 1990s, building on the success achieved in ocean satellite altimetry in the 1970s and 1980s. Starting with the launch of ERS-1 in 1992 from which the first map of Antarctica elevation changes was produced and eventually published in 1998 (Wingham et al., 1998), more radar altimeters have been launched in space and we now have a record of ice sheet elevation spanning more than three decades. In particular, CryoSat-2, launched in 2010 by the European Space Agency, has led to the development of new capabilities as it covers the Polar Regions up to latitudes of 88° and provides higher resolution data in the margins of the ice sheets, where the biggest changes are occurring.
So, what do we still need to find out?
Satellite altimetry is a well-established method and has been successfully used to map elevation changes across both Greenland and Antarctica and estimate their contributions to sea-level rise. But there is always still lots of interesting science to do!
One of our current challenges is trying to better understand how radar waves interact with the ice-sheet surface and subsurface. The radio waves sent by radar altimeters can penetrate into the snowpack, but we still don’t really understand how this varies over time and space. Indeed the properties of the snowpack, such as its density, can change very rapidly, for instance after a snowfall or surface melt event.
How do we get around this problem? This is where satellite laser altimetry comes to the rescue! Lasers reflect off the top of snow and don’t penetrate into the snowpack. So, by using radar and laser measurements of ice surface heights taken at the same time, we can try to link differences between these two datasets to the physical properties of the snowpack. To help with collecting coincident measurements from radar and laser instruments, the orbit of CryoSat-2 was recently aligned in space and time with NASA’s ICESat-2 laser altimeter more frequently as part of the CRYO2ICE campaign. This gives us the chance to carry out some field experiments to make use of this unique opportunity! We recently did some fieldwork on Adelaide Island in Antarctica as part of a joint ESA CryoVEx/DEFIANT campaign. During this two-week campaign, we collected some in-situ measurements of firn and snow density, stratigraphy, and airborne laser and radar measurements. These measurements will hopefully help us learn more about spatial variations in radar penetration and improve further our retrievals of surface heights from radar altimeters.
At the time of climate change, polar ice caps are rapidly changing; keeping an eye on them and understanding these transformations is critical to predicting future sea level changes. Radar altimetry is simply one of the best tools we have to do this!

Picture of the recent ESA CryoVEx/DEFIANT campaign on Fuchs Piedmont, Adelaide Island, setting up a corner reflector to help us calibrate and validate radar and laser airborne altimetry measurements, December 2022. Credit: Ian Potter.
Further reading
- Otosaka et al. (2019) “A study combining airborne radar and laser measurements with in-situ measurements of firn densities in Greenland showing that surface melting has a strong impact on radar altimetry measurements” Geophysical Research Letters 46:13135-13143.
- Sandberg Sørensen et al. (2018) “25 years of elevation changes of the Greenland Ice Sheet from ERS, Envisat, and CryoSat-2 radar altimetry” Earth and Planetary Science Letters 495:234-241.
- Shepherd et al. (2019) “Trends in Antarctic Ice Sheet Elevation and Mass” Geophysical Research Letters 46:8174-8183.
- Smith et al. (2020) “Pervasive ice sheet mass loss reflects competing ocean and atmosphere processes” Science 368:1239-1242.
- Wingham et al. (1998) “Antarctic Elevation Change from 1992 to 1996” Science 282:456-458.
Edited by Jenny Arthur and Giovanni Baccolo
 Inès Otosaka is a Research Fellow at the NERC Centre for Polar Observation and Modelling (@CPOM_news) at the University of Leeds. She uses satellite and airborne altimetry data over the Greenland and Antarctic Ice Sheets to track and interpret changes in their elevation, volume and mass. She is also the project scientist of the Ice Sheet Mass Balance Inter-Comparison Exercise (IMBIE), which aims at reconciling satellite measurements of ice sheet mass balance through community efforts in order to reduce uncertainties in ice sheet mass balance estimation and help constrain ice-sheet sea-level projections. Contact Email: i.n.otosaka@leeds.ac.uk