One of the first things school children learn is that ice is a solid, and forms by freezing water. Most people think of ice as brittle–have you ever dropped a slippery ice cube on the kitchen floor, and watch it break and shatter into many pieces? It may be surprising, then, to find that ice can also stretch and squeeze, like a ball of pizza dough! Once deformed, ice is then softer in certain directions than others. When we think about this on a large scale–that being glaciers and ice sheets–this deformation affects the way these glaciers flow from mountain to sea. We call this deformed ice an ‘ice fabric’. Unfortunately, ice fabric is not in any way related to blanketing glaciers with curtains, but it is a critical part of understanding how glaciers are affected by climate change.
What is ice fabric?
To understand what we mean by an ‘ice fabric’ we first need to understand how glacial ice forms. Glacial ice is formed by the continual compaction of snow under the weight of new snow that falls on top of it. Each snowflake is transformed into an individual ice crystal by this compaction process and each ice crystal is laid down in a random orientation. Gradually over time, this ice builds up enough mass and begins to move and flow. As it flows, the ice is subject to different forces (e.g. squeezing of ice as it flows between mountains or the friction of ice against its bed). These forces (stress) cause the ice crystals to deform (strain), and the individual crystals accommodate this deformation by rotating and/or merging with neighboring crystals. When the ice crystals rotate, they tend towards a particular orientation with respect to the stress that is being applied to them, due to their particular molecular structure (more on this later). This process occurs across each of the tiny ice crystals that comprise a glacier, which results in the many randomly oriented crystals being rotated into the same alignment, this overall preferential alignment forms what is known as the crystal orientation fabric, often simply referred to as ‘ice fabric’.
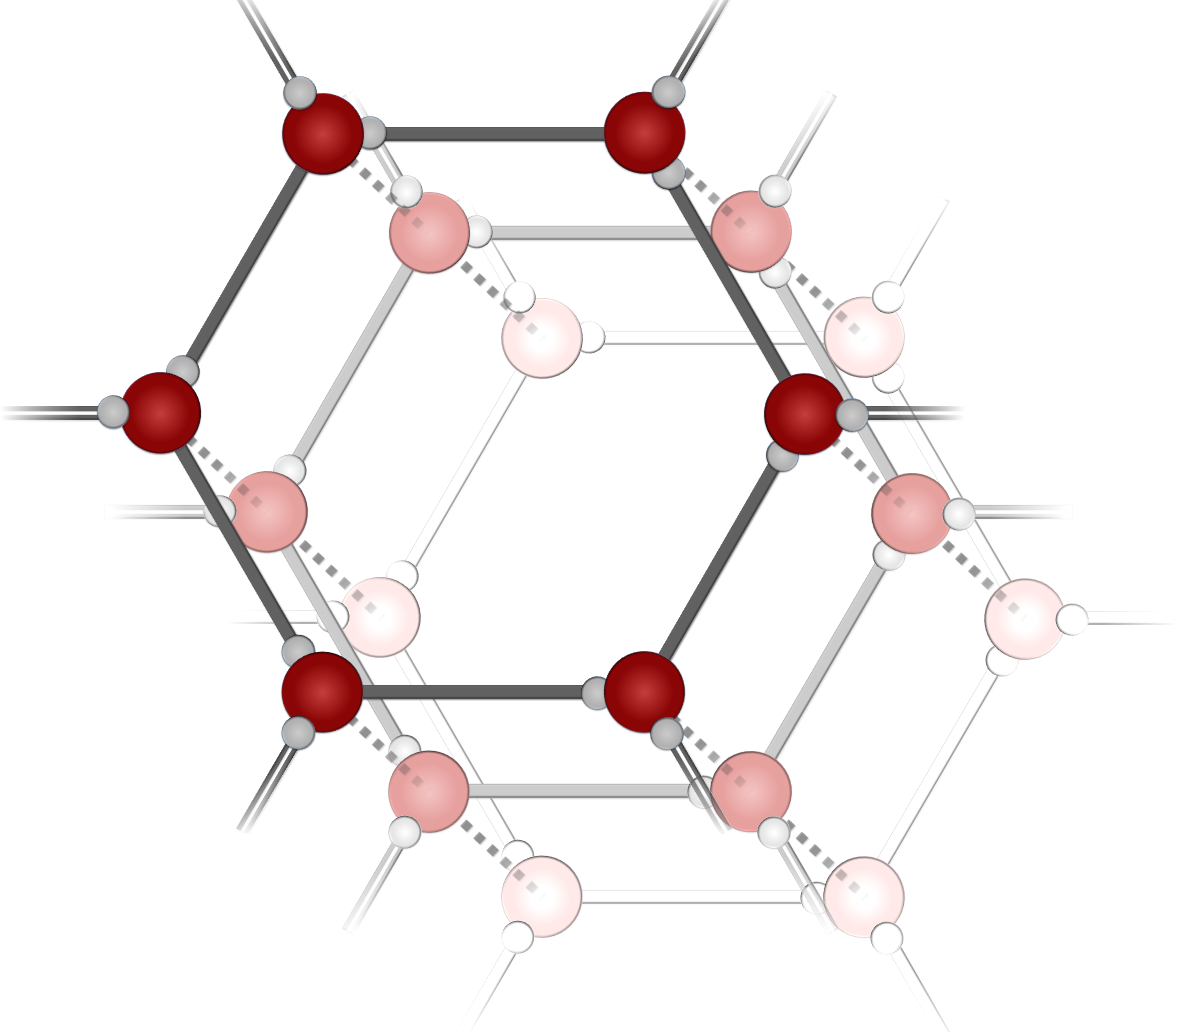
Figure 1. Do you remember your high school chemistry? Each water molecule consists of 1 oxygen atom (red spheres) and two hydrogen atoms (grey spheres), and each ice crystal is formed of six water molecules arranged in a hexagonal ring structure (we call a lattice). These hexagonal rings are tessellated across its layer. The bonds with other crystals in the same layer (solid lines) are much stronger than bonds between adjacent layers (dotted lines). So, it is much easier to deform the ice (break bonds) between the layers than within the layers. [Image credit: TJ Young (SPRI University of Cambridge)]
Why do ice crystals “prefer” a particular orientation?
Ice crystals are–you guessed it–formed of water molecules, which are arranged in layers of hexagonal rings (Fig. 1). We call the plane of the layering the “basal plane” of the crystals. The bonds between molecules are much stronger between the crystals in the same layer than the bonds between molecules located in adjacent layers. Because of this, you can think of the layers analogous to a deck of cards, with each card being a layer of strongly bonded crystals. If the deck of cards are pushed from the side, they will easily slide (deform) over each other. However, if the deck of cards are pushed from the top, down into its resting surface, they will not budge. Similarly, if a block of ice is subject to a force applied along the same direction as the layers of crystals (i.e. from the side), they deform easily, as the basal planes slide (shear) over each other. Whereas, if the same force is applied at right angles to the basal plane, it will be much harder to deform the block of ice. In fact, it is nearly 100x harder to deform ice crystals in the perpendicular direction (across the basal planes), than the parallel direction (along the basal planes)! Therefore, ice is ‘softer’ in certain directions. All of this goes to show that, when a force is applied to a block of ice, the crystals “prefer” to slide along their basal planes and this causes the layers of crystals to rotate (Fig. 2) towards the force that is being applied.
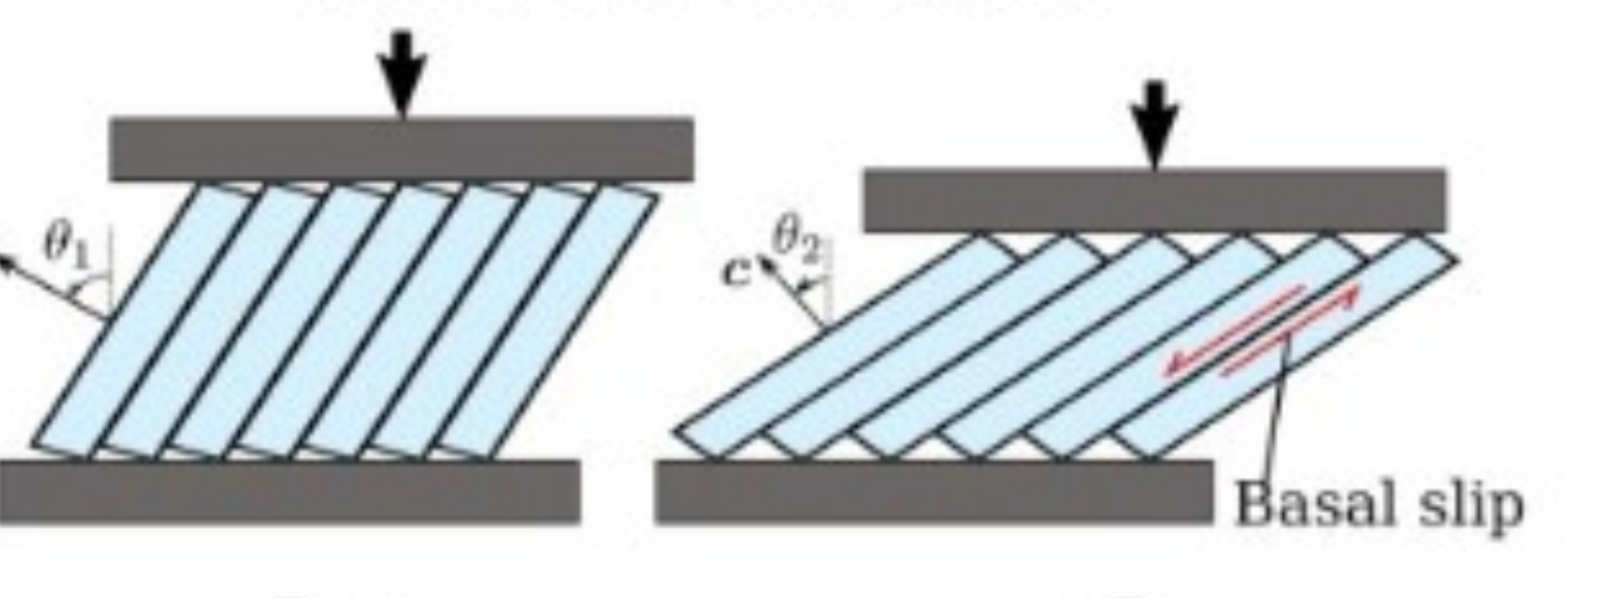
Figure 2. Ice is often described to deform similar to a deck of cards. Here each blue block is a layer of ice crystals. Because ice deforms more easily along the layer (known as the basal plane), than at right angles to that layering, the crystals rotate when a force is applied. [Image credit: adapted from Richards et al., (2021)]
What does this mean for glaciers?
Continental ice is, for the most part, anisotropic: that the ice crystals that comprise glaciers and ice sheets are preferentially rather than randomly oriented (termed ‘isotropy’). This phenomenon is not restricted to ice–many other materials, both natural (wood, rock) and man-made (graphene, metals, and alloys), also display anisotropy in their crystal properties. In all materials, however, anisotropy is important in determining the directions that make it stronger, or less likely to deform and/or fail. For example, when chopping and splitting wood, we are taught to chop along the grain. Many of us have learned this the hard way by wasting unnecessary effort in chopping across (against) the grain! Similarly in man-made anisotropic metal alloys, the measurable strength and stiffness of products are in line with the direction of its grain structure. An anisotropic product, such as a carbon fibre road bike or the wings of an aeroplane, are stronger in certain directions than others. Because these products do not require strength in every conceivable direction, anisotropic materials are preferable, as they are often also lighter in weight.
The same analogies apply to polar ice: if its crystals are anisotropically oriented, then ice is stronger (or harder) in certain directions and weaker (or softer) in other directions. In general, the individual ice crystals tend to rotate towards the direction of compression and away from the direction of extension (Fig. 2). So, for example, let’s go back to our ball of pizza dough: if you were to stretch some dough out in a long line, the individual ‘crystals’ that make up that ball of dough would rotate and be aligned perpendicular to the direction that it was pulled in. The same processes happen within a glacier that is flowing downhill. Here, the ice is stretched as it is pulled downhill by gravity, and the ice crystals rotate and orient perpendicular to the direction of flow. This relationship between ice crystal orientation and ice flow then suggests that ice fabric can act as a historical record of the forces that have been applied to that ice. This is an important discovery, as we can then use these observations of ice fabric to infer past ice flow conditions and constrain the timings of previous ice sheet advances and retreats.
How can we observe and measure ice fabric?
Traditionally, ice fabric is directly measured by analysing thin sections of ice cores. To do this, very thin samples of ice are cut from an ice core and placed on a microscope, and observed using polarised light. The resulting image is a beautiful kaleidoscope where the colours of each crystal indicate its orientation (Fig. 3).
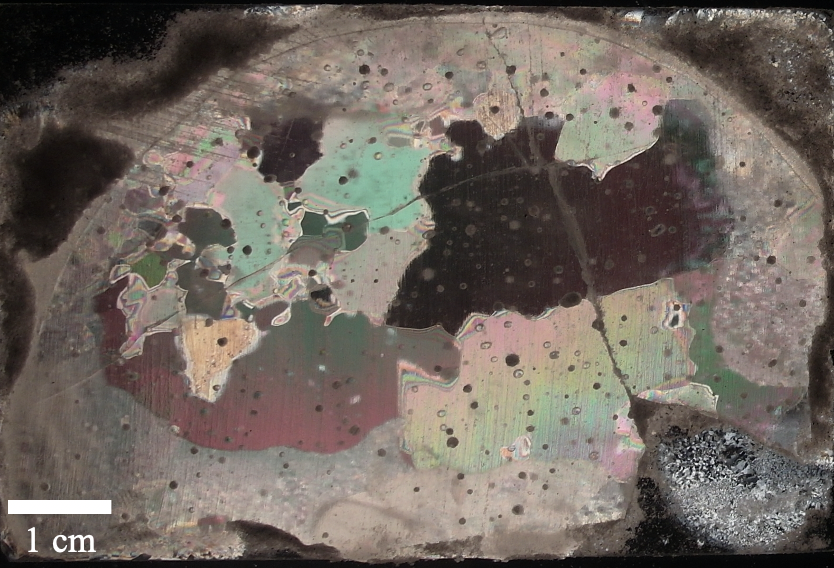
Figure 3. The traditional method of measuring ice fabric is to shine polarised light on to thin slices of ice core samples. The colours are indicative of the orientations of ice crystals. [Image credit: Renée Clavette (University of Maine)]
Other in-situ techniques that can directly infer ice fabric make use of the borehole drilled from coring operations. These techniques include sonic logging, where a probe, which generates sound (seismic) waves, is lowered down the empty borehole and the speed of the sound waves in different parts of the ice are measured. The anisotropy of the ice crystals affect the speed of sound within ice, which enables this technique to infer the types of fabric present. Another technique is optical dust logging, where a probe is used to observe the relative amounts of light absorbed and reflected at the borehole wall. Again, the observations enable determination of the different types of ice fabric at different depths beneath the surface.
However, a crucial factor that limits the feasibility of the above techniques arises from the complex logistics associated with ice core drilling. An ice core project is often budgeted to be in the order of hundreds of millions of Euros, requires the development of specialist coring equipment, and involves multiple years of planning even prior to arriving at the study site.
Good news! There are other ways of measuring ice fabric!
Recently, there has been a push towards using non-invasive techniques that can be used to infer ice fabric from the surface of the ice. Recent radar analyses using polarimetric techniques (similar to the way your favourite pair of sunglasses filter light) have shown that radar is able to detect fabric properties within the ice at vertical resolutions of up to 15 metres, which is comparable to those reported from ice core studies (Fig. 4). On the other hand, seismic studies using both active and passive sources are able to image the averaged ice fabric over the entire ice column (Fig. 5). Because radar studies often are unable to observe the deepest sections of ice due to weaker received signals at increasing distances (similar to why you want to be near your wireless router when streaming your favourite TV show), observations from seismics, while at a much coarser vertical resolution, can complement the limitations of those observed using radar.
More importantly, however, the ability of mobile platforms such as radar and seismics to quickly and efficiently measure ice fabric allows for the possibility to ‘map’ fabric across entire glaciers and ice sheets. Because the locations where ice cores have been drilled are often situated in areas with minimal flow, the fabrics that are observed from these cores are unlikely to represent more dynamic areas of glaciers and ice sheets. The use of such mobile platforms can therefore overcome this limitation. Recent studies have revealed fabrics at shear margins and in ice streams to be much more complex than what is usually found in ice cores! Additionally, a complex fabric usually means a complex history. Why? Read on!
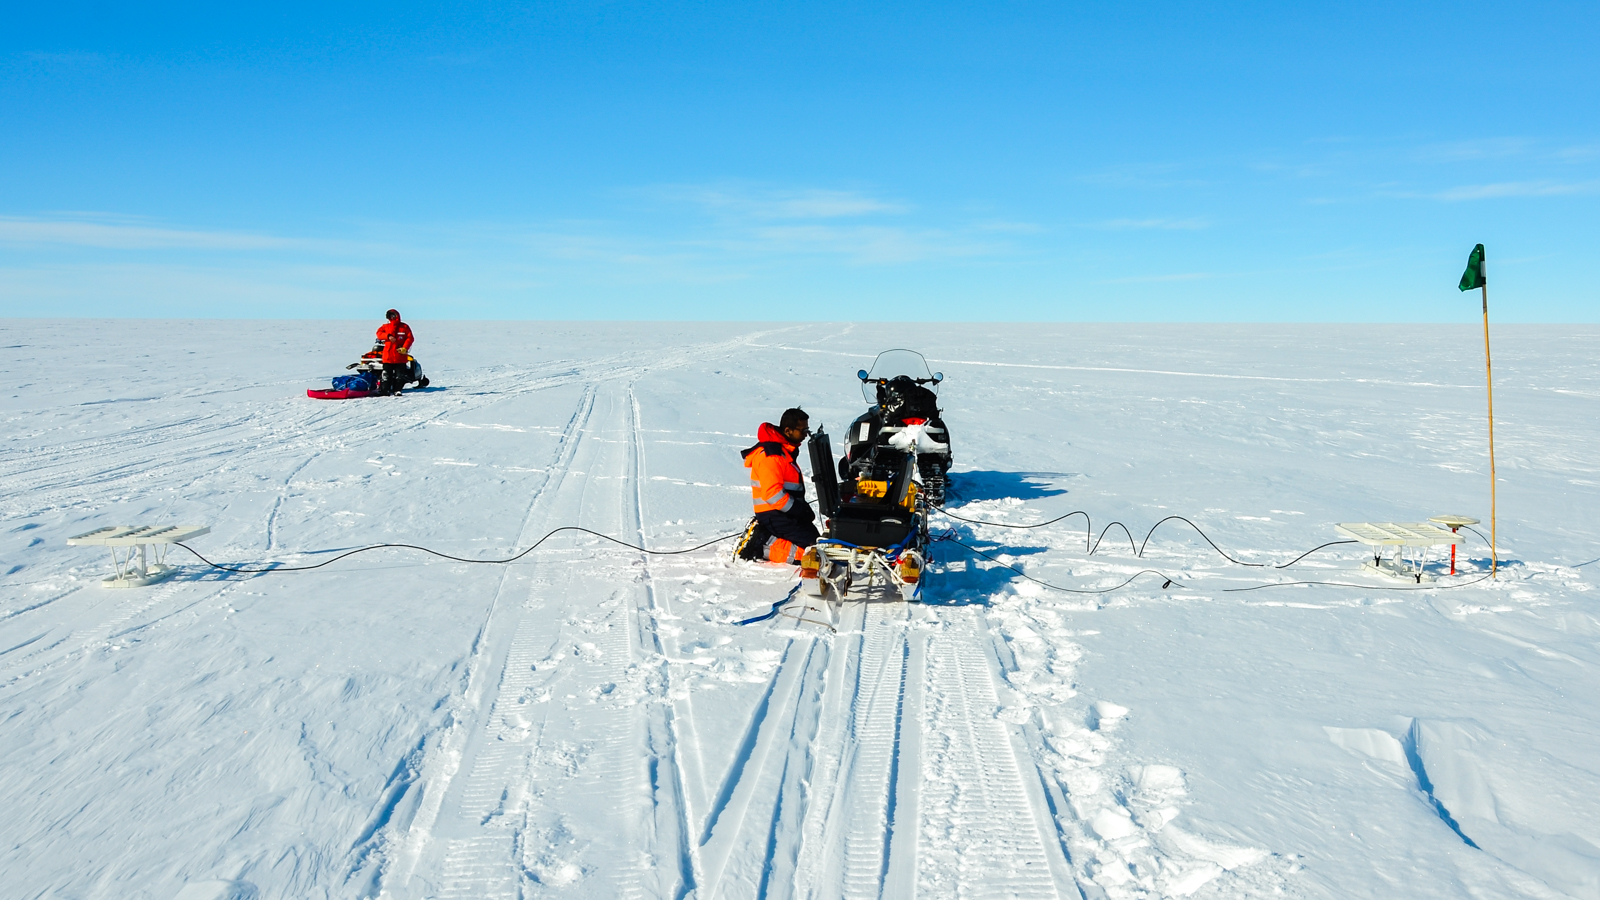
Figure 4. Polarimetric radar sounding using lightweight phase-sensitive radars is becoming increasingly popular in quantifying ice fabric. Here, TJ is using an ApRES to infer the fabric properties at the Eastern Shear Margin of Thwaites Glacier.

Figure 5. Collecting seismic data on Kongsvegen in Svalbard – to better understand the structure of the glacier and the bed material beneath it. The seismic (sound) source is a vibrating plate (foreground) and the recording cables (geophones) are stretched out into the distance. Emma Smith is pictured operating the recording equipment. [Photo Credit: Anja Diez]
Why should we care about ice fabric?
Ice is considered by glaciologists to be a non-Newtonian material, meaning that it deforms when subjected to pressures (forming ice fabrics), and breaks over a certain threshold (resulting in crevasses and icebergs) (Fig. 6). This is how ice is characterised in the majority of models that emulate and predict the flow of glaciers from land to ocean.
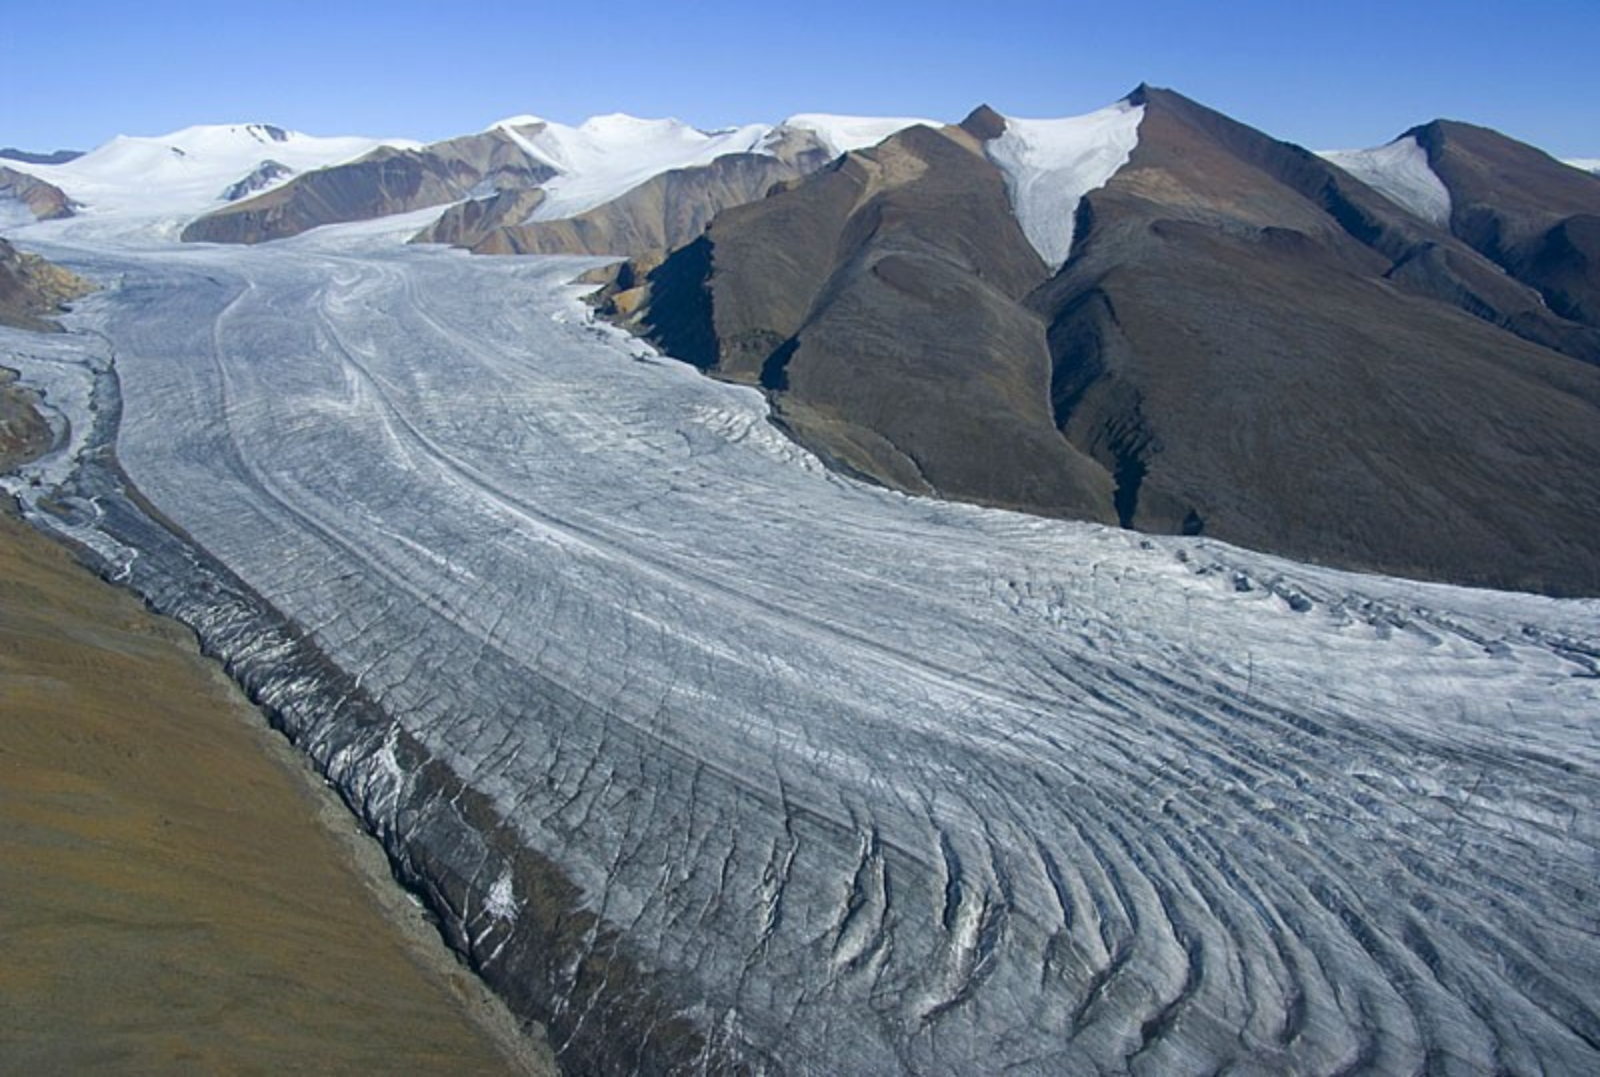
Figure 6. Glaciers stretch as they flow downhill due to gravity. If the stretching exceeds a certain limit, the ice splits to create crevasses. This aerial photo of Crusoe Glacier, on Axel Heiberg Island in the Canadian Arctic, is a good visual example of why glaciers can be considered ‘non-Newtonian’. [Credit: Jürg Alean (Glaciers Online)]
The natural anisotropy of ice–or its preferential softness–suggests that ice flows faster than if its crystals were isotropically oriented. Therefore, ice fabric represents an enhancement to its flow. However, most ice flow models assume ice to be isotropic. Although this is simply not the case, the current suite of ice fabric observations are too scarce and don’t represent a sufficiently wide variety of flow regimes to be able to be incorporated into flow models via parameterisations. As a result, flow models are likely to underestimate the flow of ice, and therefore the speed of sea level rise.
The fabric of ice sheets is one of the least-understood phenomena in glaciology, yet it represents a huge uncertainty in our ability to accurately predict the future of the polar ice sheets and its glaciers. This is perhaps the most direct motivation that drives research of ice fabrics and rheology (the study of flow). At the same time, recall that the fabric structure of ice represents its accumulated flow history. Therefore, a greater understanding of ice fabrics not only can better elucidate how ice sheets have behaved in the past, but also determine how it will change in the near future.
Further readings
To learn more about how ice fabrics form and develop:
- Russell-Head & Budd (1979) Ice-sheet flow properties derived from bore–hole shear measurements combined with ice-core studies. Journal of Glaciology 24(90):117-130. doi: 10.3189/S0022143000014684.
- Azuma & Higashi (1985) Formation Processes of Ice Fabric Pattern in Ice Sheets. Annals of Glaciology 6:130-134. doi: 10.3189/1985aog6-1-130-134.
- Alley (1988) Fabrics in polar ice sheets: Development and prediction. Science 240(4851):493-495. doi: 10.1126/science.240.4851.493.
- Richards et al. (2021) The evolution of ice fabrics: A continuum modelling approach validated against laboratory experiments. Earth and Planetary Science Letters 556:116718. doi: 10.1016/j.epsl.2020.116718.
Ice core studies of ice fabric:
- Thorsteinsson et al. (1999) Strain-rate enhancement at Dye 3, Greenland. Journal of Glaciology 45(150):338-345. doi: 10.3189/S0022143000001830.
- Montagnat et al. (2014) Fabric along the NEEM ice core, Greenland, and its comparison with GRIP and NGRIP ice cores. The Cryosphere 8(4):1129-1138. doi: 10.5194/tc-8-1129-2014.
Various geophysical methods to remotely infer ice fabric:
- Horgan et al. (2008) Complex fabric development revealed by englacial seismic reflectivity: Jakobshavn Isbræ, Greenland. Geophysical Research Letters 35(10):L10501. doi: 10.1029/2008GL033712.
- Smith et al. (2017) Ice fabric in an Antarctic ice stream interpreted from seismic anisotropy. Geophysical Research Letters 44(8):3710-3718. doi: 10.1002/2016GL072093.
- Kluskiewicz et al. (2017) Sonic methods for measuring crystal orientation fabric in ice, and results from the West Antarctic ice sheet (WAIS) Divide. Journal Of Glaciology 63(240):603-617. doi: 10.1017/jog.2017.20.
- Rongen et al. (2020) Observation of an optical anisotropy in the deep glacial ice at the geographic South Pole using a laser dust logger. The Cryosphere 14:2537-2543. doi: 10.5194/tc-14-2537-2020.
- Young et al. (2020) Rapid and accurate polarimetric radar measurements of ice crystal fabric orientation at the Western Antarctic Ice Sheet (WAIS) Divide deep ice core site. The Cryosphere Discussions. doi: 10.5194/tc-2020-264.
- Young et al. (2021) Inferring Ice Fabric From Birefringence Loss in Airborne Radargrams: Application to the Eastern Shear Margin of Thwaites Glacier, West Antarctica. Journal of Geophysical Research: Earth Surface 126(5):1-26. doi: 10.1029/2020JF006023.
Edited by Giovanni Baccolo
 Emma Smith (University of Leeds) and TJ Young (SPRI, University of Cambridge) are postdoctoral researchers within the TIME project of the International Thwaites Glacier Collaboration. Their research involves developing and implementing innovative radar and seismic techniques to measure fabric and deformational properties at shear margins, and how they complement coincident subglacial observations to contextualise glacier dynamics. They are also past and present early career representatives of EGU’s Cryosphere Section and are active in various outreach and JEDI (justice, equality, diversity, and inclusivity) efforts within the field of geoscience. They tweet as @emma_c_smith and @tjy511, and can also be contacted through their respective emails, e.c.smith1@leeds.ac.uk and tjy22@cam.ac.uk.