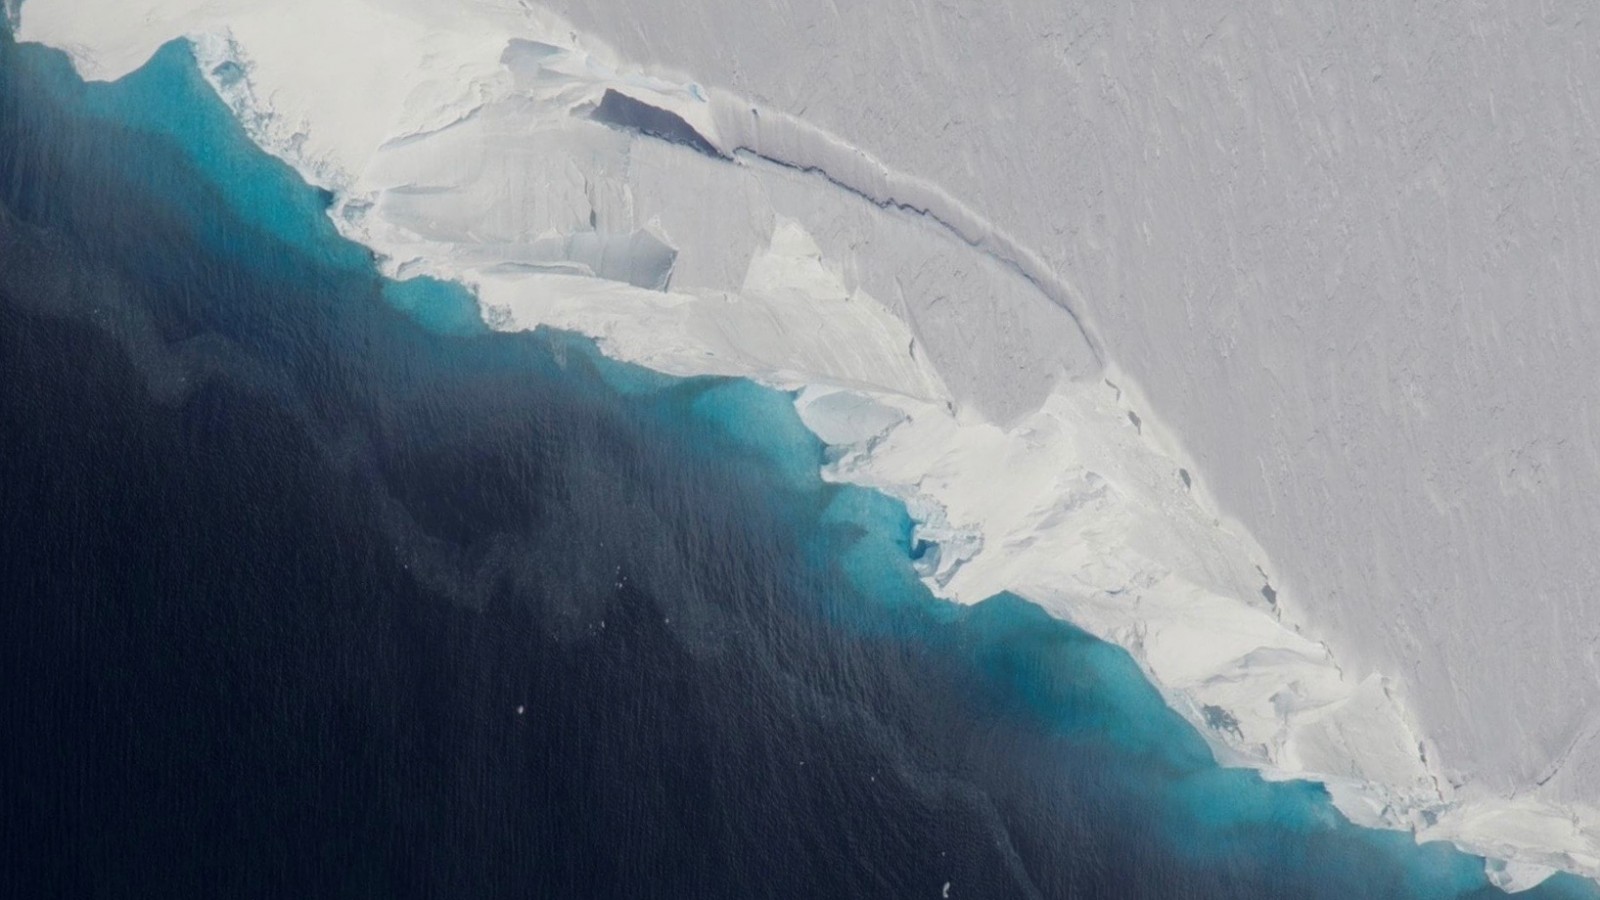
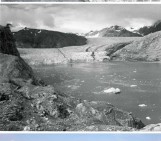
Aerial view of Thwaites Glacier [Credit: NASA/OIB/Jeremy Harbeck].
A 10km-long, 4-km-wide and 350m-high cavity has recently been discovered under one of the fastest-flowing glaciers in Antarctica using different airborne and satellite techniques (see this press release and this study). This enormous cavity previously contained 14 billion tons of ice and formed between 2011 and 2016. This indicates that the bottom of the big glaciers on Earth can melt faster than expected, with the potential to raise sea level more quickly than we thought. Let’s see in further details how the researchers made this discovery.
Thwaites Glacier
Thwaites Glacier is a wide and fast-flowing glacier flowing in West Antarctica. Over the last years, it has undergone major changes. Its grounding line (separation between grounded ice sheet and floating ice shelf) has retreated inland by 0.3 to 1.2 km per year in average since 2011. The glacier has also thinned by 3 to 7 m per year. Several studies suggest that this glacier is already engaged in an unstoppable retreat (e.g. this study), called ‘marine ice sheet instability’, with the potential to raise sea level by about 65 cm.
Identifying cavities
With the help of airborne and satellite measurement techniques, the researchers that carried out this study have discovered a 10km-long, 4km-wide and 350m-high cavity that formed between 2011 and 2016 more than 1 km below the ice surface. In Figure 2B, you can identify this cavity around km 20 along the T3-T4 profile between the green line (corresponding to the ice bottom in 2011) and the red line (ice bottom in 2016). According to the researchers, the geometry of the bed topography in this region allowed a significant amount of warm water from the ocean to come underneath the glacier and progressively melt its base. This lead to the creation of a huge cavity.
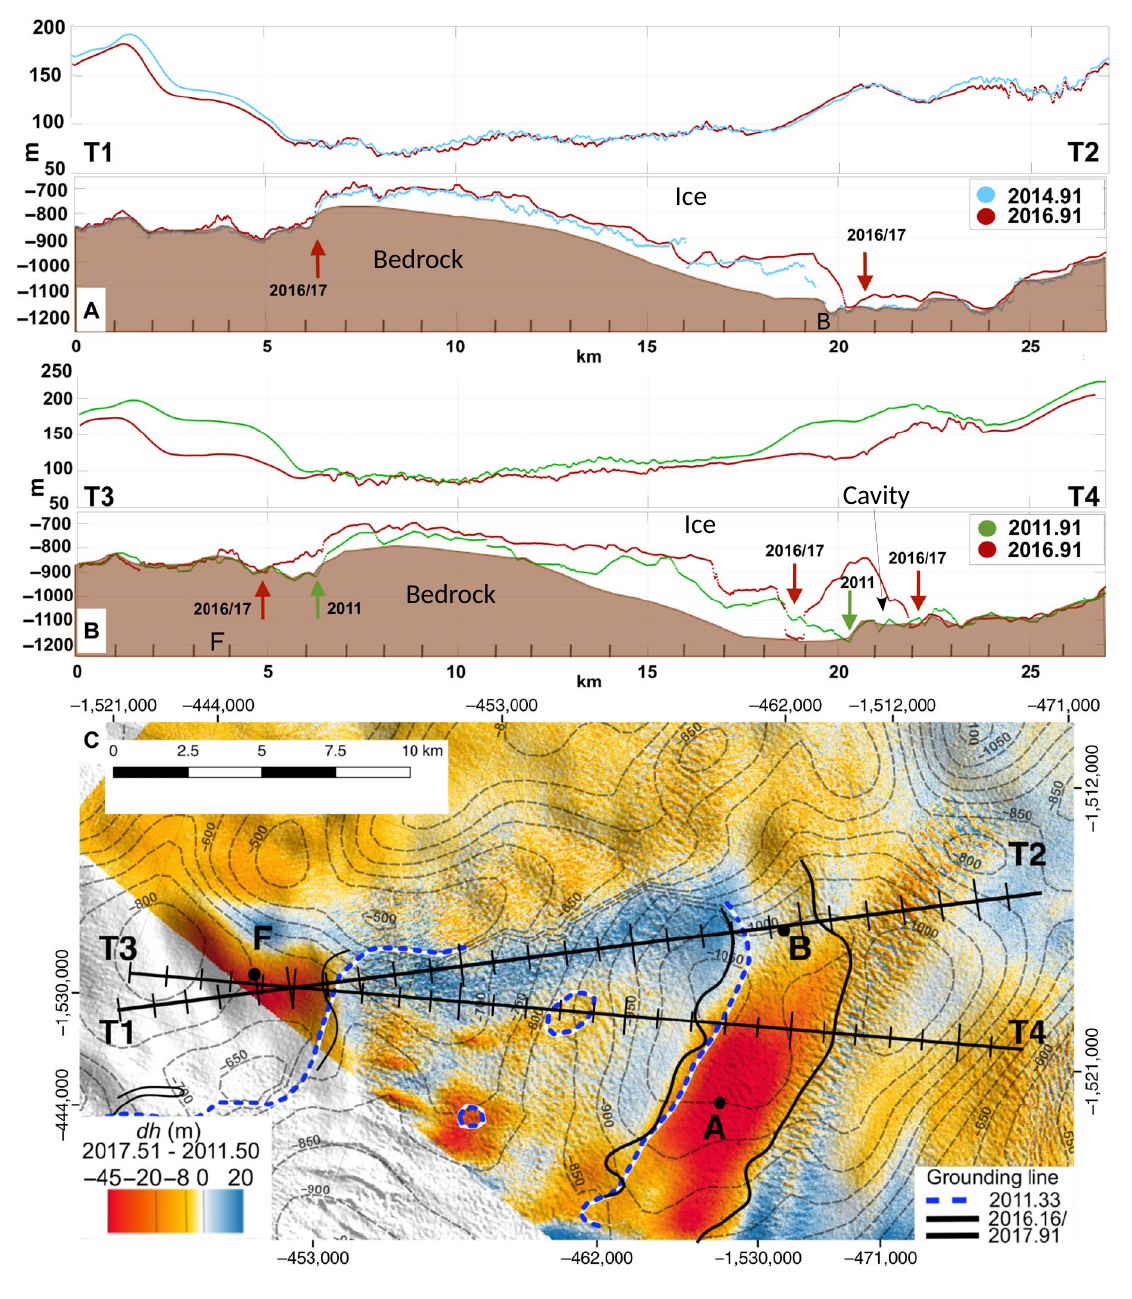
Fig. 2: A) Ice surface and bottom elevations in 2014 (blue) and 2016 (red) retrieved from airborne and satellite remote sensing along the T1-T2 profile identified in Fig. 2C. B) Ice surface and bottom elevations in 2011 (green) and 2016 (red) along the T3-T4 profile. C) Changes in ice surface elevation between 2011 and 2017. The ticks on the T1-T2 and T3-T4 profiles are marked every km [Credit: adapted with permission from Figure 3 of Milillo et al. (2019)].
What does it mean?
In order to make accurate projections of future sea-level rise coming from specific glaciers, such as Thwaites Glacier, ice-sheet models need to compute rates of basal melting in agreement with observations. This implies a correct representation of the bed topography and ice bottom underneath the glacier.
However, the current ice-sheet models usually suffer from a too low spatial resolution and use a fixed shape to represent cavities. Thus, these models probably underestimate the loss of ice coming from fast-flowing glaciers, such as Thwaites Glacier. By including the results coming from the observations of this study and further ongoing initiatives (such as the International Thwaites Glacier Collaboration), ice-sheet models would definitely improve and better capture the complexity of glaciers.
Further reading
-
Milillo, P., E. Rignot, P. Rizzoli, B. Scheuchl, J. Mouginot, J. Bueso-Bello, P. Prats-Iraola (2019). Heterogeneous retreat and ice melt of Thwaites Glacier, West Antarctica. Science Advances, doi: 10.1126/sciadv.aau3433.
-
Rasmussen, C. (2019). Huge cavity in Antarctic glacier signals rapid decay. NASA press release.
Edited by Sophie Berger

David Docquier is a post-doctoral researcher at the Earth and Life Institute of Université catholique de Louvain (UCL) in Belgium. He works on the development of processed-based sea-ice metrics in order to improve the evaluation of global climate models (GCMs). His study is embedded within the EU Horizon 2020 PRIMAVERA project, which aims at developing a new generation of high-resolution GCMs to better represent the climate.
CBLMHFH
Very interesting, good job and thanks for sharing such a good blog.
David Docquier
Thanks for your positive comment.