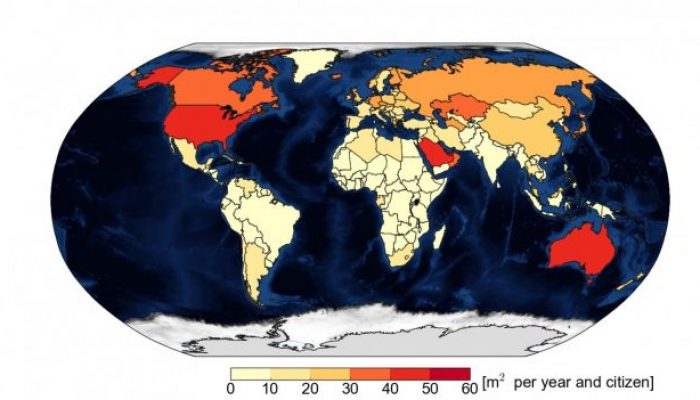
Declining sea ice in the Arctic is definitely one of the most iconic consequences of climate change. In a study recently published in Science, Dirk Notz and Julienne Stroeve find a linear relationship between carbon dioxide (CO2) emissions and loss of Arctic sea-ice area in summer. Our image of this week is based on these results and shows the area of September Arctic sea ice lost per inhabitant due to CO2 emissions in 2013.
What did we know about the Arctic sea ice before this study?
Since the late 1970s, sea ice has been dramatically shrinking in the Arctic, losing 3.8% of its area per decade. Sea-ice area is at its minimum in September, at the end of the melting season.
The main cause of this loss is the increase in surface temperature over the recent years (Mahlstein and Knutti, 2012), which has been more pronounced in the Arctic compared to other regions on Earth (Cohen et al., 2014). The use of statistical methods involving both observations and climate models shows that the recent warming in the Arctic can be attributed to human activity, i.e. mainly greenhouse gas emissions (Gillett et al., 2008). This suggests a direct link between human activity and Arctic sea-ice loss, which is confirmed in the Fifth Assessment Report of the Intergovernmental Panel on Climate Change (IPCC).
How exactly is sea-ice loss related to CO2 emissions ?
Notz and Stroeve (2016) relate the Arctic sea-ice decline to cumulative CO2 emissions since 1850 (i.e. the total amount of CO2 that has been emitted since 1850) for both observations and climate models. Cumulative CO2 emissions constitute a robust indicator of the recent man-made global warming (IPCC, 2014).
The two quantities are clearly linearly related (see Figure 2). From 1953 to 2015, about 3.5 million km² of Arctic sea ice have been lost in September while 1200 gigatonnes (1 Gt = 10e9 tonnes) of CO2 have been emitted to the atmosphere. This means that for each tonne of CO2 released into the atmosphere, the Arctic loses 3 m² of sea ice.
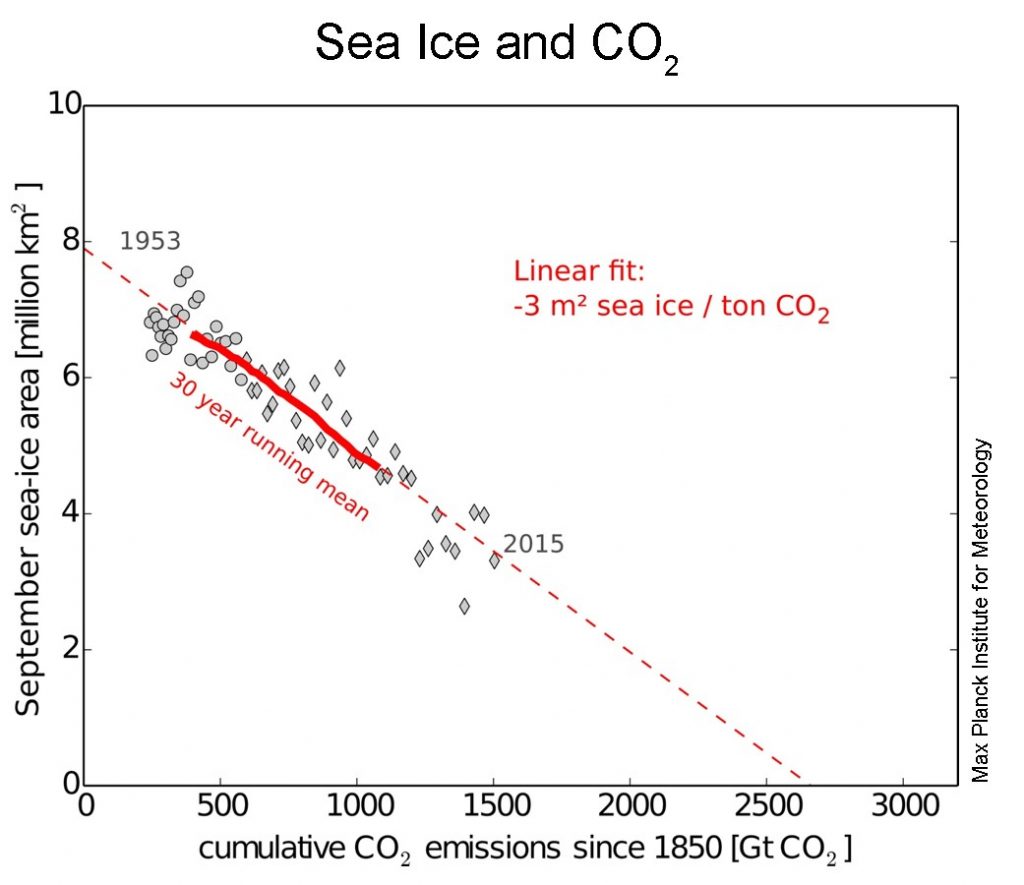
Fig 2: Monthly mean September Arctic sea-ice area against cumulative CO2 emissions since 1850 for the period 1953-2015. Grey circles and diamonds show the results from in-situ (1953-1978) and satellite (1979-2015) observations, respectively. The thick red line shows the 30-year running mean and the dotted red line represents the trend of 3 m² sea-ice area loss per tonne of CO2 emitted. [Credit: D. Notz, National Snow and Ice Data Center ]
Starting from the relationship between cumulative CO2 emissions and sea-ice area, it is then easy to attribute to each country in the world their own contribution to sea-ice loss based on their CO2 emissions per capita. The countries that stand out in the map are thus the countries emitting the most in relation to their population.
Could the Arctic be ice-free in the future?
If this relationship holds in the future (in other words, if we extend the red dotted line to zero sea-ice area in Figure 2), adding 1000 Gt of CO2 in the atmosphere would free the Arctic of sea ice in September. Since we are currently emitting about 35 Gt CO2 per year, it would take less than 30 years to have the Arctic free of sea ice in the summer (which confirms previous model studies (e.g. Massonnet et al., 2012)).
Edited by Clara Burgard and Sophie Berger
Further reading
- Notz, D. and Stroeve, J. (2016). Observed Arctic sea-ice loss directly follows anthropogenic CO2 emission, Science, doi: 10.1126/science.aag2345
- Image of the week – Climate Change and the Cryosphere
 David Docquier is a post-doctoral researcher at the Earth and Life Institute of Université catholique de Louvain (UCL) in Belgium. He works on the development of processed-based sea-ice metrics in order to improve the evaluation of global climate models (GCMs). His study is embedded within the EU Horizon 2020 PRIMAVERA project, which aims at developing a new generation of high-resolution GCMs to better represent the climate.

Pingback: Cryospheric Sciences | Image of the Week – The ups and downs of sea ice!
Pingback: Cryospheric Sciences | Climate Change & Cryosphere – Why is the Arctic sea-ice cover retreating?
Pingback: Cryospheric Sciences | Ice-hot news: The IPCC Special Report on the Oceans and the Cryosphere under Climate Change