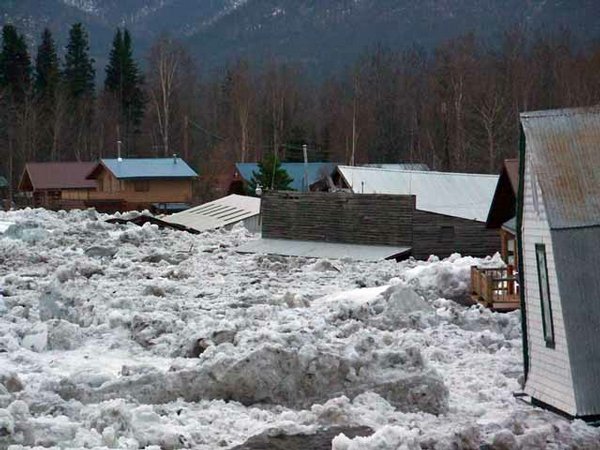
Ice and floodwater inundate a town in Alaska because an ice jam formed downstream (credit: U.S. National Park Service)
Why?
When a river freezes over, it changes the amount of water that flows through the river system. River ice affects many of the world’s largest rivers, and in the Northern Hemisphere, approximately 60% of rivers experience significant seasonal effects. The formation and evolution of river ice changes river discharge and is not only of interest to local ice skating enthusiasts. The variations in river discharge can lead to severe situations, such as ice jams/dams (with an accompanying risk of flooding), or issues that affect the management of hydroelectric power plant infrastructures.
How?
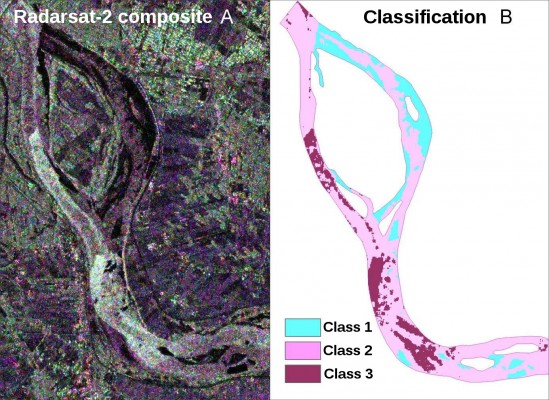
Satellite data have a huge potential for river ice monitoring thanks to the capability of imaging large areas. Synthetic Aperture Radar (SAR) systems are particularly promising as they can acquire data day or night without regard to cloud cover. In this way the extent of river ice can be mapped in great detail. The image of this week was produced applying one specific SAR technique : the polarimetry.
What?
The image of this week is a false color composite with the different polarimetric channels (red = HH, green = HV and blue = VV) of RADARSAT-2 images. The nature of the ground/ice surface will influence the way the waves sent by the radar interact with it and thus the value of the backscattered signal in different polarisation. The pattern on the left image was then introduced in an algorithm to automatically retrieve different types of ice (right image). Recognising ice types from space is an essential step to monitor and then predict processes such as ice dam collapses.
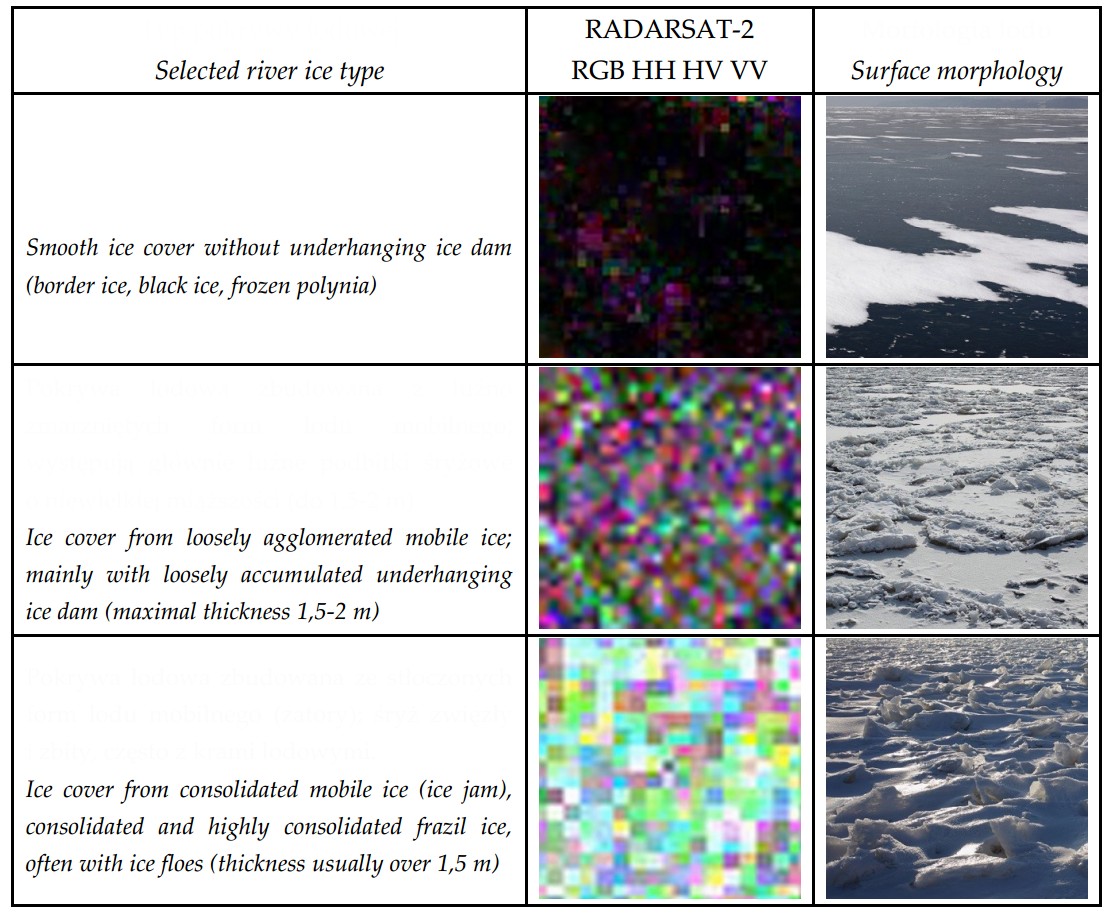
Photo-interpretation key of the different types of ice, after Pawłowski et al (2015)
Reference
Pawłowski B., Łoś H., Osińska-Skotak K. (2015) The first approach of ice filling and river ice cover types classification for the lower Vistula River based on satellite SAR data. Monografie Komisji Hydrologicznej PTG ; t. 3, pp. 313-324.
Also check out:
–This previous image of the week on SAR polarimetry applied to sea ice
–The image of last week about another type of ice dam, at the terminus of a glacier
Pingback: Cryospheric Sciences | Image of the Week – Breaking the ice: river ice as a marker of climate change