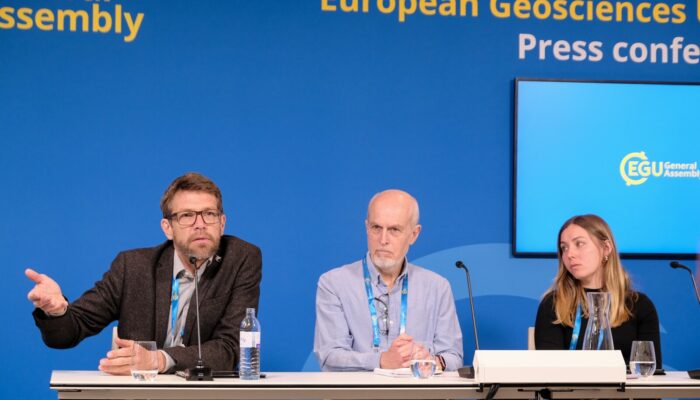
Did you know that some of the scientists of each General Assembly get invited to a press conference to face a group of curious journalists? I did not – but as press assistant for the #EGU24, I had the unique chance to attend the press conference “Unveiling Antarctica’s secrets: new research brings us one step closer to predicting the future of the icy continent”. Prominent scientists (Fig.1) from the British Antarctic Survey and the International Thwaites Glacier Collaboration first took us on a stroll through their recent work and findings during their presentations, followed by opening the floor to questions from the journalists. Come read with me about what they found!
Why does scanning ice from outer space help us to understand a glacier?
As first speaker, Olaf Eisen, Professor of Glaciology (AWI, Germany) took us on a zoom into west Antarctica, where the continent currently faces the largest total ice mass losses. Historical reconstructions of sea level changes so far helped to get an idea of the former dimensions to adjust what we can expect in the future (read more global ice masses and climate change here). That is why studying the Antarctic ice sheet stability is of concern. Not only the warming atmospheric temperatures, but also the increasing ocean water temperatures impact Antarctica. These waters run under the glacier shelf and thin it from below, which leads to a flushing out of ice, laying bare the underlying bedrock, and making even more ice available to melt into ocean. This process is called marine icesheet instability (MISI).
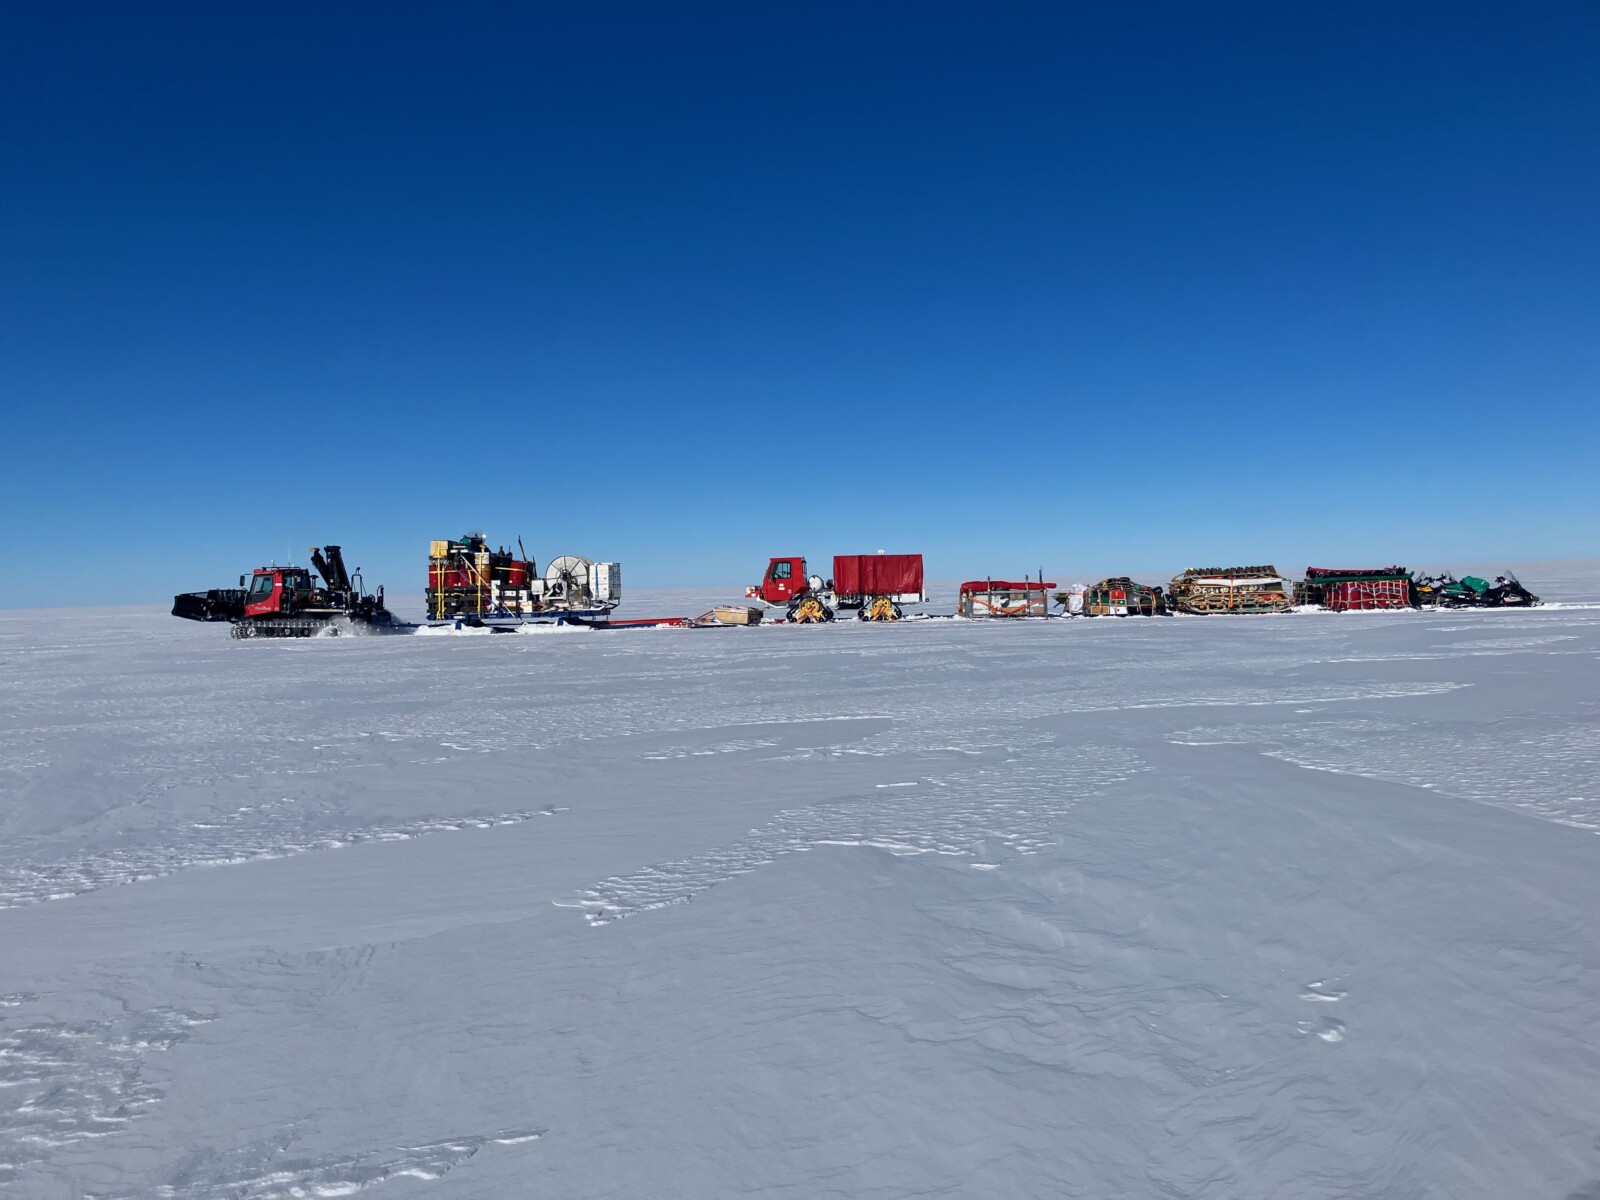
If you look at the changes of elevation in the icy surface of the Antarctic continent, you will predominantly see decreases all over the west coast of Antarctica (Smith et al. 2020). The Thwaites Glacier lies quite in the middle of this west Antarctic ice loss zone and is one of the most inaccessible glaciers in Antarctica. You can only get there from McMurdo or Rothera stations by bringing all your modes of transportation and tents towed by another vehicle slowly, day by day (see Fig. 2).

Fig. 2 Give me a lift?! When undertaking research on distant and inaccessible glaciers, you might have to bring a tiny village of tents, more vehicles, and… researchers with you (Photo credit: Ole Zeising, AWI via BAS)
And yes, you heard that right: on the coldest of all our continents, researchers often perform their fieldwork in tents while approaching the glacier over the course of days! There, the Thwaites Glacier is the single greatest contributor to ice mass loss from all of Antarctica. Geophysical and satellite-based data help us to connect the dots between rising sea level and the melting of glaciers, ice sheets and ice shelves.
Altimetry, ice flow and mass budget: calculations that help us to understand where a glacier loses ice – and how much of it.
One way to scan into such a huge glacier is called microseismic measurements which are performed at glacier ice surface. A 70 cm wide base plate emits a signal into the ice, and the reflection is caught by receivers, capturing the change of signal in response to the characteristics of the ice it went through. This process then is repeated every 75 meters – imagine how long that takes!
Over the course of several weeks in 2022, researchers set out to record a 208 km long seismogram of this kind going with the flow of the glacier. The result revealed a slice through the length of the glacier with differently dense areas, exposing the heterogenous morphology of the glacier. Soft sediments and harder bedrock changed the direction of the ice crystals. Later, a research team made a similar 137km-long seismogram across the flow profile to reveal transparent areas, that could possibly be liquid water or very moist sediments.
“Lakes inside glaciers?”, a journalist in the audience asked? Yes, actually did you know the biggest lake on Earth is a subglacial one called Lake Vostok that can be found under the Antarctic Ice, and even contains some life in it!

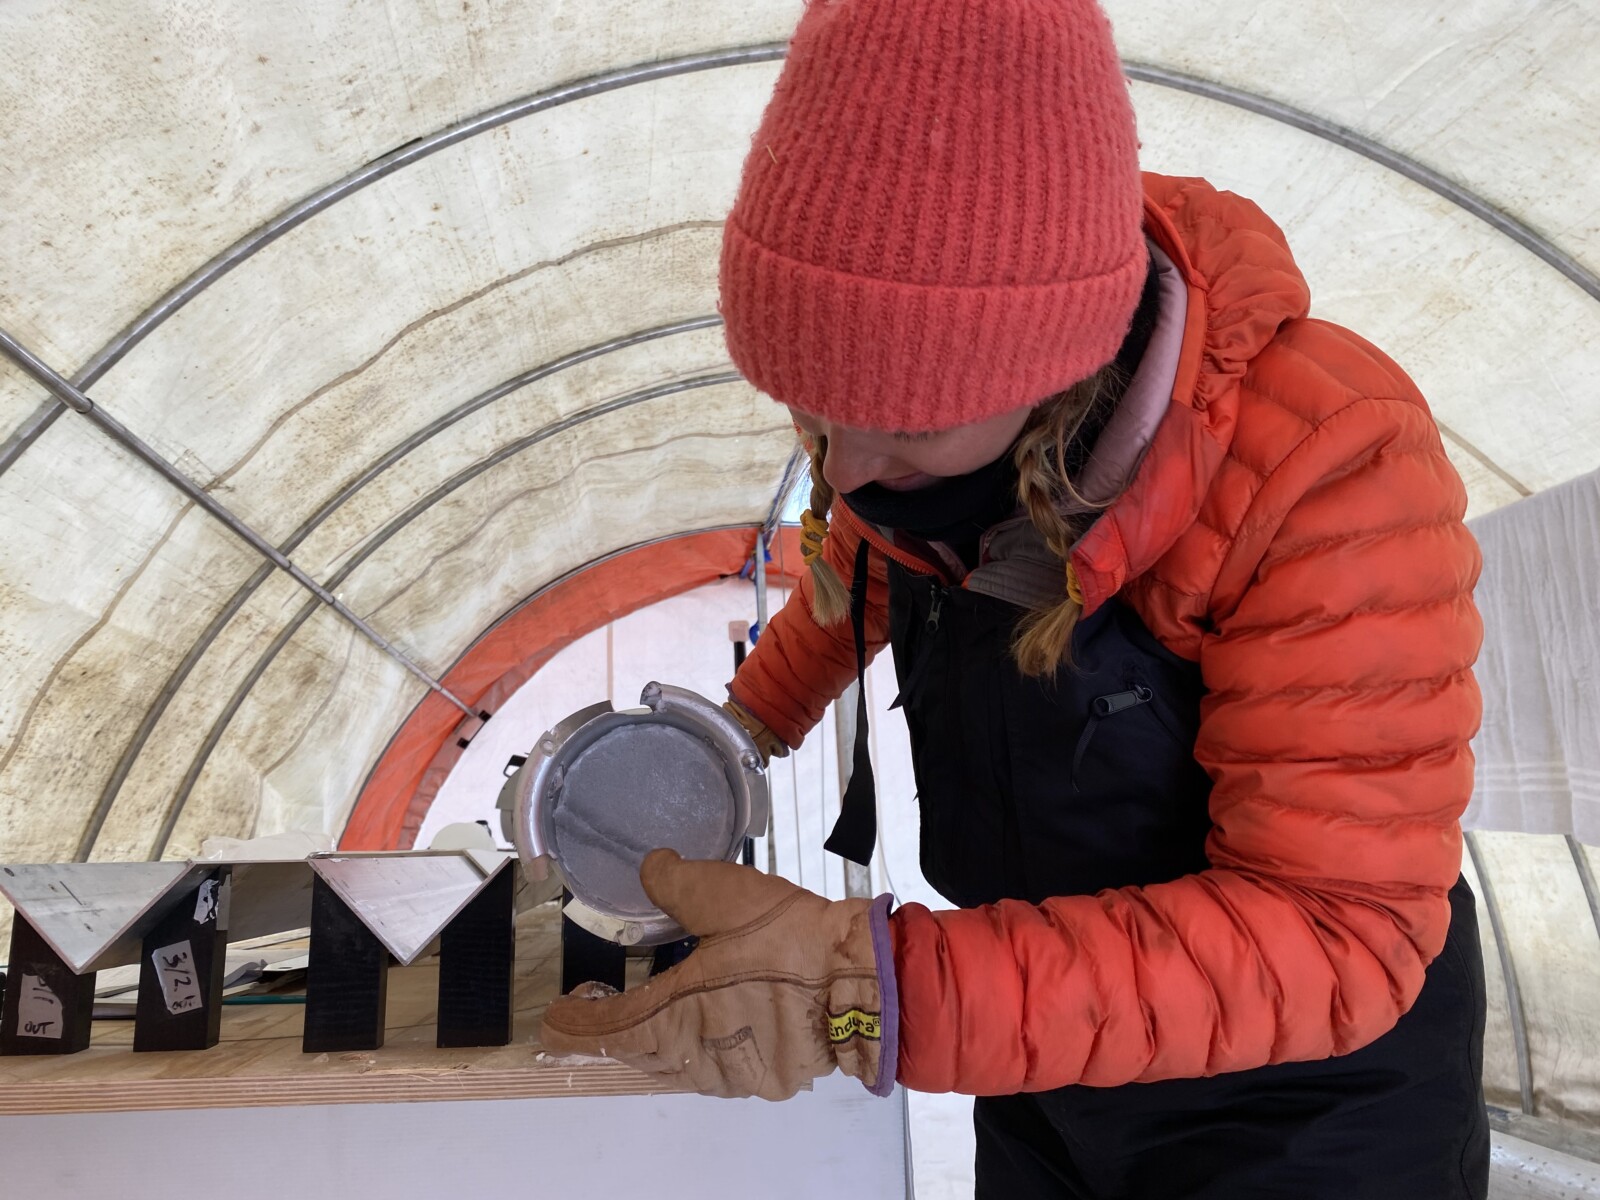
Fig. 3: You can see Emma with a freshly sampled ice core. The cut across its diameter shows well how heterogenous the ice “fabric” can be (Photo credit British Antarctic Survey).
About following chasms, reading ice fabrics and calving ice-cities
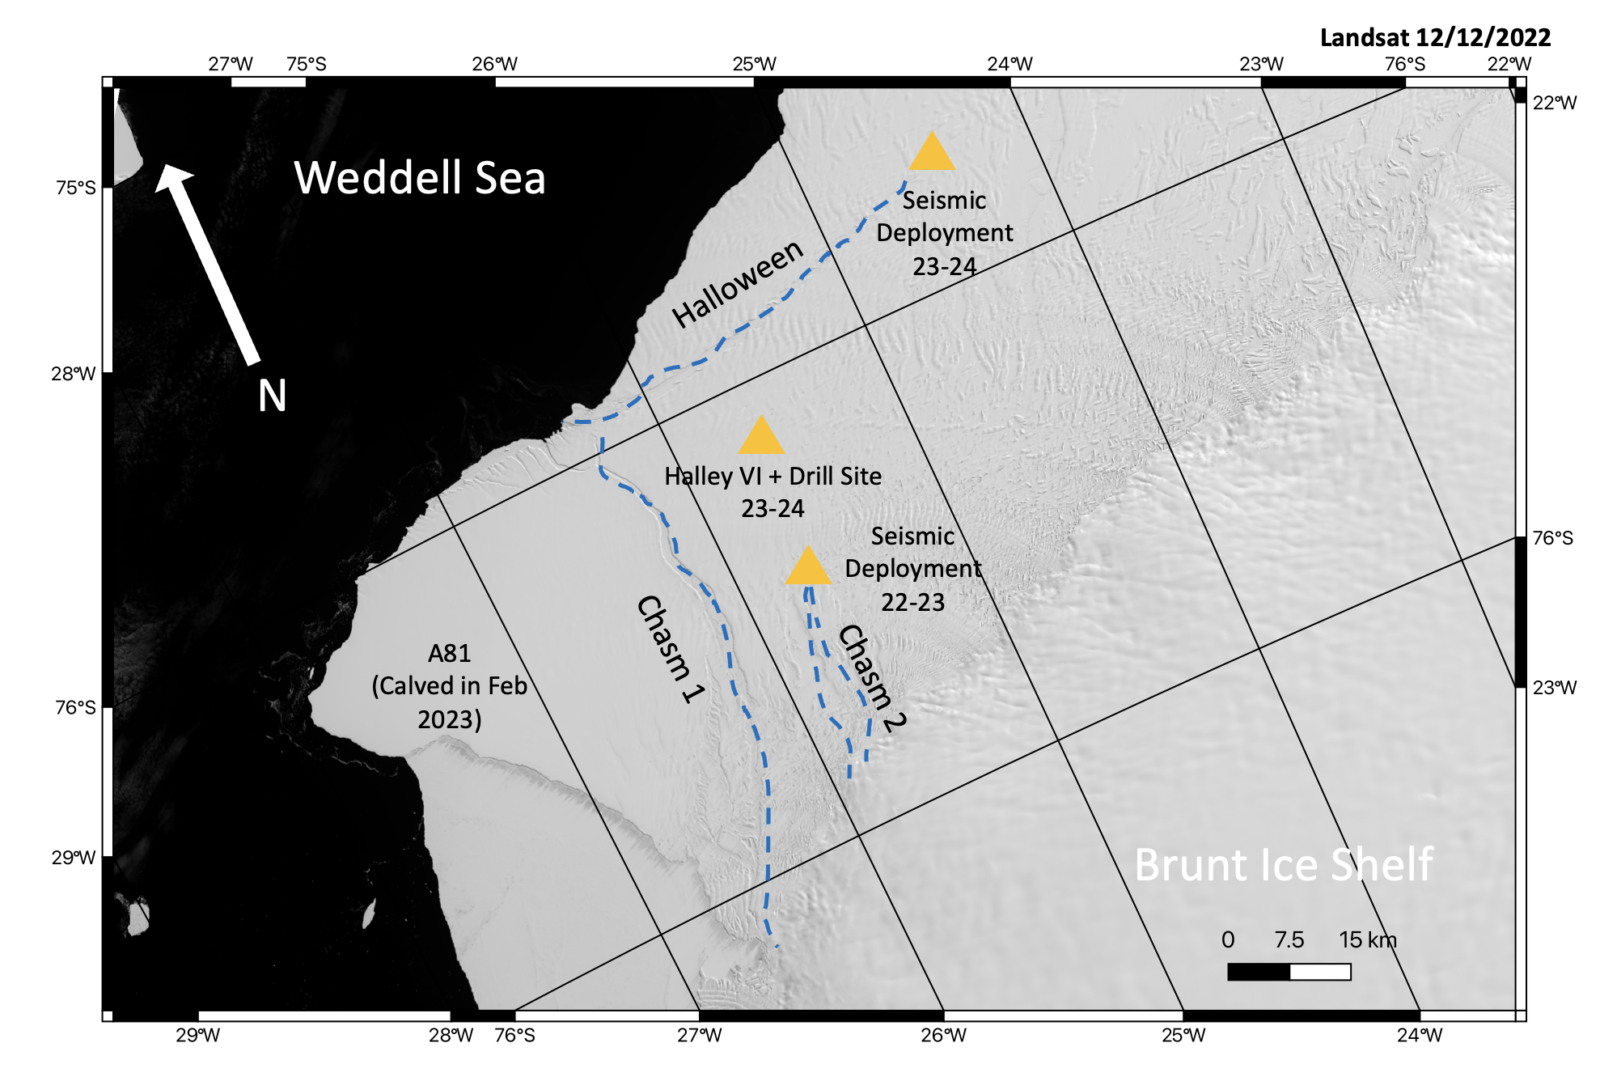
Emma Pearce and Liz Thomas (both from the British Antarctic Survey) also transported the Press Conference to Northern Antarctica – to the Brunt Ice Shelf. As one of most monitored iceshelfs in Antarctica (even Shackleton had his eye on it in 1915). Recently it has been calving enormous icebergs; the size of Paris (A47) in 2021 and London (A81) in 2023 – you can read more about it in this blog. That is the spot on the map we are talking about (Fig. 3).
Emma is an ice fracture geophysicist (RIFT-TIP project) and together with paleoclimatologist Liz stayed in a tent for three months on North Antarctica to take a 110m deep ice core. They stayed close to Halley VI research station (read more about her time there in Emma’s fieldwork blog post, Fig. 3). The whole station is built on skis in order to move it when needed. When chasms and cracks forming too close – which they did before, in 2017 – the whole station actually got moved! One might think – why place a station there then? But it’s advantage exactly lies in getting researchers like Emma and Liz close to those risky formations and allowing them to study these ice features as they appear.

Fig. 4. The Brunt Ice Shelf with the iceberg A81 that calved in February 2023 in close vicinity to the Halley VI research station (Image Credit: British Antarctic Survey).
Close to the current station the chasm 2, is currently forming (Fig. 4) – drawing the scientists back to the icy continent to sample ice cores into the different materials of the ice shelf and understand its evolution. By combing the vertical ice core data and combining with satellite and geophysical data in order to better understand the dynamics of these features – an important step in better predicting the loss of ice in the form of calving icebergs from this shelf in the future.
Liz Thomas, who joins online explains further that she sees ice as being made up of different “fabrics”. When taking the cores at the Brunt Ice Shelf, they either faces continental ice or a type of core that consisted of freshly fallen snow, then compacted to firn, which was compacting more with depth but then also indicated increased brine levels, the closer they got to the underlying sea ice and sea water. This brine partly can also “glue” continental ice back together – although there is no doubt that this would not a possible solution for a whole iceberg.
What about the future?
One journalist asked: “How important is the melting of Thwaites Glacier ice for future sea level rise?” Ted Scambos (University Colorado), also in the audience, but a researcher also working within the ITGC explained that in the future glacier will naturally continue to retreat. Similar to the uncertainties expressed in the IPCC, some scenarios are more or less likely. Yet, marine ice shelf instability remains a problem. He explains that it actually fully collapsed before in the last interglacial period (130 000 and 115 000 years BP) it is important to continue researching the current processes in the ice shelf. Robert Larter, a marine geophysicist at the British Antarctic Survey, who was interviewed at the press conference as well, extends on this:
“I think it is important to look in terms of sea level rise that at the end of the last century, Thwaites did not contribute so much, but over the course of this century we see that the mass loss has increased dramatically and is now many times of what it was in the 80s. And the question really is how fast that increase really will be.” – Robert Larter
Understandably, a lot of the journalists’ questions asked the scientists to give estimations for our future – the to-be-expected doom levels, one might say.
All scientists agreed, that while historic records allow insights into what is possible, and uncertainty limits exact predictions of timing and expense of Antarctic ice loss, the urge to shift societal practices is now. Olaf Eisen closes with the statement:
“There is physics on one site and society on the other. If you are on the path of 1.5C, which we might reach in a few years. The problem is, that once these tipping points were reached, it will take at least hundreds of years to bring them back. So there is no question we have to act!” – Olaf Eisen
Further reading
– Find out more about the work of the International Thwaites Glacier Collaboration and the British Antarctic Survey in Antarctica
– Emma’s Cryosphere Blog post ”Did you know? We can see what’s going on inside an ice shelf using geophysics!”
– Geolog blog post: Researchers share insights from first-of-its-kind ice loss study of Antarctic Ice Sheet
Edited by Asmae Ourkiya & Hazel Gibson


