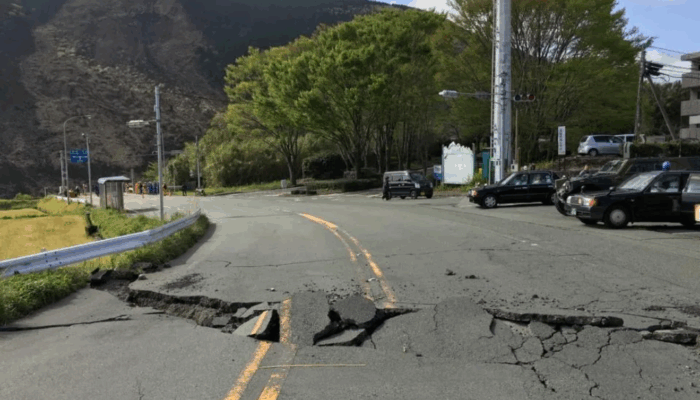
What does a seismogenic fault look like? We can sometimes observe surface earthquake faults, which propagate ruptures from the hypocenter to the ground surface. In 2016, intense seismicity was observed during the Kumamoto earthquake sequence in Japan. This sequence consisted of many shallow earthquakes, including a strong foreshock and the subsequent mainshock with numerous aftershocks. The earthquakes occurred along multiple faults including a fault junction, which implies complex fault interaction. How would such a complex shallow earthquake fault appear in terms of various surface and geomorphic changes? In this post, we introduce the surface earthquake faults of the 2016 Kumamoto earthquake sequence!
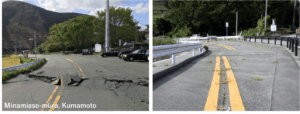
Fig. 1. Futagawa fault cutting across a road. (Left) Taken shortly after the earthquake in 2016 (Kumamoto Earthquake Memorial Museum KIOKU, 2025). (Right) Credits: Yuto Sasaki, 2025.
Two earthquake events, and one rare case
In 2016, two large earthquakes hit Kumamoto, in the western part of Japan. The magnitudes were Mw = 6.2 on April 14 and Mw = 7.0 only twenty-eight hours later. These earthquakes with many aftershocks are recognized as the Kumamoto earthquake sequence (Kato et al., 2016). Many areas experienced the strongest level of shaking (equivalent to the Japanese seismic intensity scale level 7), where Mashiki, a city in Kumamoto, experienced it in both events. Many cities and people suffered from severe damage (Fig. 1, 2). Today, although reconstruction is progressing, numerous traces of the earthquake can still be observed, and preservation efforts are also underway. This blog post is mainly based on Torii et al. (2025).
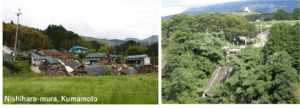
Fig. 2. Damage caused by the earthquake. (Left) Severe damage from house collapses. Photo from 2016 provided by Nishihara-mura, Kumamoto. (Right) Destruction of a bridge. Credits: Yuto Sasaki, 2025.
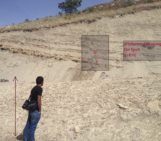
This earthquake sequence was caused by the Futagawa and Hinagu Fault Zones. The main shock on April 16 was triggered on the Futagawa fault, an active fault, which has moved over the past several thousand to tens of thousands of years. Fig. 3 shows the map around the fault zone. Researchers have collected surface peeling samples from the same trench outcrops of the fault both before (in 1995) and after (in 2023) the Kumamoto earthquakes (Fig. 4). This pair of samples demonstrates that the active fault plane is really (repeatedly) “active” by showing no newly generated fault plane. Although this is an important assumption in assessing fault activity, it is rare to be confirmed that a known active fault has slipped again. Among these rare cases, the Kumamoto fault is only the third example in the world. Note that the main displacement of the fault is right-lateral strike-slip (horizontal), which cannot be confirmed from Fig. 4 but from other evidence (Torii et al., 2025 and references therein).
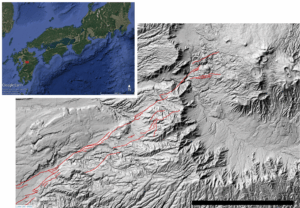
Fig. 3. Distribution map of active faults shown as red lines, in the hatched region (inset). The map was produced by the National Institute of Advanced Industrial Science and Technology (2025). Scale bar: 10 km.
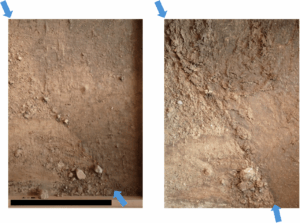
Fig. 4. Surface peel samples of the Futagawa fault before (left) and after (right) the 2016 earthquakes. The fault line is indicated at both ends with blue arrows, with the nearly horizontal (partly disturbed) continuity of the layers visible on either side. Both samples were taken from almost the same outcrop. This pair provides evidence that the active fault is truly “active” and repeatedly slips. For convenience, the photos of the peel samples are mirrored horizontally. Scale bar: 1 m. Credits: Yuto Sasaki, 2025.
Evidence from the field
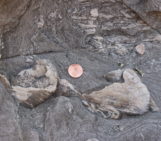
At another location, you can see the cumulative displacement of the fault as the bedrock jutting out of the cliff surface (Fig. 5). This cliff also moved in the 2016 earthquakes, which was confirmed by a newly exposed portion (Torii et al., 2025). Another observable indication of the fault at the surface is provided by a river channel (Fig. 6). As a fault repeatedly fractures and weakens the bedrock, a river flows downstream along the fault while eroding the fault rock. At the bottom of Fig. 6, which lies on the extension of this river, is the fault shown in Fig. 1.
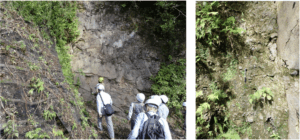
Fig. 5. (Left) Outcrop of the Futagawa fault, seen from the normal direction to the slip plane. The wall rock on the far side protrudes from the cliff wall rightward, relative to the near side. We can see the cumulative displacement. (Right) Fault plane seen from the parallel direction to the plane (from right to left in the left figure). Some cataclastic blocks can be seen. Credits: Yuto Sasaki, 2025.
As shown in Fig. 3, the faults extend in a NE–SW direction. However, a careful look shows that there are two parallel fault lines, one on the northern side and the other on the southern side. In fact, the northern fault is a right-lateral strike-slip fault (Futagawa fault), while the southern one is a normal fault (Idenokuchi fault). These two faults moved at the same time during the earthquake. This is weird, because the way forces act on normal faults and strike-slip faults is markedly different (SAGE, 2021: https://www.iris.edu/hq/inclass/animation/fault_types_3_basic_responses_to_stress_). Toda et al. (2016) have suggested a model in which a single fault plane at depth branches into two different types of faults at the surface, providing a consistent and coherent explanation.
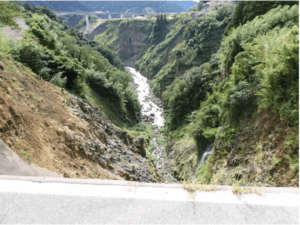
Fig. 6. River preferring to erode the weaker region, that is, the Futagawa fault. This picture was taken from the location shown in Fig. 1 (looking toward the right in that figure). Credits: Yuto Sasaki, 2025.
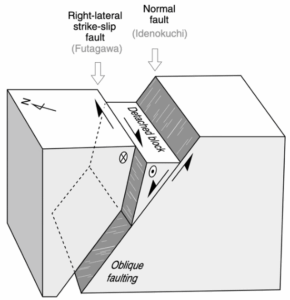
Fig. 7. Explanation for the coexistence of a right-lateral strike-slip fault (Futagawa Ffault) and a normal fault (Idenokuchi Ffault). This figure is from Fig. 7 in Toda et al. (2016).
Landslides
In addition to the impacts from strong ground motion (Fig. 2, left), earthquake-induced landslides also caused extensive damage. To reconstruct the history of earthquake-induced landslides and fault activity, geophysical studies—such as seismology and geodesy—as well as structural geology are necessary. However, this is not all; interpreting the stratigraphic relationships and relative displacement of sediments and rock blocks is crucial, where sedimentological insights thus play a critical role.

Fig. 8. Significant landslide caused by the earthquakes. (Left) Taken shortly after the earthquake in 2016 (Kumamoto Earthquake Memorial Museum KIOKU, 2025). (Right) Credits: Yuto Sasaki, 2025. The collapsed bridge in Fig. 2 (right) is located along the extended line of sight.
While Kumamoto has suffered extensive earthquake damage, it is also a region where faults and volcanoes have shaped beautiful landscapes (Fig. 9) and cultural heritage. During the field trip, which this blog is based on, many people from both inside and outside the country visited as tourists. Alongside our research contributions addressing the severe earthquake impacts, we earnestly wish for Kumamoto’s continued recovery.
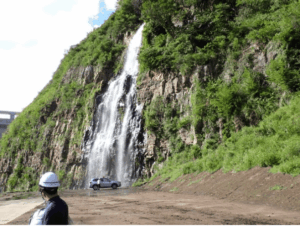
Fig. 9. Waterfall flowing over a cliff of volcanic columnar joints. Credits: Yuto Sasaki, 2025.
We acknowledge Kumamoto Earthquake Memorial Museum KIOKU, Nishihara-mura, and Minamiaso-mura for permitting the use of photos. We also acknowledge the authors of Torii et al. (2025) for organizing the field trip that this blog is based on.
We express our deepest condolences to all those who suffered from the 2016 Kumamoto Earthquakes.
References
Kato, A., Nakamura, K. & Hiyama, Y. (2016). The 2016 Kumamoto earthquake sequence. Proceedings of the Japan Academy. Ser. B: Physical and Biological Sciences, 92, 358–371. https://www.jstage.jst.go.jp/article/pjab/92/8/92_PJA9208B-04/_article
Kumamoto Earthquake Memorial Museum KIOKU (2025). Passing on memories of the Kumamoto Earthquake for the future to learn from Gallery-style field museum (website). https://kumamotojishin-museum.com/
National Institute of Advanced Industrial Science and Technology (2025). Active Fault Database of Japan, August 5, 2025 version (website). https://gbank.gsj.jp/activefault/index_e_gmap.html
NSF Seismological Facility for the Advancement of Geoscience (2021). Fault types: 3 basic responses to stress (website). https://www.iris.edu/hq/inclass/animation/fault_types_3_basic_responses_to_stress_
Toda, S., Kaneda, H., Okada, S., Ishimura, D. & Mildon, Z. K. (2016). Slip-partitioned surface ruptures for the Mw 7.0 16 April 2016 Kumamoto, Japan, earthquake. Earth, Planets and Space, 68. https://earth-planets-space.springeropen.com/articles/10.1186/s40623-016-0560-8
Torii, M., Okuno, M., & Toda, S. (2025). The 2016 Kumamoto earthquake, the Futagawa fault, and earthquake-induced geological disaster. Journal of Geological Society of Japan, 131. https://www.jstage.jst.go.jp/browse/geosoc/virtualissue/100181/_contents/