
Anne Pluymakers. Credit: TU Delft
Anne Pluymakers is an assistant professor at TU Delft, whose hobbies include experimental rock mechanics and fluid-rock interaction. She focuses on the effects of fluids on mechanical behaviour of rocks at representative in-situ temperature and pressure conditions, with a strong focus on hydrochemical fluid-rock interaction. Investigating the microstructure of the rock and how it is altered is critical to determining how mechanical and transport properties of rocks evolve during experiments and thereby the deformation processes at play. One of the latest tools in determining what happens at the microscale is 3D analysis, using either neutrons or X-rays, which is the topic of the current blog. The motivation for blog comes from Anne’s fascination of the information hidden in 3D images of rocks, and that writing this post helps her to organize her knowledge on how these powerful techniques work.
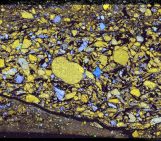
There are various subsections of the broad field of Earth Sciences that interest themselves in what rocks look like at the microscale, not only in terms of mineral constituents, but also in terms of structure. An example is the quantification of the location and sizes of pores, grains and cracks, with the purpose to understand which microscale processes have operated and can operate in the rock material. Especially for experimental rock mechanics, my own field of research, the presence and shape of pores determines rock strength. Moreover, the shape and connectivity of porosity is critical for fluids to percolate, with the potential for fluid pressure build-up and/or mineral reactions and other fluid-rock interactions. Using microstructures to determine what happens inside a rock has been an integral part of geology for more than a century: the historical collection of thin sections at the Bergakademie Freiberg, Germany contains samples that date back to 1870! Thin sections are slices of rock material glued to a glass plate. They are so thin (usually 30μm) that they are semi-transparent to light and can therefore be studied with a petrographical microscope. However, making them is a destructive technique since rock samples need to be sliced and polished. For experimentalists such as myself, looking to find what happens during a rock mechanics experiment, a destructive technique such as thin section making is definitely a disadvantage! Experiments would need to be stopped at different stages, at which point the rock sample needs to be taken out of the deformation apparatus, and cut up and ground to create a thin section that allows this 2D view (such as in this fantastic paper by (Engelder, 1974)). This is labour-intensive, and luckily, nowadays, there is another way.
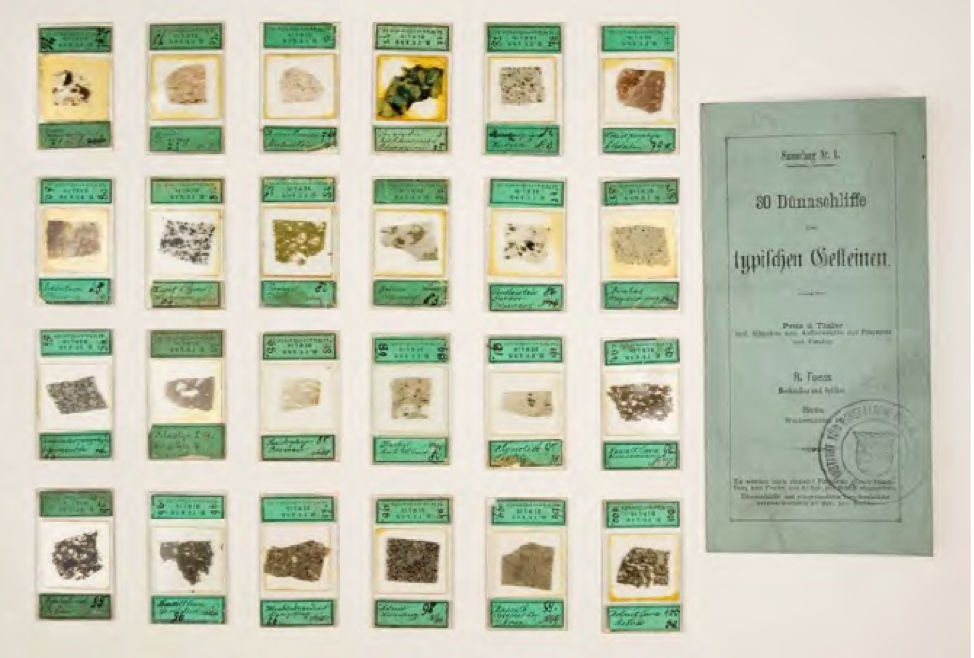
Fig. 1 Thin sections from 1987/1873, collection of Rudolf Fuess, Berlin. Now in Freiberg, Germany. Image credit
X-rays and neutrons
Ever since their discovery in 1895, X-rays have been used in many scientific fields, including geology and material sciences. X-rays are emitted when a charged particle (such as an electron or proton) is accelerated and hits a metal target. In an X-ray tube, commonly used in laboratory X-ray CT scanners, electrical input power is used to accelerate electrons inside a vacuum tube. The electrons are directed to hit a metal target, from which X-rays are then emitted. In a synchrotron, electrons are guided with magnets to travel around a ring under high vacuum, gathering high energy, before X-ray production in so-called undulators (a specific set of magnets). When X-rays subsequently pass through a sample (in geology commonly a rock sample, but there are also exist numerous medical applications), they get partly adsorbed by the electron cloud around atoms. Therefore, they are sensitive to the density of the material.
Neutrons are produced either in a nuclear reactor, where they are produced due to radioactive decay, or at a spallation source. In a spallation source, protons are accelerated which are then directed towards a suitable metal target, and neutrons are ejected. Neutrons are partly absorbed by the nucleus of atoms, and are particularly sensitive to the light isotopes and elements (Perfect et al., 2014). (Remember, isotopes are variations of the same chemical element, where each chemical element has the same number of protons and electrons and the isotopes have a different number of neutrons in the atomic core.) Due to this sensitivity to light isotopes, in geology, neutrons are often used to determine the water content in rock samples, either as pore water, or as inclusions.
Tomography
When a neutron or x-ray beam penetrates through a sample, part of it passes through, part of it is absorbed, and part of it is scattered. The particles passing through can be “photographed” with a special screen located behind the sample, thereby acquiring a 2D projection of the rock. Now, by rotating the sample, you can acquire a series of such 2D projection images. By taking projections around the entire sample (i.e. rotating it 360⁰), all these images can be mathematically correlated to each other, and a 3D reconstruction can be made. This is called computed tomography (CT), and when it is done for small samples and with high (micrometer) resolution, it is called computed micro-tomography.
For X-ray tomography there are three types of set-ups: two laboratory-based set-ups, and designated facilities called synchrotrons. The most well-known laboratory set-up is a medical CT-scanner (Figure 2A), also used in medicine. This holds human-sized samples and deformation apparatuses, and typically has a sub-centimetre resolution. In these set-ups, the X-ray source and acquisition system rotate around the sample. In the second laboratory set-up (Figure 2B) the samples are much smaller, centimetre- to perhaps decimetre-sized, and it is the sample that rotates. These consist of a stationary X-ray source, a rotating sample and a screen. In both these set-ups X-rays are made in an X-ray tube, i.e. a point source, and therefore the beam is cone-shaped. In the imaging process this can lead to artefacts. The third type of set-up is a synchrotron (Figure 2C), which is a large facility in which high-energy X-rays are generated. The electrons travel through a ring (which can be tens of meter in diameter!) with the help of magnets. The X-rays get selected based on their energy spectrum, and only quasi—parallel beams pass through the sample. Synchrotrons deliver high quality and nanometre-resolution imaging of rock samples. For more technical details, see for example this review by Cnudde & Boone (2013).
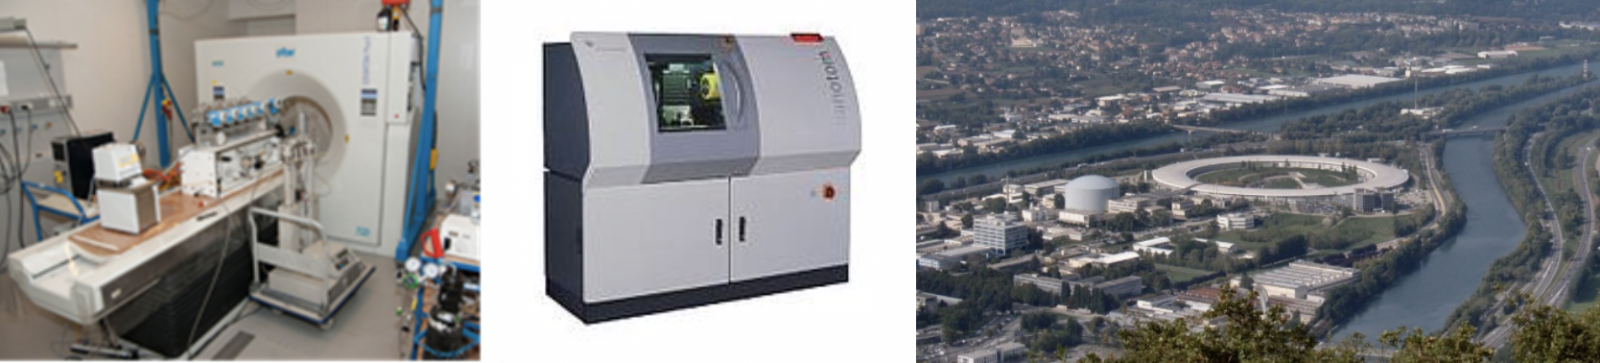
Fig. 2 A (left): the medical CT scanner with an experimental core flood set-up in the scanning bed at TU Delft; B) the micro CT scanner “Nanotom” at TU Delft (both images from TU Delft); C) aerial view of the ESRF Synchrotron facility in Grenoble. The ring-shape contains the storage- and acceleration rings in which the electrons travel. Image credit: TU Delft and Wikipedia.
Typical neutron imaging beamlines are very similar, where there is a neutron source, and the neutrons are guided towards a sample on a rotating stage. After the sample, in order to capture the image, the residual neutrons pass through a converter called a scintillator, a lens and eventually are captured by a very fancy digital (CCD) camera. For technical details, see the review by Perfect et al. (2014).
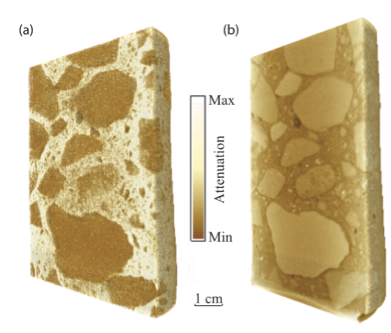
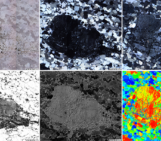
Fig. 3 a) Neutron tomography and b) X-ray tomography of the same concrete sample (Lamanna et al., 2017)
There are now several institutes in the world that place neutron and X-ray systems at perpendicular angles, allowing to image the same sample with both techniques. This Figure 3 (from Lamanna et al., 2017) is a concrete core, which contains hydrous phases, liquid water and non-hydrous phases. This makes it ideal to highlight the differences between neutron tomography (Figure 3a), where mainly the hydrous cement filler phases are bright, and X-ray tomography (Figure 3b), where the dense central clasts are bright.
From a pretty image to science
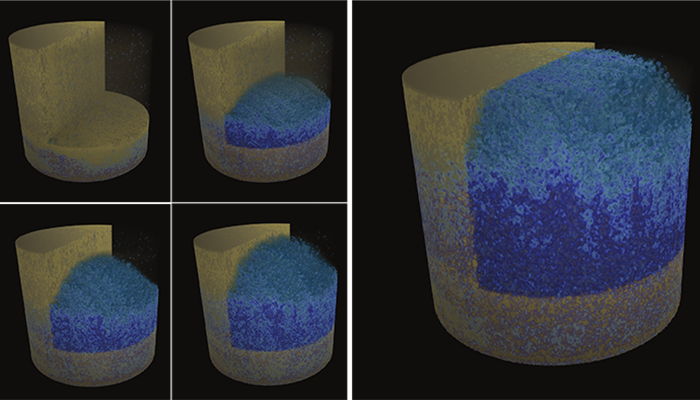
After the scan is taken, the 2D slices are mathematically reconstructed to become a 3D volume. The building blocks of this volume are called voxels, which are basically 3D pixels. Each voxel has a grey value, depending on how much of the X-rays/neutrons was absorbed. By processing this grey-scale data with specialized software, a process called segmentation, we can go from qualitative data to quantitative data. Typically, during this process, different mathematical image filtering routines are used to eliminate noise, and to enhance the features of interest. An example of segmented 3D data is shown in Figure 4, where Macente et al. (2018) created and analysed 3D images of a pack of NaCl salt without or with biotite grains after compaction for different amounts of time. The different colours indicate the connected pore clusters, showing that the presence of biotite flakes leads to compartmentalisation of the pore space, thereby creating a potential barrier for flow.
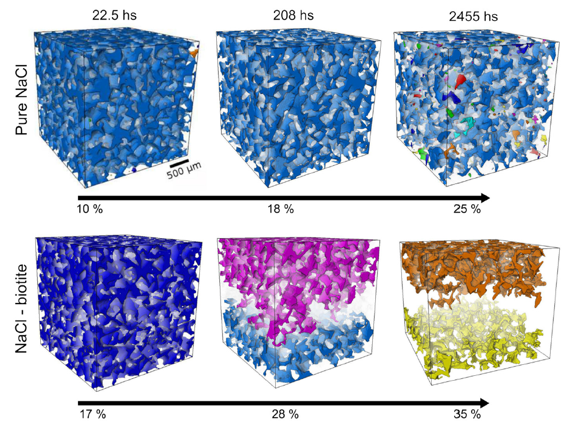
Fig. 4 Segmented 4D X-ray images of salt compaction without and with biotite flakes (Macente et al., 2018).
Outlook: from 3D to 4D
Tomography, based on either X-rays or neutrons, is a powerful imaging tool to capture geological processes at high resolution and in a non-destructive manner. In the past years, spatial resolutions have improved significantly due to the increased power of x-ray and neutron beams and better computing power. Even in laboratory setups, we can now obtain x-ray 3D images of rocks with less than micron resolution (Renard, 2012), and for neutron 3D images 15 μm is possible (Perfect et al., 2014). With improved computing power, the acquisition times are also improving. The future of rock deformation lies in the combination of tomography and experiments: more and more experimentalists are imaging 3D processes through time, i.e. in 4D. The first 4D experimental data has been published, for example on rock failure (Renard, 2012), pressure solution (Macente et al., 2018) or flow of contaminants (Cordonnier et al., 2019). This means that sample assemblies are put inside the beam chamber, and experiments are performed in-situ. In doing so, one needs to consider not only the spatial but also the temporal resolution: the process you want to image needs to be slow enough versus acquisition time that acquisition does not get blurred. It will be exciting to see how high the spatial and temporal resolution will improve with the new generation of scanners, and how far we can take “standard” rock deformation experiments into 4D imaging chambers!
Note: For more background reading on the technical details, I recommend the following review papers: (Cnudde & Boone, 2013; Fusseis et al., 2014; Perfect et al., 2014).
Edited by Hannah Davies and Derya Gürer
References
Cnudde, V., & Boone, M. N. (2013). High-resolution X-ray computed tomography in geosciences: A review of the current technology and applications. Earth-Science Reviews, 123, 1–17. https://doi.org/10.1016/j.earscirev.2013.04.003
Cordonnier, B., Pluymakers, A., Tengattini, A., Marti, S., Kaestner, A., Fusseis, F., & Renard, F. (2019). Neutron Imaging of Cadmium Sorption and Transport in Porous Rocks. Frontiers in Earth Science, 7, 306. https://doi.org/10.3389/feart.2019.00306
Engelder, J. T. (1974). Cataclasis and the Generation of Fault Gouge. Geological Society of America Bulletin, 85(10), 1515–1522. https://doi.org/10.1130/0016-7606(1974)85<1515:catgof>2.0.co;2
Fusseis, F., Xiao, X., Schrank, C., & De Carlo, F. (2014). A brief guide to synchrotron radiation-based microtomography in (structural) geology and rock mechanics. Journal of Structural Geology, 65, 1–16. https://doi.org/10.1016/j.jsg.2014.02.005
Lamanna, J. M., Hussey, D. S., Baltic, E., & Jacobson, D. L. (2017). Neutron and X-ray Tomography (NeXT) system for simultaneous, dual modality tomography. Review of Scientific Instruments, 88(11), 113702. https://doi.org/10.1063/1.4989642
Macente, A., Fusseis, F., Butler, I. B., Tudisco, E., Hall, S. A., & Andò, E. (2018). 4D porosity evolution during pressure-solution of NaCl in the presence of phyllosilicates. Earth and Planetary Science Letters, 502, 115–125. https://doi.org/10.1016/J.EPSL.2018.08.032
Perfect, E., Cheng, C.-L. L., Kang, M., Bilheux, H. Z. Z., Lamanna, J. M. M., Gragg, M. J. J., & Wright, D. M. M. (2014). Neutron imaging of hydrogen-rich fluids in geomaterials and engineered porous media: A review. Earth-Science Reviews, 129, 120–135. https://doi.org/10.1016/j.earscirev.2013.11.012
Renard, F. (2012). Microfracturation in rocks: from microtomography images to processes. The European Physical Journal Applied Physics, 60(2), 24203. https://doi.org/10.1051/epjap/2012120093