The next “Minds over Methods” blogpost is a group effort of Liene Spruženiece (left) – postdoctoral researcher at RWTH Aachen and her colleagues Joyce Schmatz, Simon Virgo and Janos L. Urai.

Credit: Liene Spruženiece
The Virtual Microscope is a collaborative project between RWTH Aachen University and Fraunhofer Institute for Applied Information Technology (Schmatz et al., 2010; Virgo et al., 2016).
In the multitude of tools to analyze rocks, the optical microscope is still one of the first go-to methods for rock characterization. A look on a petrographic thin section under an optical microscope gives a quick overview of the mineralogy and fabric of a rock and helps to determine the areas of interest for more detailed analysis with other methods. It is also a crucial part for teaching geology classes.
Most geoscience institutions already have a petrographic microscope that is equipped with a camera and maybe an automated stage for capturing image mosaics. However, these images make only limited use of the vast amount of information available, such as the overview of the sample fabric at different magnifications or the change of optical mineral properties (pleochroism and extinction behavior) with the rotation of polarizers. Although there have been recent developments in the field of virtual microscopy (NASA, 2007; The Open University; 2010; Tetley and Daczko, 2014), to our knowledge, none of the existing systems has been able to fully emulate a user experience in a virtual environment that is equal to using a traditional analogue microscope.
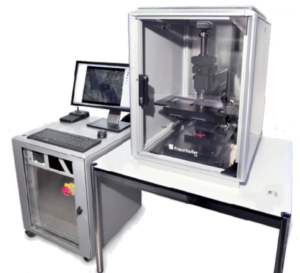
Figure 1. The setup of the PetroScan microscope. Credit: Fraunhofer FIT
How does it work?
The idea behind the virtual microscope is to capture the full information of entire rock thin-sections in a digital format, including the possibility to switch between plain light and crossed polarizers, rotate the polarizers and zoom everywhere in the sample at high magnifications.
The hardware part of our system consists of a fully automated petrographic microscope, connected to a computer (Figure 1). The software contains three modules; a PetroScan launcher for setting up the image acquisition, optimizer for combining and interpolating the scanned images and a viewer program (Figure 3).
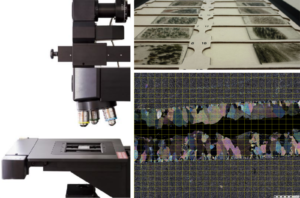
Figure 2. Automated sample stage allows capturing high resolution images of entire thin sections by combining thousands of images taken sequentially along a predefined grid. Credit: Jochen Hürtgen
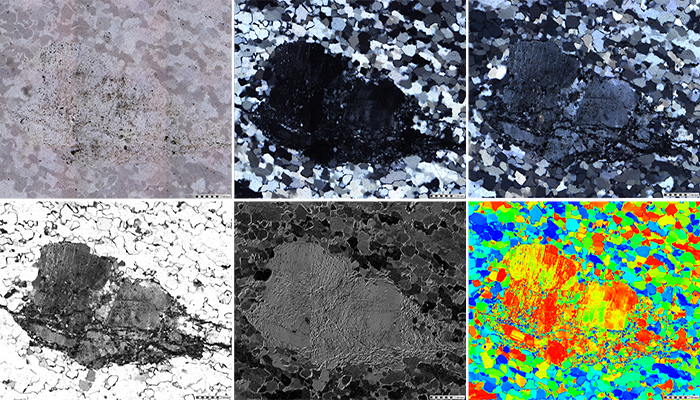
High-resolution mosaics (Figure 2) containing up to a million images can be acquired in a few hours. With crossed polarizers, the scans are performed for several rotation angles. The movement accuracy of the sample stage is about 10 nm. This ensures precise overlap of the scanned mosaics at different rotation angles, where each corresponding pixel has the same x-y coordinates. Thus, the images of each rotation angle are precisely overlapping and allow to interpolate the change in brightness values for every individual pixel in the mosaics, producing smooth curves (Figure 3) that reflect extinction behavior in minerals (Heilbronner and Pauli, 1993). Each attribute of these interpolated curves (phase, amplitude) of the sample can be viewed at any rotation angle.
Quantification of optical images
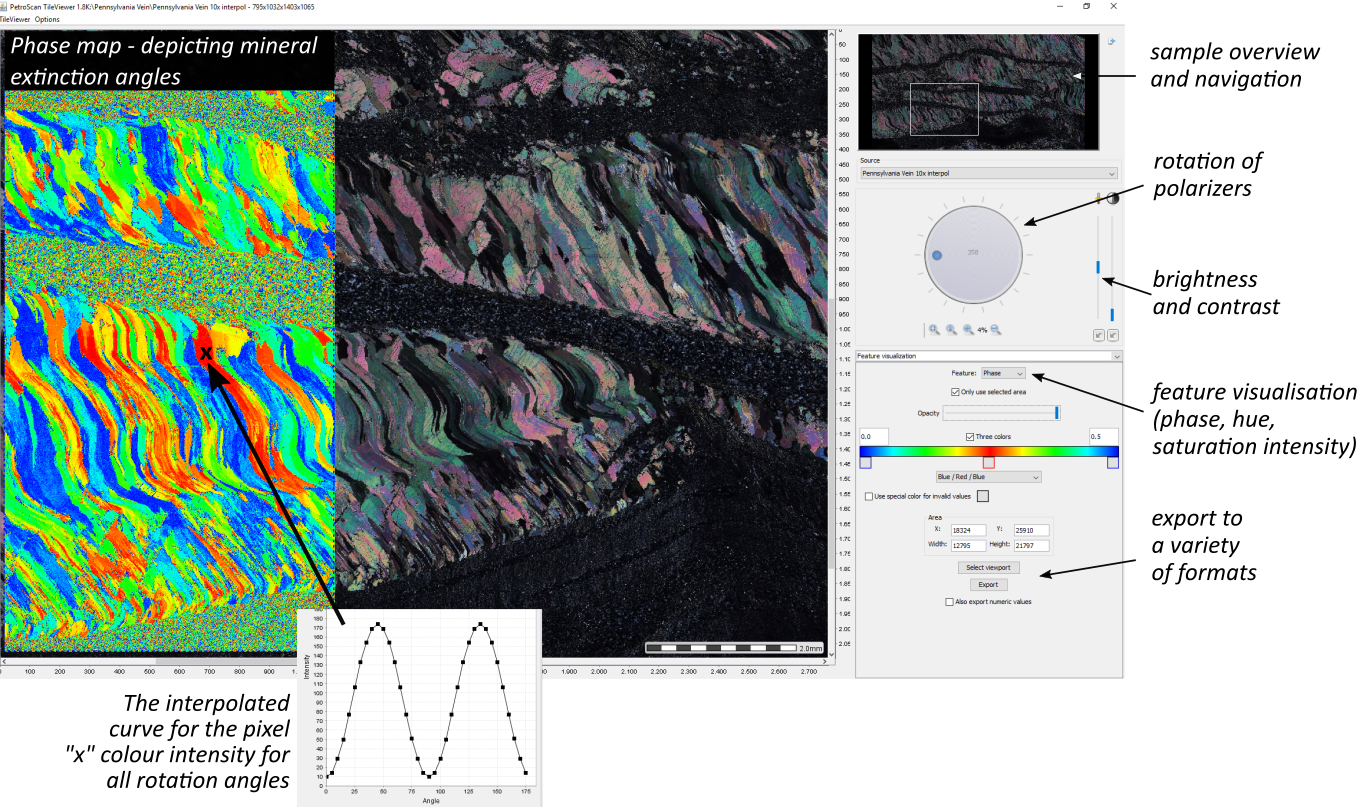
Figure 3. Screenshot of the PetroScan TileViewer window showing a thin section that is scanned under crossed polarizers. On the right side the scanned image is overlain by the phase map, where each pixel is color-coded according to the mineral extinction angles. Credit: Liene Spruženiece, Joyce Schmatz, Simon Virgo and Janos L. Urai
Virtual microscopy offers powerful means for quantitative analysis of giga pixel images to extract multi-scale information. It has a resolution of up to few micrometers for areas in sizes of 10 square centimeters. In its current form the viewer software that we developed contains a built-in toolbox for displaying and tresholding the intensity, saturation and hue values of the scanned images. This can be used for a quick estimation of sample porosity or proportions of different minerals. In addition, the scans with interpolated crossed-polarizer rotation also contain information of the mineral extinction behavior that is used to produce a “phase map” (Figure 3). The “phase map” displays the variations in the mineral optical axis orientations. Although it cannot provide absolute values for the crystallographic orientations, it allows a clear distinction between differently oriented mineral grains and allows easy visualization of qualitative lattice misorientations inside individual mineral grains. Furthermore, import and export functions are incorporated in the image viewing software. Thus more advanced image analysis can be carried out in specifically designated external softwares (e.g. Fiji/ImageJ, GiS, Matlab, Python), then inserted back in the PetroScan viewer software.
Applications in teaching
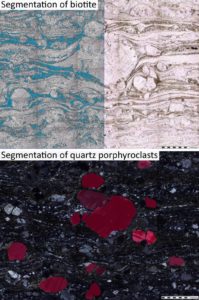
Figure 4. Mineralogy and fabrics of the scanned samples can be segmented and quantified using built-in toolboxes. The recognition of features is greatly improved by the possibility to zoom in the samples, switch between the plain light and crossed polarizers and rotate the polarizers. Credit: Liene Spruženiece, Joyce Schmatz, Simon Virgo and Janos L. Urai
At RWTH Aachen University, virtual petrography has been used as a teaching tool for several years. For example, it is extensively used in the microtectonics course. Each class consists of a short introduction in some of the common rock microstructures, such as veins, cataclasites, mylonites, dissolution-precipitation features and others. This is followed by an hour-long presentation by a student group, where they describe and discuss the respective microstructure in a scanned thin-section, projected to a screen with a high-resolution beamer. The students use laser pointers for characterizing the features and origins of the microstructure, switch between views in plain-polarized or crossed-polarized light, zoom in and out across the sample, adjust illumination settings, rotate polarizers and do basic image analysis (Figure 4). This has proven to be a highly engaging teaching method. The students in the audience question the presenting group asking to provide a closer look or more details on any interesting microstructural feature. Often hypotheses are formed by the listeners and immediately tested by the presenters, allowing to perform an investigation and agree on a reasonable explanation at the end of the class. Virtual petrography can be especially important in teaching institutions that do not own well-equipped microscopy labs. It only requires a computer and a projector. The thin section scans and PetroScan viewing software will be available for download online. Thus, such a method will not incur additional costs to the institutions, at the same time will provide a large collection of a high variety of geological samples.
The vision
We imagine a world-wide community built around the platform of virtual microscopy, where the information from different analytical methods can be exchanged between users and stored in open databases, available for teaching or research purposes. Many advantages arise from such a transformation. Work can be carried out anywhere without a need to access microscopes, several users can simultaneously view the same samples, data can be easily quantified and integrated between different methods, and thin-section libraries can be shared and exchanged by the user community.
Further plans for developing this method include collaboration with the computer vision department at RWTH Aachen University in order to create deep learning algorithms that allows quick and precise segmentation of rock microfabrics, such as mineral content and distribution, grain boundaries, grain sizes, porosity, etc. This has been made possible by recently obtained funding from the RWTH Aachen University “Exploratory Research Space – ERS”. The final data set will be public and shared with communities.
Edited by Derya Gürer
References
Heilbronner, R.P., Pauli, C. (1993). Integrated spatial and orientation analysis of quartz c-axes by computer-aided microscopy. Journal of Structural Geology, 15, 369-382.
Tetley, M.G., Daczko, N.R. (2014). Virtual Petrographic Microscope: a multi-platform education and research software tool to analyse rock thin-sections. Australian Journal of Earth Sciences 61, 631-637.
NASA (2007). Virtual Microscope. Available at: http://virtual.itg.uiuc.edu/
Schmatz J., Urai J.L., Bublat, M., Berlage, T. (2010). PetroScan – Virtual microscopy. EGU General Assembly, EGU2010-10061.
The Open University (2010). The Virtual Microscope for Earth Sciences Project. Available at: http://www.virtualmicroscope.org/.
Virgo S., Heup, T., Urai J.L., Berlage, T. (2016). Virtual Petrography (ViP) – A virtual microscope for the geosciences. EGU General Assembly, EGU2016-14669.

Tebogo Kelepile
Quotation for a virtual microscope for geoscience.