The 2026 drought has shown the dramatic consequences of river low-flow for freshwater ecosystems, drinking water supplies, agriculture, energy production or logistics. Understanding how often extreme low-flows might occur is therefore important for managing water resources and preparing for droughts. Hydrologists traditionally analyse historical streamflow records to estimate the probability and magnitude of extreme low-flows. But how reliable are those estimates, especially as climate change is expected to alter low-flow behaviour, increasing the drought periods and severity in many countries?
During my research on low-flow frequency estimation, I keep coming back to one central question: Do the assumptions behind our models adequately reflect how rivers actually behave during low flows? After all, even reliable streamflow observations cannot provide full insights if our models overlook the processes behind them.
In our recently published study, we developed a non-stationary low-flow frequency analysis framework and applied it across more than 700 European catchments. We investigated how seasonal processes, inter-seasonal dependence, and temporal changes influence estimates of extreme low-flow frequencies.
The challenge: different low-flow processes and non-stationarity in low-flow statistics
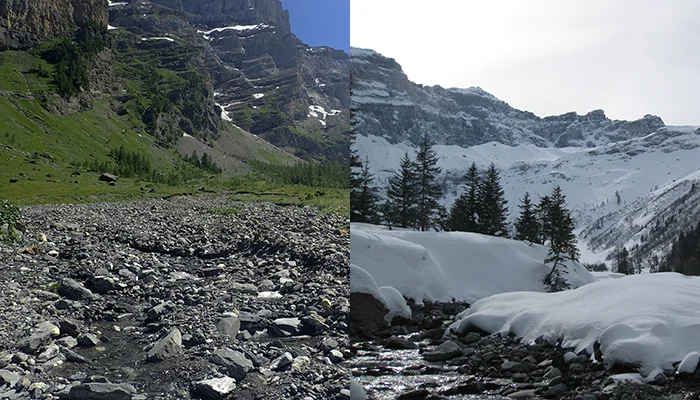
In many European rivers, low-flows occur in summer, when prolonged lack of rainfall and high evaporation reduce water availability. In northern and mountainous regions, low-flows can also occur in winter, when precipitation is stored as snow rather than feeding directly into rivers. The seasons are not necessarily independent, either. Prolonged drought can deplete soil moisture and groundwater storage, leaving less water to sustain river flows in subsequent seasons. Changes in precipitation, snow accumulation and evaporation can further influence these patterns.
Traditional low-flow frequency analysis often focuses on the (aggregated) lowest river flow recorded each year. Another common assumption, known as stationarity, is that the statistical behaviour of low flows remains unchanged over time.
But do these assumptions always hold?
Our analysis across Europe illustrates why they deserve closer attention. Some catchments show significant trends in summer and winter low flows, dependence between seasons, and evidence supporting non-stationary modelling, highlighting why a single approach may not be appropriate everywhere (Figure 1).
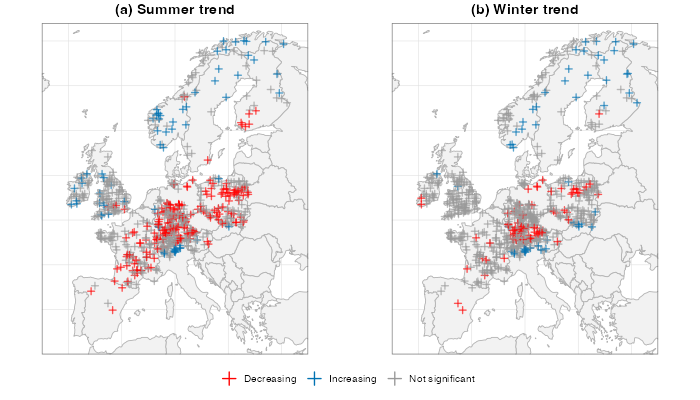
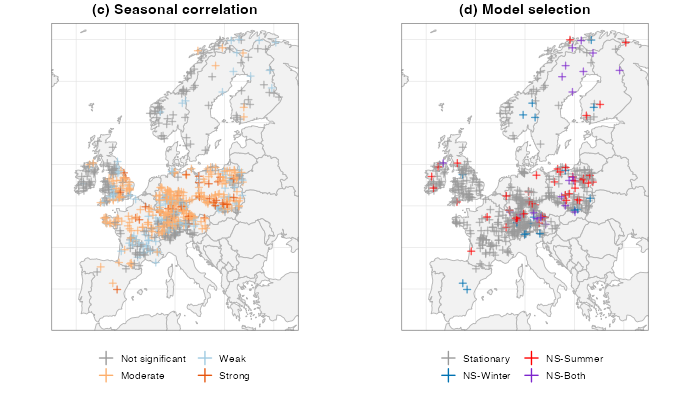
Figure 1. Spatial patterns of (a) summer and (b) winter low-flow trends, (c) dependence between seasonal low flows, and (d) model selection across European catchments. Adapted from Fitriana et al. (2026).
Bringing seasons, dependence and non-stationarity together
Earlier research introduced methods that model summer and winter low flows separately and thus considering the different seasonal processes. The single seasonal distributions are then combined in a mixture model to estimate annual extremes while accounting for inter-seasonal dependence. However, these approaches still assumed stationary conditions.
Our study extends these methods into a unified framework that allows seasonal low-flow distributions and their dependence to change over time (Figure 2). Importantly, it does not assume that every river is changing. Instead, statistical evidence helps determine when a non-stationary model is justified.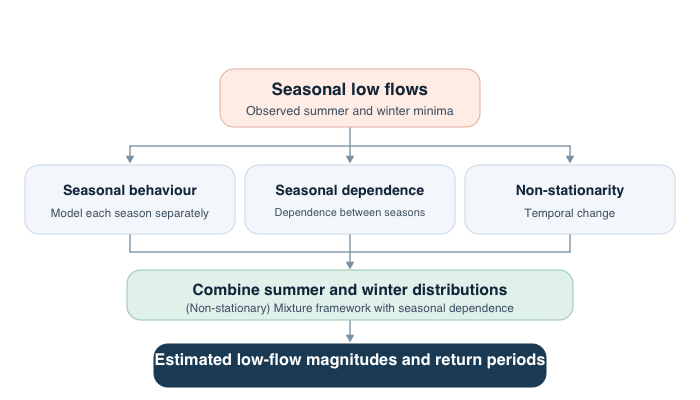
Figure 2. Overview of the proposed framework, which combines summer and winter low-flow distributions, accounts for their dependence, and allows temporal changes where supported by the observations. Simplified from Figure 2 in Fitriana et al. (2026).
What did we discover across Europe?
We analysed river-flow records from 721 largely near-natural European catchments between 1976 and 2020. We found significant trends in 36.1% of summer and 18.1% of winter low-flow series. However, when both trend evidence and statistical model comparisons were considered, non-stationary models were preferred in 12.2% and 7.7% of the respective seasonal series. So, for most catchments, stationary models remained adequate. But where non-stationarity was evident, the model choice could make a substantial difference.
For extreme events associated with a 100-year return period, stationary and non-stationary estimates differed by a median of about 29% under recent conditions in catchments with evidence of non-stationarity. Looking at historical changes within the non-stationary framework, return-period estimates for these rare events differed by approximately 42% between 1976 and 2020. These differences were also generally larger for rare events than for more frequent ones (Figure 3).
Overall, representing distinct seasonal processes had the greatest influence on frequency estimates, followed by temporal changes. Accounting for dependence between seasons further refined the estimates.
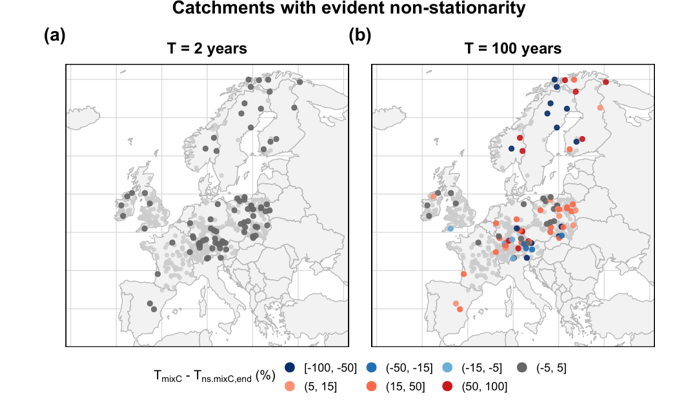
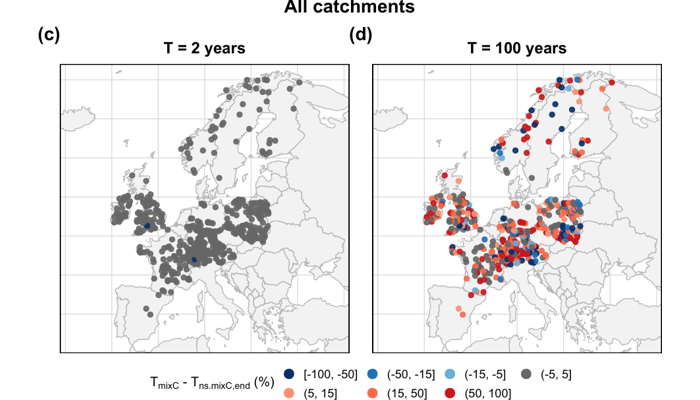
Figure 3. Differences between stationary and non-stationary return-period estimates for (a) 2-year and (b) 100-year low-flow events in European catchments with evidence of non-stationarity. Differences are generally greater for rare events. Adapted from Fitriana et al. (2026).
What should we take away?
Our findings do not suggest that every river is changing or that traditional models should be abandoned. Rather, different catchments may require different levels of model complexity. Overlooking seasonal processes or temporal changes where they matter can substantially alter how rare we estimate an extreme low-flow event to be.
For me, this highlights the importance of looking beyond the numbers and questioning the assumptions behind them. Reliable low-flow frequency analysis depends not only on having good data, but also on using models that reflect the hydrological processes and changes supported by those data.
By bringing these considerations together, we can better understand extreme low-flow behaviour and provide a more informed basis for interpreting low-flow risks under changing environmental conditions.
A note from the editorial team: This is a guest blogger contribution received following a recent innovation in the Copernicus Publishing System: upon acceptance of your paper in one of our journals, authors are invited to consider if they would like to turn their science paper into a blog post.
Read the full study, published in Hydrology and Earth System Sciences, by Farhana Sweeta Fitriana, Svenja Fischer, Gabriele Weigelhofer, Johannes Laimighofer, and Gregor Laaha (2026).