GD
Geodynamics

Subduction

FrenSZ workshop: a French interdisciplinary initiative around subduction zones.
FrenSZ workshop: a French interdisciplinary initiative around subduction zones.
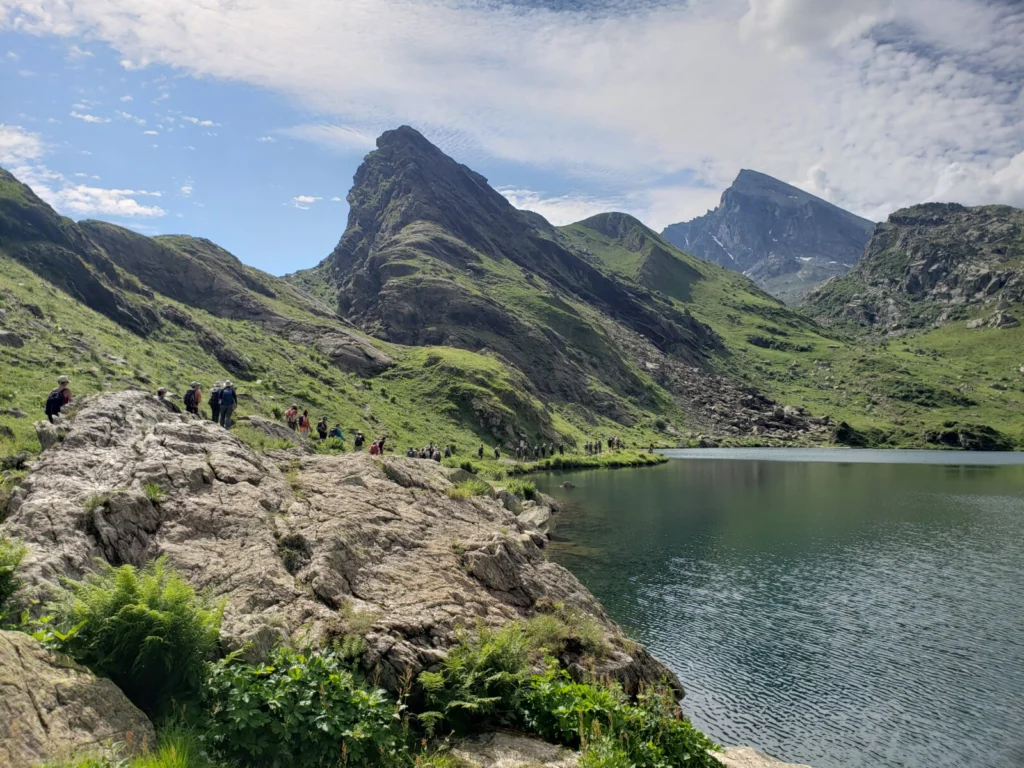
Since 2022, the annual FrenSZ workshop has been bringing together a vibrant and interdisciplinary community around subduction zones in France. In this week’s blog post, we dive into how FrenSZ is organized, highlight its scientific outcomes and how it is opening new connections on the international stage. A large French community. In France, a fairly large community of Earth Scientists devote thei ...[Read More]

What drives the extensional deformation in the central Apennines (Italy)?

What drives the extensional deformation in the central Apennines (Italy)?

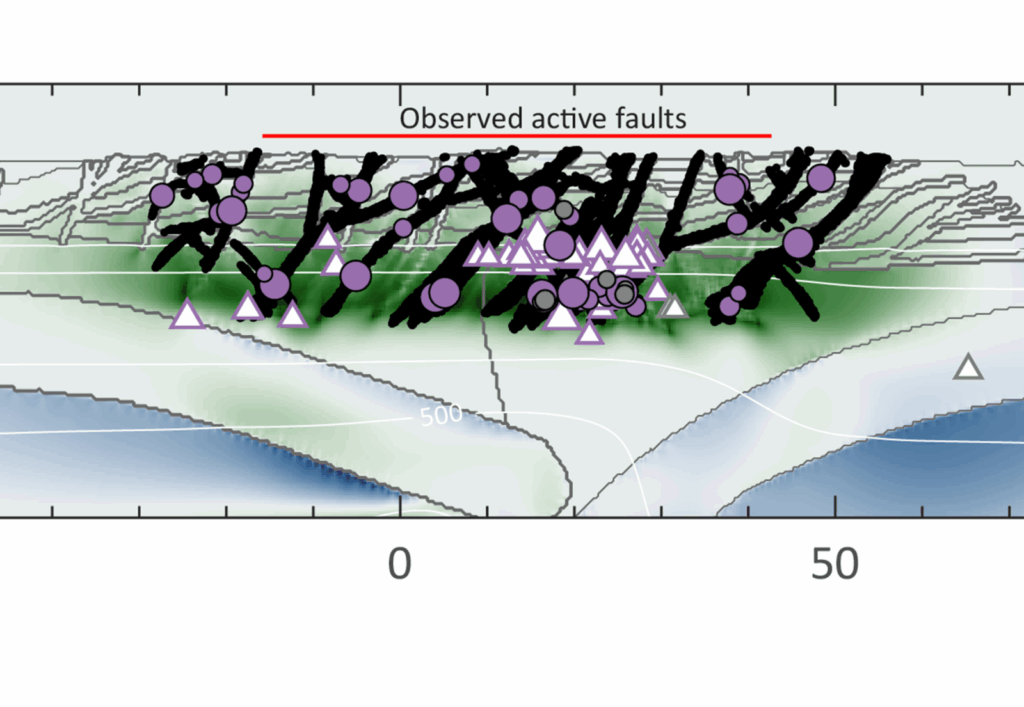
The central Mediterranean is a geodynamically complex region shaped by the interaction of multiple active subduction zones. In Italy, the central Apennines display a distinctive pattern of surface deformation that is proposed to be linked to a slab break-off beneath the area. In this week’s blog post, Maaike, a PhD student at ISTerre in Grenoble, France, explores the key processes driving surface ...[Read More]

A New Look at the Rheology of Deep Subduction Zones

A New Look at the Rheology of Deep Subduction Zones

Subduction zones are dynamic regions where intense geological processes like earthquakes, volcanic eruptions, and the recycling of oceanic crust are constantly at play. A key factor that influences the behavior of these zones is *interface rheology*—the strength and viscosity of the boundary (the interface) between the subducting and overriding plates. Understanding this interface is crucial for i ...[Read More]

H2 production associated with mantle wedge hydration in subduction zones

H2 production associated with mantle wedge hydration in subduction zones

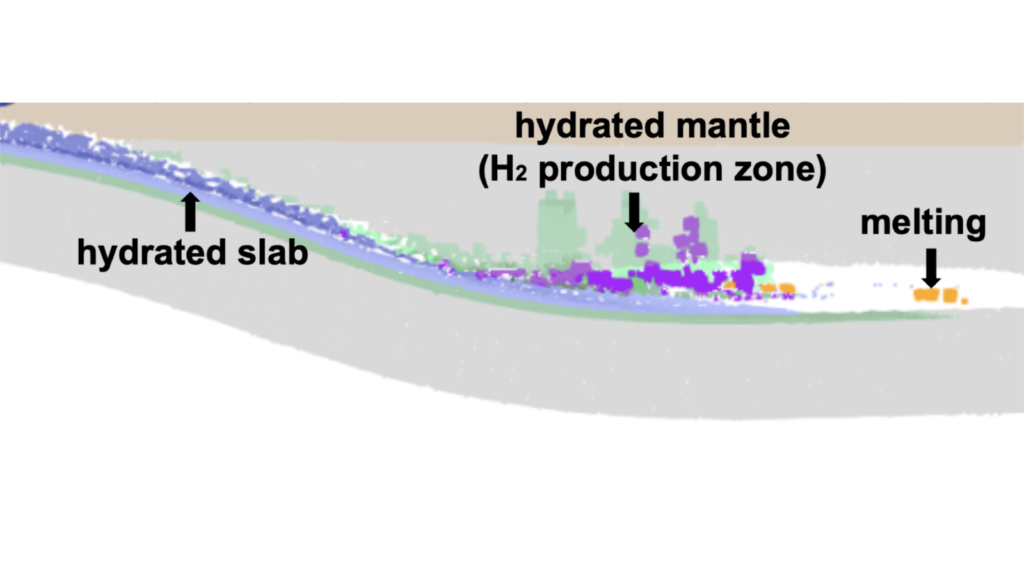
Dihydrogen (H2) is a promising source of energy that may allow reducing carbon emissions in industry and transportation. Artificial production methods have been explored, natural sources of H2 (also called white dihydrogen) offer a more eco-friendly and cost-effective production process. In this week’s blog post, Alexis Gauthier, a PhD student from ISTeP, France, is discussing the H2 production pr ...[Read More]

Multiengine-driving Tethyan evolution

Multiengine-driving Tethyan evolution

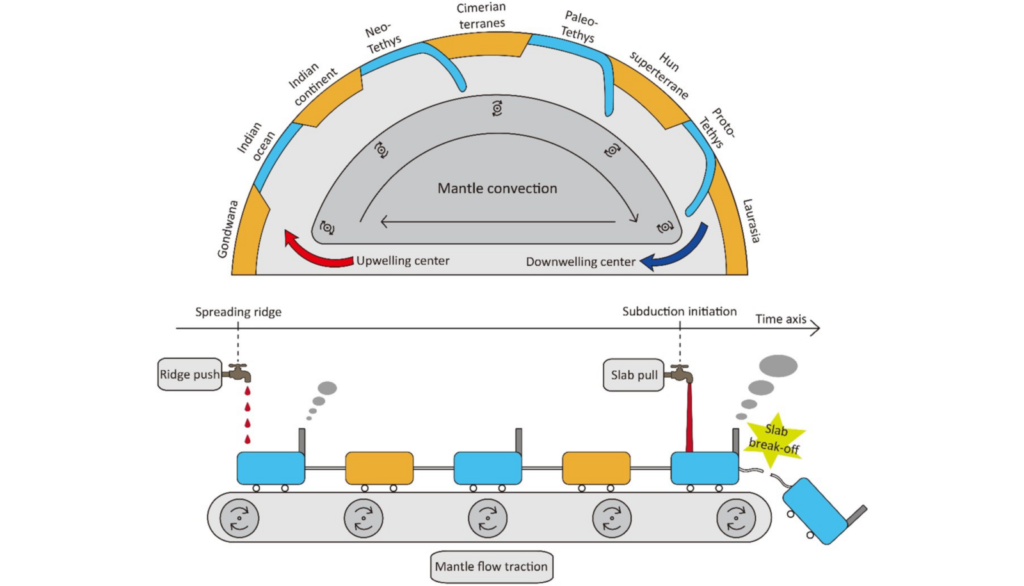
The highest mountain range in the Alps in the Western Europe, the towering peaks of the Himalayas in Asia, and ~1/3 world crude oil production in the middle east – what brings these remarkable nature gift together? The answer is Tethyan orogenic belt, which spans across the entire Eurasian continent. This week, we are privileged to have Prof. Zhong-Hai Li from the University of Chinese Academy of ...[Read More]

Geoscience in Alaska: From Fjords to Flysch

Geoscience in Alaska: From Fjords to Flysch

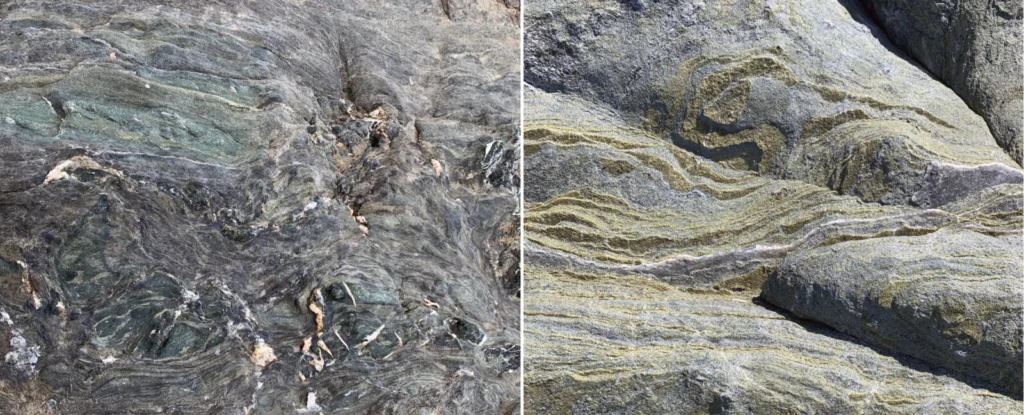
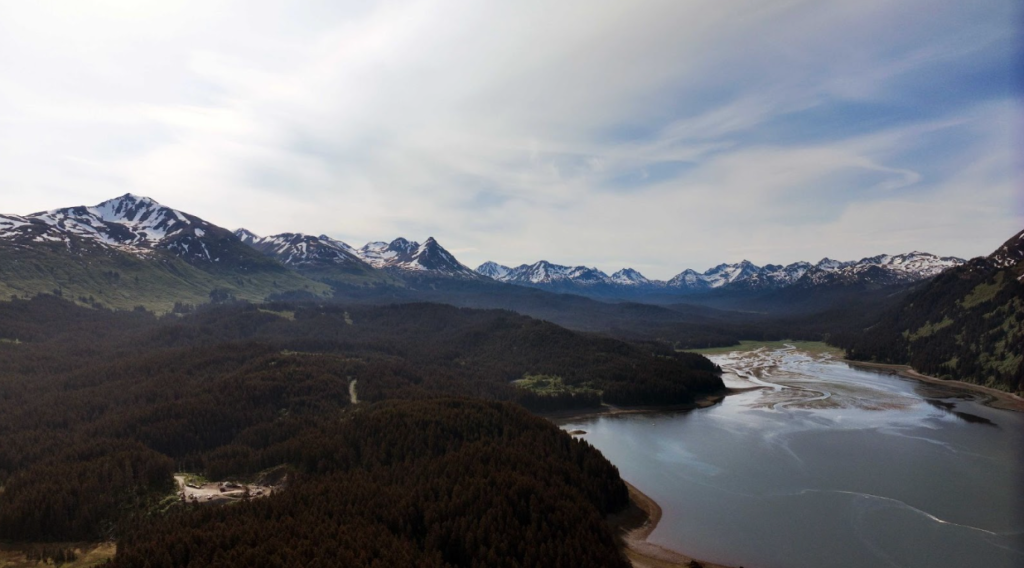
In this week’s blog post, one of our blog illustrators, Emily Hinshaw will take us on a journey to the faraway land of Alaska, which is well known for its rugged terrain, exciting wildlife, and being very remote. Despite these challenges, and many others, Emily loves this work and feels very lucky to be part of the research team which explores the geology and geodynamics of the region!  Alaska is ...[Read More]

On the usefulness of geodynamic numerical models

On the usefulness of geodynamic numerical models

Within the vast realm of geoscience, the intricate mechanisms governing Earth’s internal processes continually pose challenges for researchers attempting to unveil its mysteries. This blog post acknowledges the inherent limitations of geological and geophysical data while highlighting the important role that geodynamic modeling plays in bridging these datasets. The motivations for this discu ...[Read More]

How has the Gibraltar slab influenced the Alboran domain deformation?

How has the Gibraltar slab influenced the Alboran domain deformation?

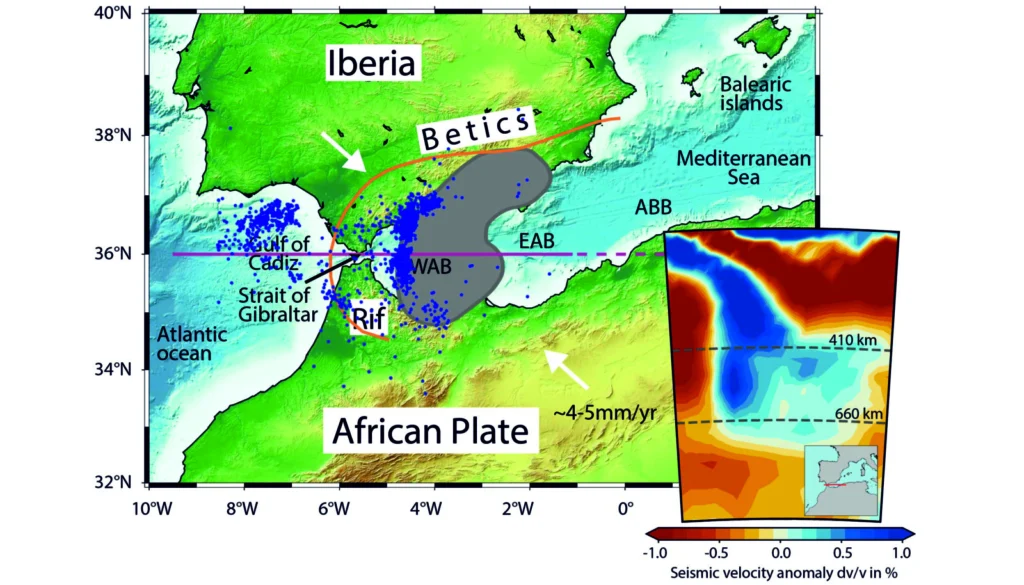
Figure 1. Topography of the Gibraltar Arc region. The shaded area indicates the position of positive seismic velocity anomaly supposedly representing the position of the slab at 270 km depth from seismic tomography (Amaru, 2007). The purple line shows the position of the modelled cross-section for the model shown in this blog. Blue dots indicate the regional intermediate seismicity (between 40 km ...[Read More]