In the previous post of this series, we learned how we can use satellite radar altimetry to retrieve highly accurate estimates of global sea level changes. If only reading “sea level” triggers your climate anxiety – we got you covered! In this post we will introduce you to three more applications of radar altimetry, where the first two are not directly connected to climate change. Instead, we will discover mountains underwater from space, and find commonalities between rubber ducks and altimetry. In the end, we show how altimetry helps to put a single number to climate change, and how creatively altimetry data is used today.
Mountains in the ocean
About 70 % of the Earth is covered with oceans. While elevations over land surfaces (topography) are well known for example from laser or radar measurements, mapping of the ocean bottom (bathymetry) is much more difficult. A common technique is to use multibeam echosounders based on ships. However, these data are sparse in space and time. It simply would be far too inefficient to try to cover the entire Earth’s ocean surface with ship tracks. So how can we use altimetry, where the radar pulse is reflected at the sea surface, to infer the bathymetry of the seabed thousands of metres below the sea surface?
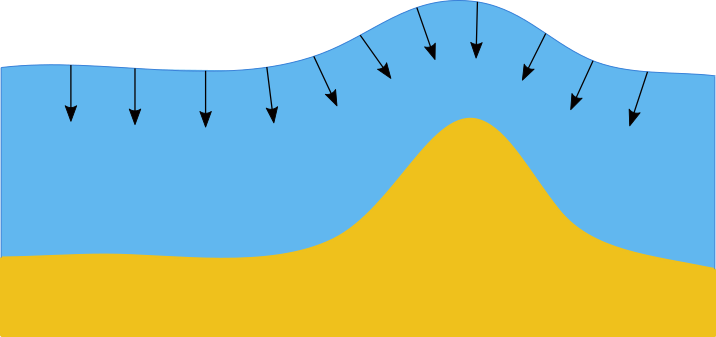
Fig. 1: Over a flat seabed, the water surface is approximately horizontal, perpendicular to the vertical vector of gravitational acceleration. A large mass, for example a seamount, deflects the vector of gravitational acceleration and causes the water surface to form a bulge. The height of the bulge in this schematic representation is exaggerated.
The idea is that the sea surface is approximately perpendicular to the vector of gravitational force. This gravitational vector does not necessarily point to the Earth’s centre but can for example be attracted by a large mass like a sea mount. As a consequence, the sea surface mirrors features of the bathymetry (Fig. 1). However, the scale of elevation change that can be observed at the sea surface is much smaller than the elevation change on the ground. That means we don’t get a very detailed picture of the global ocean’s bathymetry but thanks to altimetry we finally know at least the bigger seamounts.
Another difficulty here is that we assume that the sea surface is at rest, without any disturbing waves or currents. Such a surface would be the approximation of the geoid, an equipotential reference surface where the geopotential number is constant.
What altimetry and rubber ducks have in common
In autumn 1992, the container ship Ever Laurel entered a storm while crossing the Pacific. It lost its freight, almost 30.000 plastic toys – ducks, beavers, frogs and turtles that kept floating in the ocean. Several months and years later, they started to show up on coasts all over the world. For oceanographers, this was an exceptional opportunity: A mass deployment of drifters where the starting point and time are known is like a huge in-situ measurement of ocean surface currents. In terms of environmental ethics, it would not have been possible to intentionally put so much plastic in the ocean purely for scientific purposes.
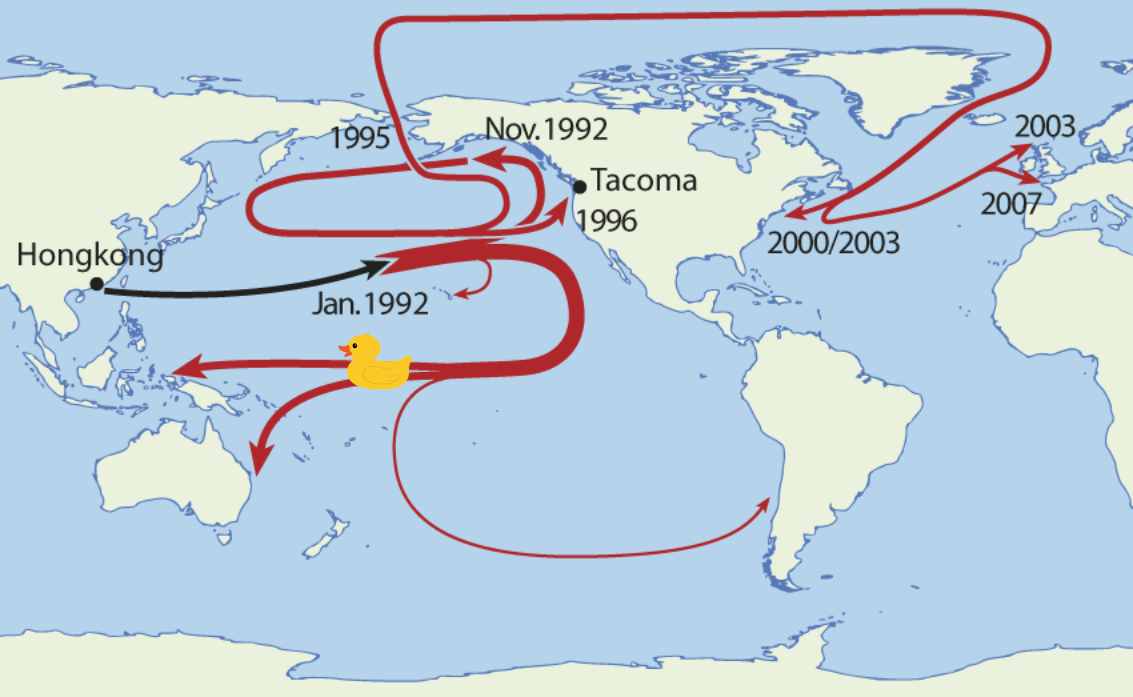
Fig. 2: Pathways of the plastic toys lost by a container ship in the Pacific in 1992. Image adapted from Wikimedia Commons.
Instead of in-situ observations, we can also use our knowledge about the sea surface topography from altimetry to infer one specific type of current. Imagine a bulge in the water’s surface: it will lead to a certain pressure gradient as it tries to push the water horizontally. But then Coriolis force steps in and deflects the path of the water flow. Together, the horizontal pressure gradient and the Coriolis force bring the water to flow along the contour lines of the sea surface topography. This type of current is called a geostrophic current and can be found in most of the larger ocean currents, such as the Gulf Stream or the Kuroshio Current.
Heat in the oceans
The greenhouse effect leads to an accumulation of excess energy in the Earth system – there is more incoming solar radiation than outgoing thermal radiation. A measure of this excess energy is the Earth energy imbalance. About 90 % of this excess energy is stored in the oceans, causing the oceans to warm. This means that changes in ocean heat content are also a pretty good measure of the entire Earth’s energy imbalance. This way, we have one number that represents the power driving climate change.
Warming oceans expand in volume, explaining one component of sea level rise, the thermosteric sea level rise. The volume of the water also changes with variations in salinity, think for example about additional fresh water from melting ice sheets. This component of sea level rise is called halosteric (“halo” is Greek for “salt”) but it is much smaller than the thermosteric component and globally negligible. The combination of thermosteric and halosteric sea levels is then simply called steric sea level.
Because of the relationship between steric sea level and ocean heat content, we can use observations of sea level change from satellite altimetry to estimate how much heat the oceans accumulated over time. However, sea level rise is not only caused by changes in the total water volume but also has a mass change component, for example from melting glaciers or ice sheets. That means we first need to subtract the influence of mass changes with the help of gravity observations in order to derive the steric sea level rise component.
The question of how to convert steric sea level changes into ocean heat content changes still needs to be finally answered. A common simplification is to use a fixed empirical conversion factor. But this is only an approximation because we know that this factor changes with parameters like pressure, salinity or temperature. Luckily, we have creative geodesists who are currently working on more sophisticated approaches so that we can get a better picture of the heat stored in the oceans.
Unlimited creativity
These three applications were only a small sample of radar altimetry use cases. Humans are incredibly creative when it comes to using technology for purposes that it was not initially meant for. Just to give you a taste: Altimetry has been used successfully to track fish swarms, oil patches, icebergs or ships. The height of the waves (to be found in the radar backscatter) tells you where to find the best spot for the next wind farm. And, while altimetry was originally designed for oceanic purposes, people are now developing ways to use it to monitor lake or reservoir volumes, river levels or wetland extents. It was even already implemented for forecasting storms and floods. What about you, can you also make use of altimetry in your research?
References

Smith, W. H. F., and D. T. Sandwell (1994), Bathymetric prediction from dense satellite altimetry and sparse shipboard bathymetry, J. Geophys. Res., 99(B11), 21803–21824, https://doi.org/10.1029/94JB00988.

Boxall, S., From rubber ducks to ocean gyres. Nature 459, 1058–1059 (2009). https://doi.org/10.1038/4591058a

J. M. Sánchez-Reales , M. I. Vigo , S. Jin & B. F. Chao (2012), Global Surface Geostrophic Ocean Currents Derived from Satellite Altimetry and GOCE Geoid, Marine Geodesy, 35:sup1, 175-189, DOI: 10.1080/01490419.2012.718696

Schuckmann, Karina von, Lijing Cheng, Matthew D. Palmer, James Hansen, Caterina Tassone, Valentin Aich, Susheel Adusumilli, et al. (2020), Heat Stored in the Earth System: Where Does the Energy Go?, Earth System Science Data 12, no. 3: 2013–41. https://doi.org/10.5194/essd-12-2013-2020.

Eldardiry, Hisham, Faisal Hossain, Margaret Srinivasan, and Vardis Tsontos (2022). Success Stories of Satellite Radar Altimeter Applications. Bulletin of the American Meteorological Society 103. https://doi.org/10.1175/BAMS-D-21-0065.1.