A remarkably large number of papers and proposals have sentences like “this study is critical to better project future sea-level rise” in their introduction. Most times this is just marketing to trick reviewers and program managers into believing the work is important. On the other hand, geodetic papers and proposals have some compelling reasons to use this statement: a lot of geodetic techniques and observations are really unmissable in understanding what is happening along our coastlines. As a sea-level scientist, my work depends a lot on these techniques. My main interest is to understand the causes of local and regional sea-level changes over the last decades and how sea level will change in the near future.
But let’s start with present-day sea level. How high is it? Thanks to satellite altimetry and gravimetry missions such as GRACE, GOCE and CHAMP, we know that the oceans are far from flat. If we subtract accurate maps of the Earth’s geoid from the mean sea surface measured by altimetry (which varies by tens of meters over the oceans!), we obtain the so-called mean dynamic topography (Fig. 1): the spatially varying height of the sea surface due to ocean dynamic processes, which we can determine with cm-level accuracy. Due to the Coriolis effect, the gradients in the mean dynamic topography are orthogonal to the ocean currents, and thus, thanks to geodesy, we can accurately map ocean currents all over the world!
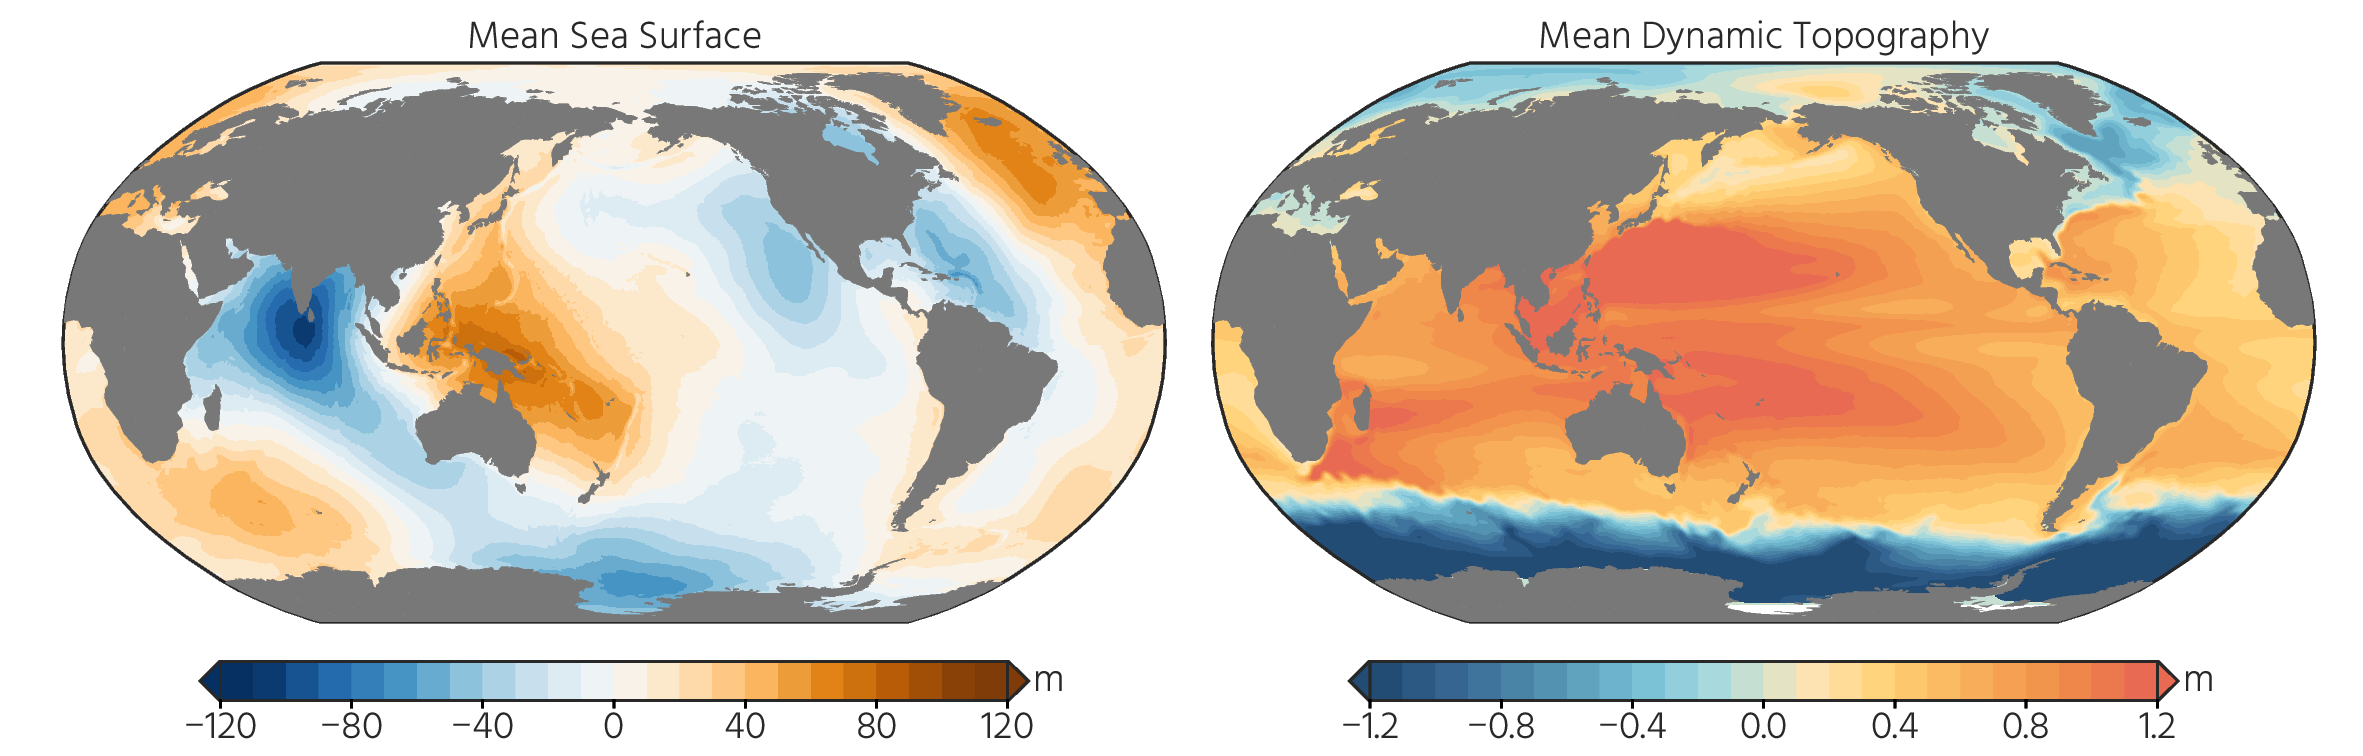
Fig. 1: Satellite altimetry reveals large bumps and through in regional sea level (left panel), relative to the ellipsoid. Thanks to accurate gravity measurements, we know that it is the geoid that explains most of these variations. When we subtract the mean geoid, we get the mean dynamic topography (MDT, right panel). The gradients in the MDT are perpendicular to the ocean currents. From the MDT we can easily identify large current systems, such as the Gulf Stream and the Antarctic Circumpolar Current. Data from the DTU21MSS and DTU22MDT products.
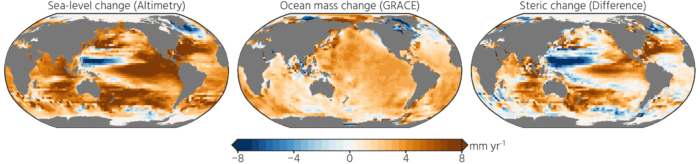
Sea levels are changing rapidly: since 1993, global sea level has risen by about 10 centimeters, and the pace is accelerating. However, regionally, there are vast deviations from this rate (Fig. 2). We need to understand the physical processes behind these spatial patterns to determine whether these large differences are just due to decadal and multi-decadal variability in sea level or whether they are part of long-term processes related to anthropogenic global warming. Again, geodesy comes to the rescue here! With GRACE and altimetry, we can separate sea-level change into an ocean mass (think of sea-level rise due to the extra water coming from melting glaciers and ice sheets, Fig. 2) and an ocean density (because the oceans become warmer the ocean water is expanding) component: the first step in finding out which processes are responsible for the regional patterns.
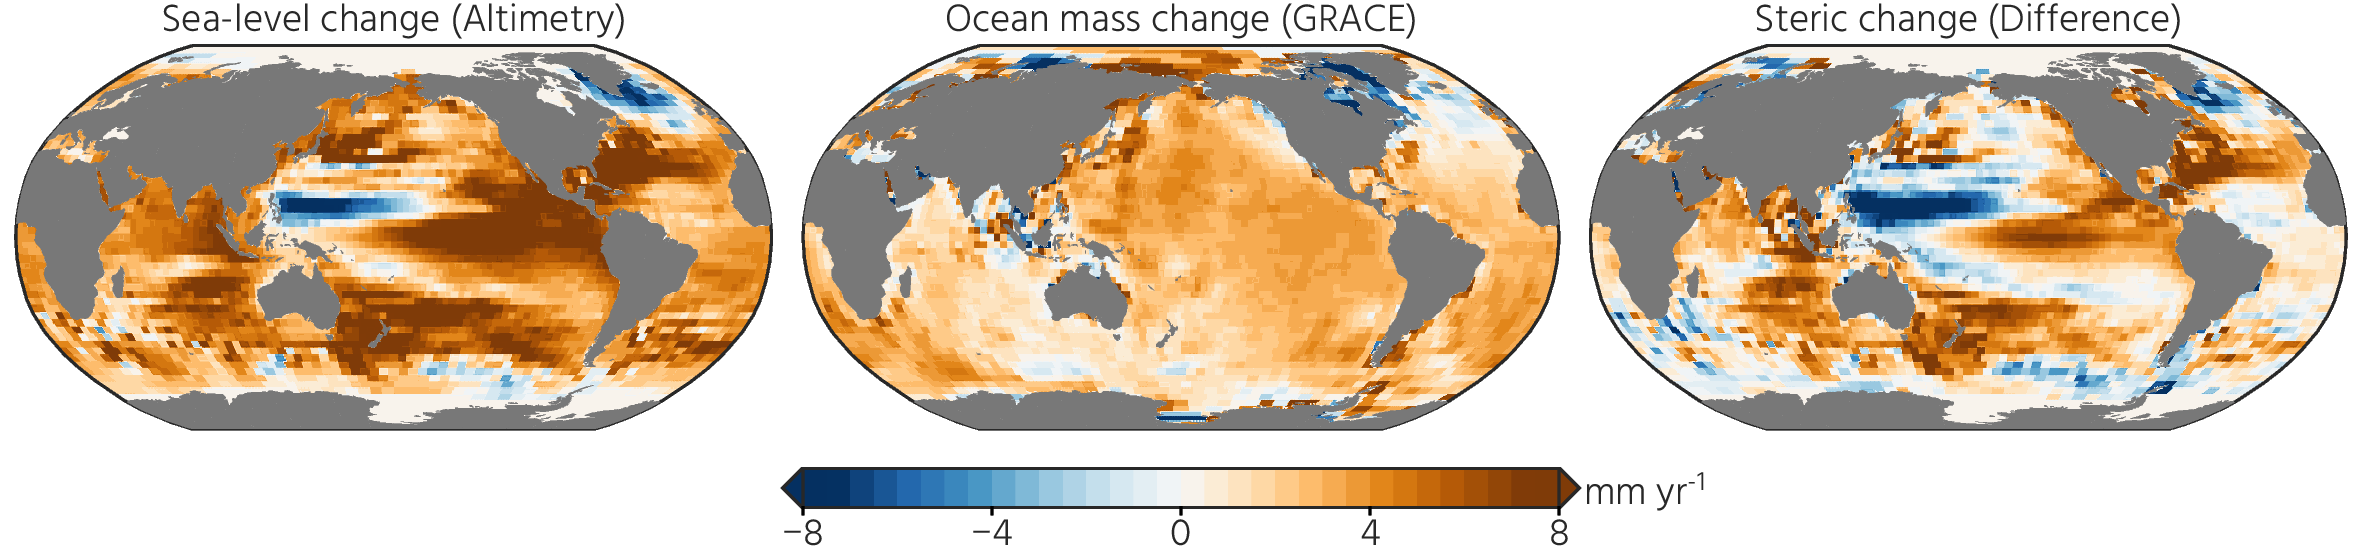
Fig. 2: Satellite altimetry and gravimetry show us the causes of contemporary sea-level changes. These panels show the trends in sea level over 2005-2019. The trends over this period vary considerably from place to place (left panel), which are to some extent caused by changes in ocean mass (middle panel), but largely due to steric changes (right panel). Data from Hakuba et al. (2021).
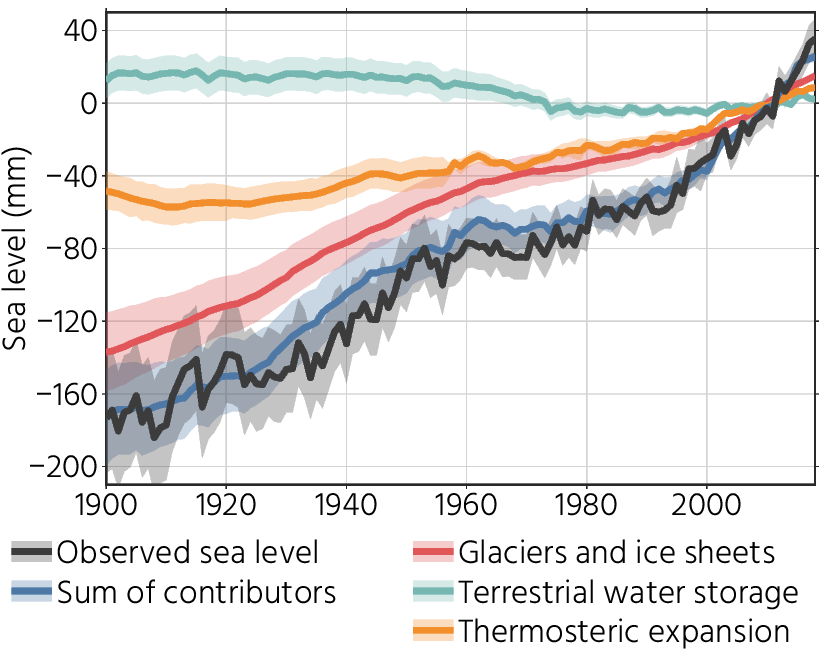
Reconstructions of 20th-century global-mean sea-level changes based on tide-gauge and GNSS data match well with what we know about how much land ice has disappeared and how much heat has been absorbed in the oceans, which causes so-called thermosteric sea-level rise. Data from Frederikse et al. (2020).
But also in the pre-satellite era, geodetic observations are key to understand sea level. For more than 300 years, local sea levels have been measured with tide gauges, and thanks to repeated levelling campaigns and geodetic benchmarks many of these long-term records are of high quality. Now, more and more tide gauges are equipped with a geodetically-tied GNSS station. With such a tie, we can now also distinguish the role of the oceans versus coastal subsidence. The latter turns out to be a major driver of local relative sea-level changes (i.e., sea-level changes relative to the underlying sea floor) along many heavily-populated coastlines. Tide gauges combined with GNSS stations are our primary source of information on global-mean sea-level changes during the 20th century. Together with estimates of glacier and ice mass loss, changes in liquid water storage on land, and global ocean heat uptake and associated steric expansion (Fig. 3), we now have a consistent estimate of 20th-century sea-level rise and the physical processes that have caused this rise.
In conclusion, we use a lot of geodetic techniques in sea-level research, and geodesy helps us to understand the physics behind local and global sea-level rise. And above all, understanding the physics is critical to better project future sea-level rise!