In our blog, we have written a lot about Arctic sea ice (see this post, this post and this post for recent examples). Much less has been written about Antarctic sea ice, i.e. its southern counterpart. That is not surprising as Arctic sea ice has experienced major losses since the late 1970s (beginning of satellite observations), while not much had happened to Antarctic sea ice (despite a small exp ...[Read More]
An exceptional year: What’s up with Antarctic sea ice?
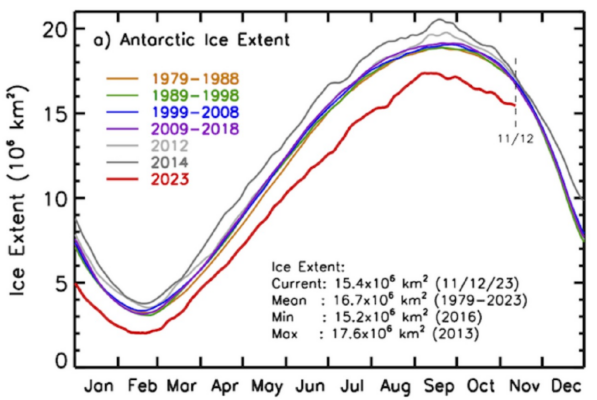
Figure 1: Daily cycle of the Antarctic sea-ice extent (in million km²) for each 10-year period between 1979 and 2018 (10-year averages) and for 3 separate years, including 2023 (red curve). Snapshot of 12 November 2023 [Credit: NASA., Comiso et al., “Current State of Sea Ice Cover”, see: https://earth.gsfc.nasa.gov/cryo/data/current-state-sea-ice-cover].