Changes in the ice shelves surrounding the Antarctic continent are responsible for most of its current contribution to sea-level rise. Although they are already afloat and do not contribute to sea level directly, ice shelves play a key role through the buttressing effect. But which ice shelf regions are most important for this? The role of ice-shelf buttressing In architecture, the term “buttress” ...[Read More]
Image of the Week — Cavity leads to complexity
A 10km-long, 4-km-wide and 350m-high cavity has recently been discovered under one of the fastest-flowing glaciers in Antarctica using different airborne and satellite techniques (see this press release and this study). This enormous cavity previously contained 14 billion tons of ice and formed between 2011 and 2016. This indicates that the bottom of the big glaciers on Earth can melt faster tha ...[Read More]
Image of the Week – Delaying the flood with glacial geoengineering
As the climate is currently warming, many countries and cities are preparing to cope with one of its major impacts, namely sea-level rise. Up to now, the mitigation of climate change has mainly focused on the reduction of greenhouse gas emissions. Large-scale geoengineering has also been proposed to remove carbon from the atmosphere or inject aerosols into the stratosphere to limit the rise in tem ...[Read More]
Image of the Week – Greenland’s fjords: critical zones for mixing
One of the most challenging research questions to address in the Arctic is how freshwater discharge from Greenland’s largest glaciers affects the biogeochemistry of the ocean. Just getting close to the calving fronts of these large marine-terminating glaciers is difficult. Fjords, hundreds of kilometers long and full of icebergs which shift with the wind and roll as they melt, make the commute a l ...[Read More]
Image of the Week – Oh Sheet!

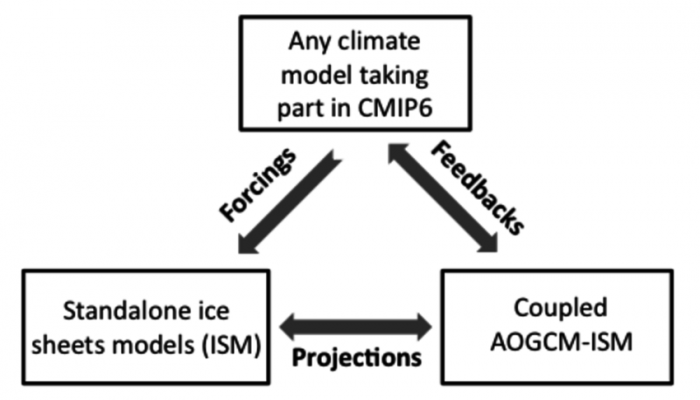
The Antarctic and Greenland ice sheets are major players in future sea level rise. Still, there is a lot about these ice sheets we do not understand. Under the umbrella of the World Climate Research Programme, the international scientific community is coming together to improve ice sheet modelling efforts to better grasp the implications of climate change for ice sheet evolution, and consequently, ...[Read More]
Image of the Week – The future of Antarctic ice shelves
Climate change will increase ice shelf melting around Antarctica. That’s the not-very-surprising conclusion of a recent modelling study, resulting from a collaboration between Australian and German researchers. Here’s the less intuitive result: much of the projected melting is actually linked to a decrease in sea ice formation. Learn why in our Image of the Week… Different types ...[Read More]
Image of the Week – Climate feedbacks demystified in polar regions
Over the recent decades, the Arctic has warmed twice as fast as the whole globe. This stronger warming, called “Arctic Amplification“, especially occurs in the Arctic because ice, ocean and atmosphere interact strongly, sometimes amplifying the warming, sometimes reducing it. These interactions are called “feedbacks” and are illustrated in our Image of the Week. Let’s ...[Read More]
Image of the Week — Quantifying Antarctica’s ice loss
It is this time of the year, where any news outlet is full of tips on how to lose weight rapidly to become beach-body ready. According to the media avalanche following the publication of the ice sheet mass balance inter-comparison exercise (IMBIE) team’s Nature paper, Antarctica is the biggest loser out there. In this Image of the Week, we explain how the international team managed to weight Anta ...[Read More]
Image of the Week — Seasonal and regional considerations for Arctic sea ice changes
The Arctic sea ice is disappearing. There is no debate anymore. The problem is, we have so far been unable to model this disappearance correctly. And without correct simulations, we cannot project when the Arctic will become ice free. In this blog post, we explain why we want to know this in the first place, and present a fresh early-online release paper by Ingrid Onarheim and colleagues in Bergen ...[Read More]
Image of the Week – ROVing in the deep…
Robotics has revolutionised ocean observation, allowing for regular high resolution measurements even in remote locations or harsh conditions. But the ice-covered regions remain undersampled, especially the ice-ocean interface, as it is still too risky and complex to pilot instruments in this area. This is why it is exactly the area of interest of the paper from which our Image of the week is take ...[Read More]

