From 1984 to 2015, approximately 71,000 Olympic size swimming pools worth of water were released from the melting Khumbu Glacier in Nepal, which is home to Everest Basecamp. Find out how Himalayan glaciers are changing and the implications for downstream communities in this Image of the Week. Himalayan glaciers supply freshwater Himalayan glaciers supply meltwater for ~800 million people, includin ...[Read More]
Image of the Week – Ice lollies falling from the sky
You have more than probably eaten many lollipops as a kid (and you might still enjoy them). The good thing is that you do not necessarily need to go to the candy shop to get them but you can simply wait for them to fall from the sky and eat them for free. Disclaimer: this kind of lollies might be slightly different from what you expect… Are lollies really falling from the sky? Eight years ag ...[Read More]
Image of the Week – How geometry limits thinning in the interior of the Greenland Ice Sheet
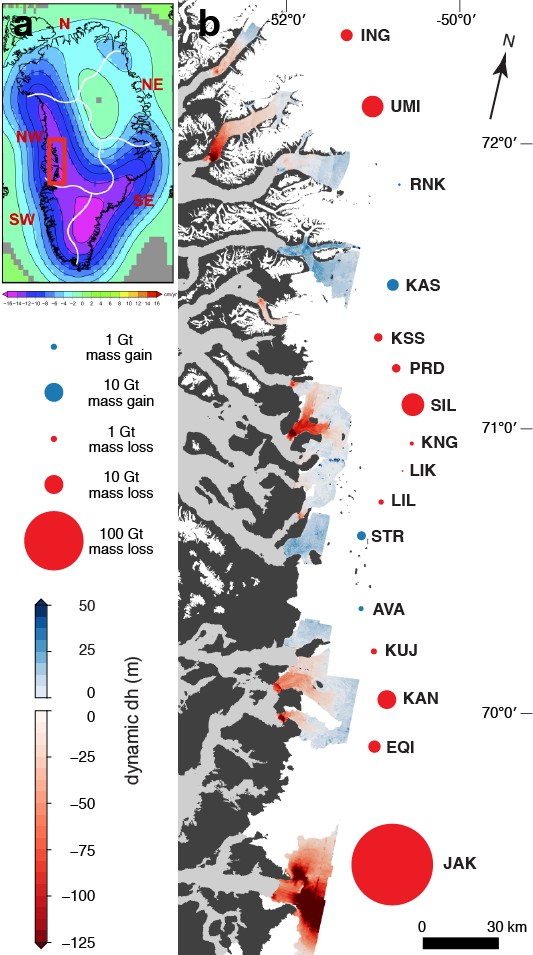
Figure 1: (a) Mass change of the Greenland ice sheet measured by NASA’s GRACE mission in cm/yr water equivalent from January 2003 to December 2013 [Credit: modified from Velicogna et al., 2014]. (b) Dynamic surface elevation change and mass loss along the margin of West Greenland as measured by DEM differencing. The map shows surface elevation change from 1985 to present for 16 outlet glaciers. Circles represent mass change (estimated using 917 kg m-3 as ice density) with circle areas proportional to magnitude of mass change. [Credit: Denis Felikson]
The Greenland ice sheet flows from the interior out to the margins, forming fast flowing, channelized rivers of ice that end in fjords along the coast. Glaciologists call these “outlet glaciers” and a large portion of the mass loss from the Greenland ice sheet is occurring because of changes to these glaciers. The end of the glacier that sits in the fjord is exposed to warm ocean water that can me ...[Read More]
Image of the Week – Antarctica’s Flowing Ice, Year by Year
Today’s Image of the Week shows annual ice flow velocity mosaics at 1km resolution from 2005 to 2016 for the Antarctic ice sheet. These mosaics, along with similar data for Greenland (see Fig.2), were published by Mouginot et al, (2017) last month as part of NASA’s MEaSUREs (Making Earth System Data Records for Use in Research Environments) program. How were these images constructed? The mosaics s ...[Read More]
Image of the Week – A high-resolution picture of Greenland’s surface mass balance
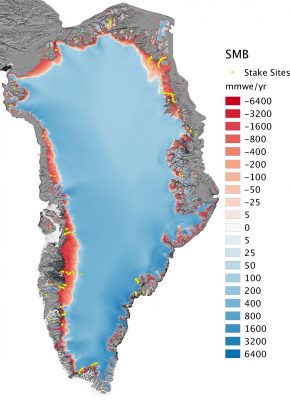
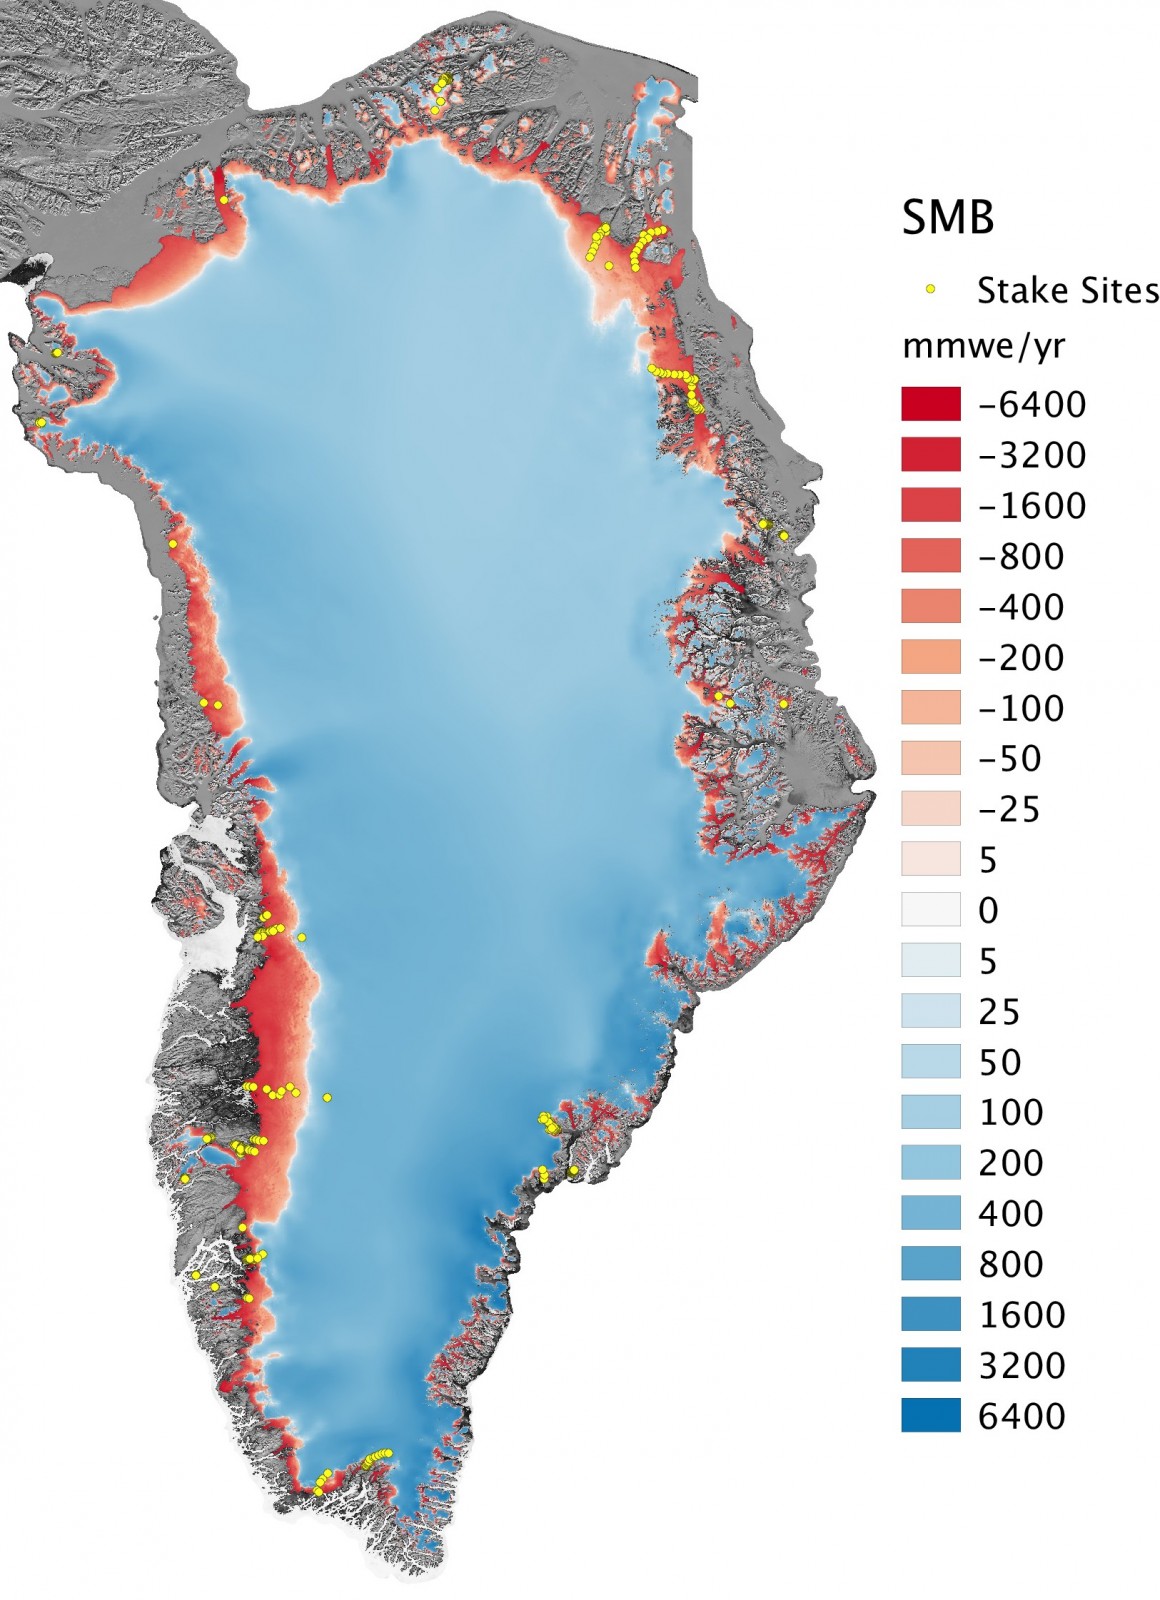
Fig. 1: Surface mass balance (SMB) of the Greenland ice sheet and peripheral ice caps at 1 km resolution averaged for 1958-2015. The interior of the ice sheet (blue) accumulates mass from snowfall whereas the narrow margins (red) lose mass from runoff of meltwater. Yellow dots locate on-site measurements. At this resolution, the small ice caps and marginal glaciers are accurately resolved [Credit: Brice Noël]. Click here here to enlarge the image.
The Greenland ice sheet – the world’s second largest ice mass – stores about one tenth of the Earth’s freshwater. If totally melted, this would rise global sea level by 7.4 m, affecting low-lying regions worldwide. Since the 1990s, the warmer atmosphere and ocean have increased the melt at the surface of the Greenland ice sheet, accelerating the ice loss through increased runoff of meltwater and i ...[Read More]
A year at the South Pole – an interview with Tim Ager, Research Scientist
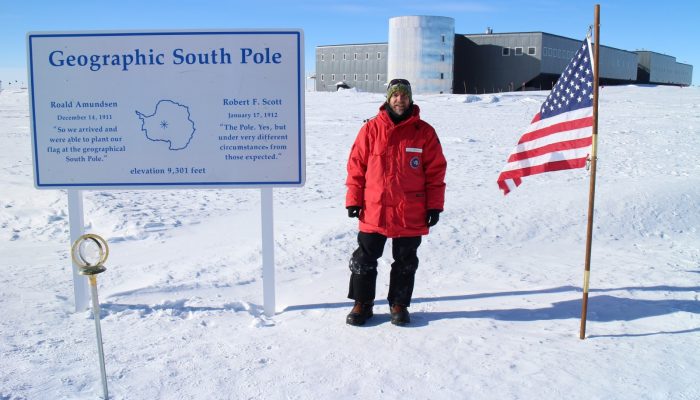
Tim Ager spent over a year working as a research scientist at Amundsen-Scott South Pole Station
What is it like to live at the South Pole for a year? A mechanical engineer by trade, Tim Ager, jumped at the opportunity to work for a year as a research scientist at Amundsen-Scott South Pole Station. When not traveling on various adventures he lives in Austin, Texas, and recently took the time to answer a few questions about his time at Pole. What goes on at Amundsen-Scott South Pole Station? ...[Read More]
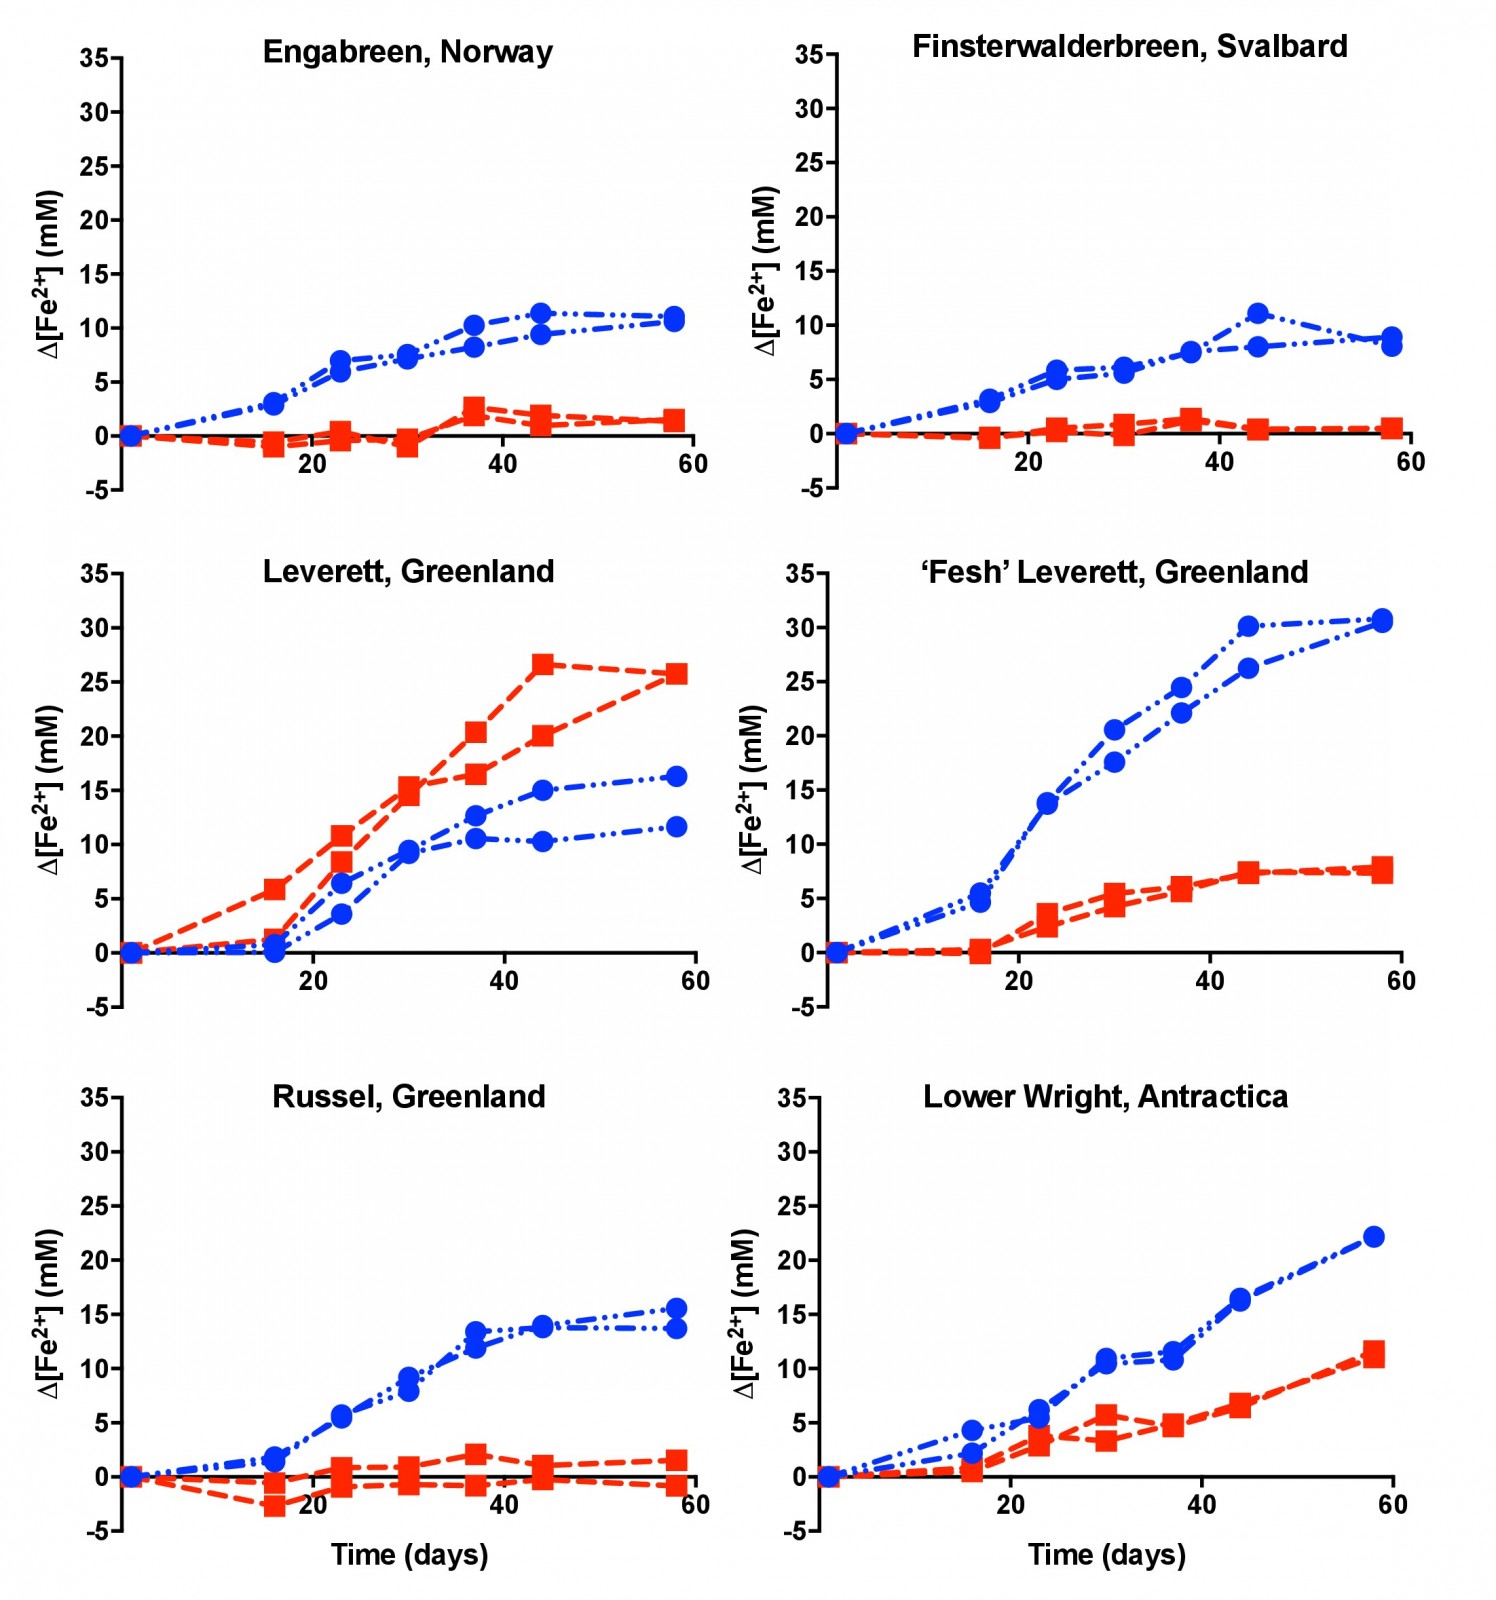
Image of the Week — Microbes munch on iron beneath glaciers
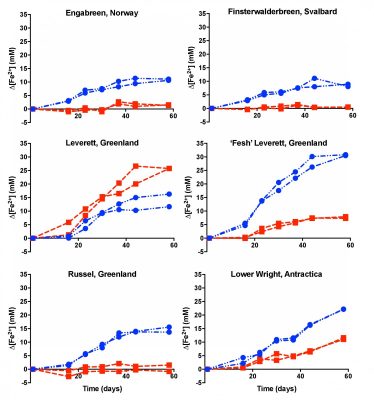
Experiment showing that microbes in subglacial sediment reduce more iron when it's colder (blue lines, i.e. 4°C ) than when it's warmer (red lines, 15°C.) [Credit: adapted from Nixon et al, (2017) Fig.1]
Click here here to enlarge the image.
The interface between a glacier and its underlying bedrock is known as the subglacial zone. Here lie subglacial sediments, the product of mechanical crushing of the rock by the glacial ice. Despite their lack of sunlight, nutrients and oxygen, subglacial sediments host active and diverse communities of microorganisms. What we (don’t) know about subglacial microorganisms The past few decades ...[Read More]
Image of The Week – Ice Flows!
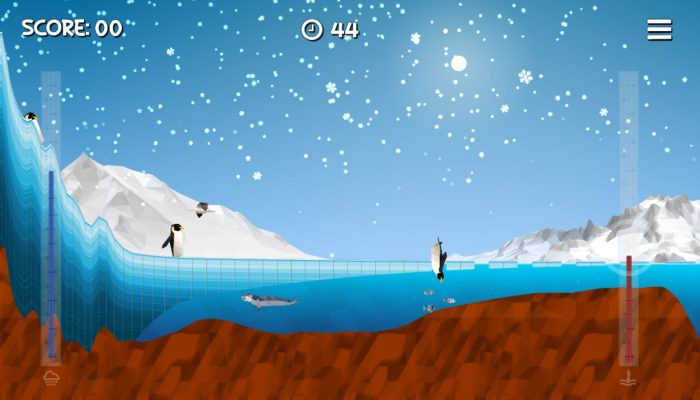
By changing factors such as snowfall and temperature players can alter the ice flow and make sure that icebergs starts to form just where the penguins want to dive down and catch fish, but get it wrong and there’s a seal waiting! [Credit: Still image from the Ice Flows game]
Portraying ice sheets and shelves to the general public can be tricky. They are in remote locations, meaning the majority of people will never have seen them. They also change over timescales that are often hard to represent without showing dramatic images of more unusual events such as the collapse of the Larsen B Ice Shelf. However, an app launched in the summer at the SCAR (Scientific Committe ...[Read More]
Quantarctica: Mapping Antarctica has never been so easy!
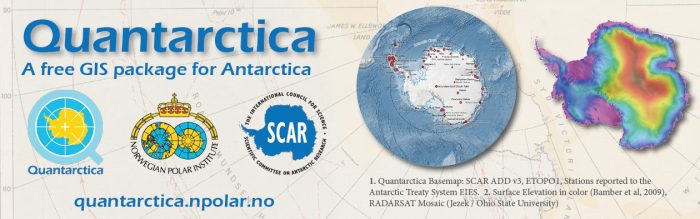
One of the most time-consuming and stressful parts of any Antarctic research project is simply making a map. Whether it’s plotting your own data points, lines, or images; making the perfect “Figure 1” for your next paper, or replying to a collaborator who says “Just show me a map!,” it seems that quick and effective map-making is a skill that we take for granted. However, finding good map data and ...[Read More]
Image of the Week – Icelandic glaciers monitored from space!
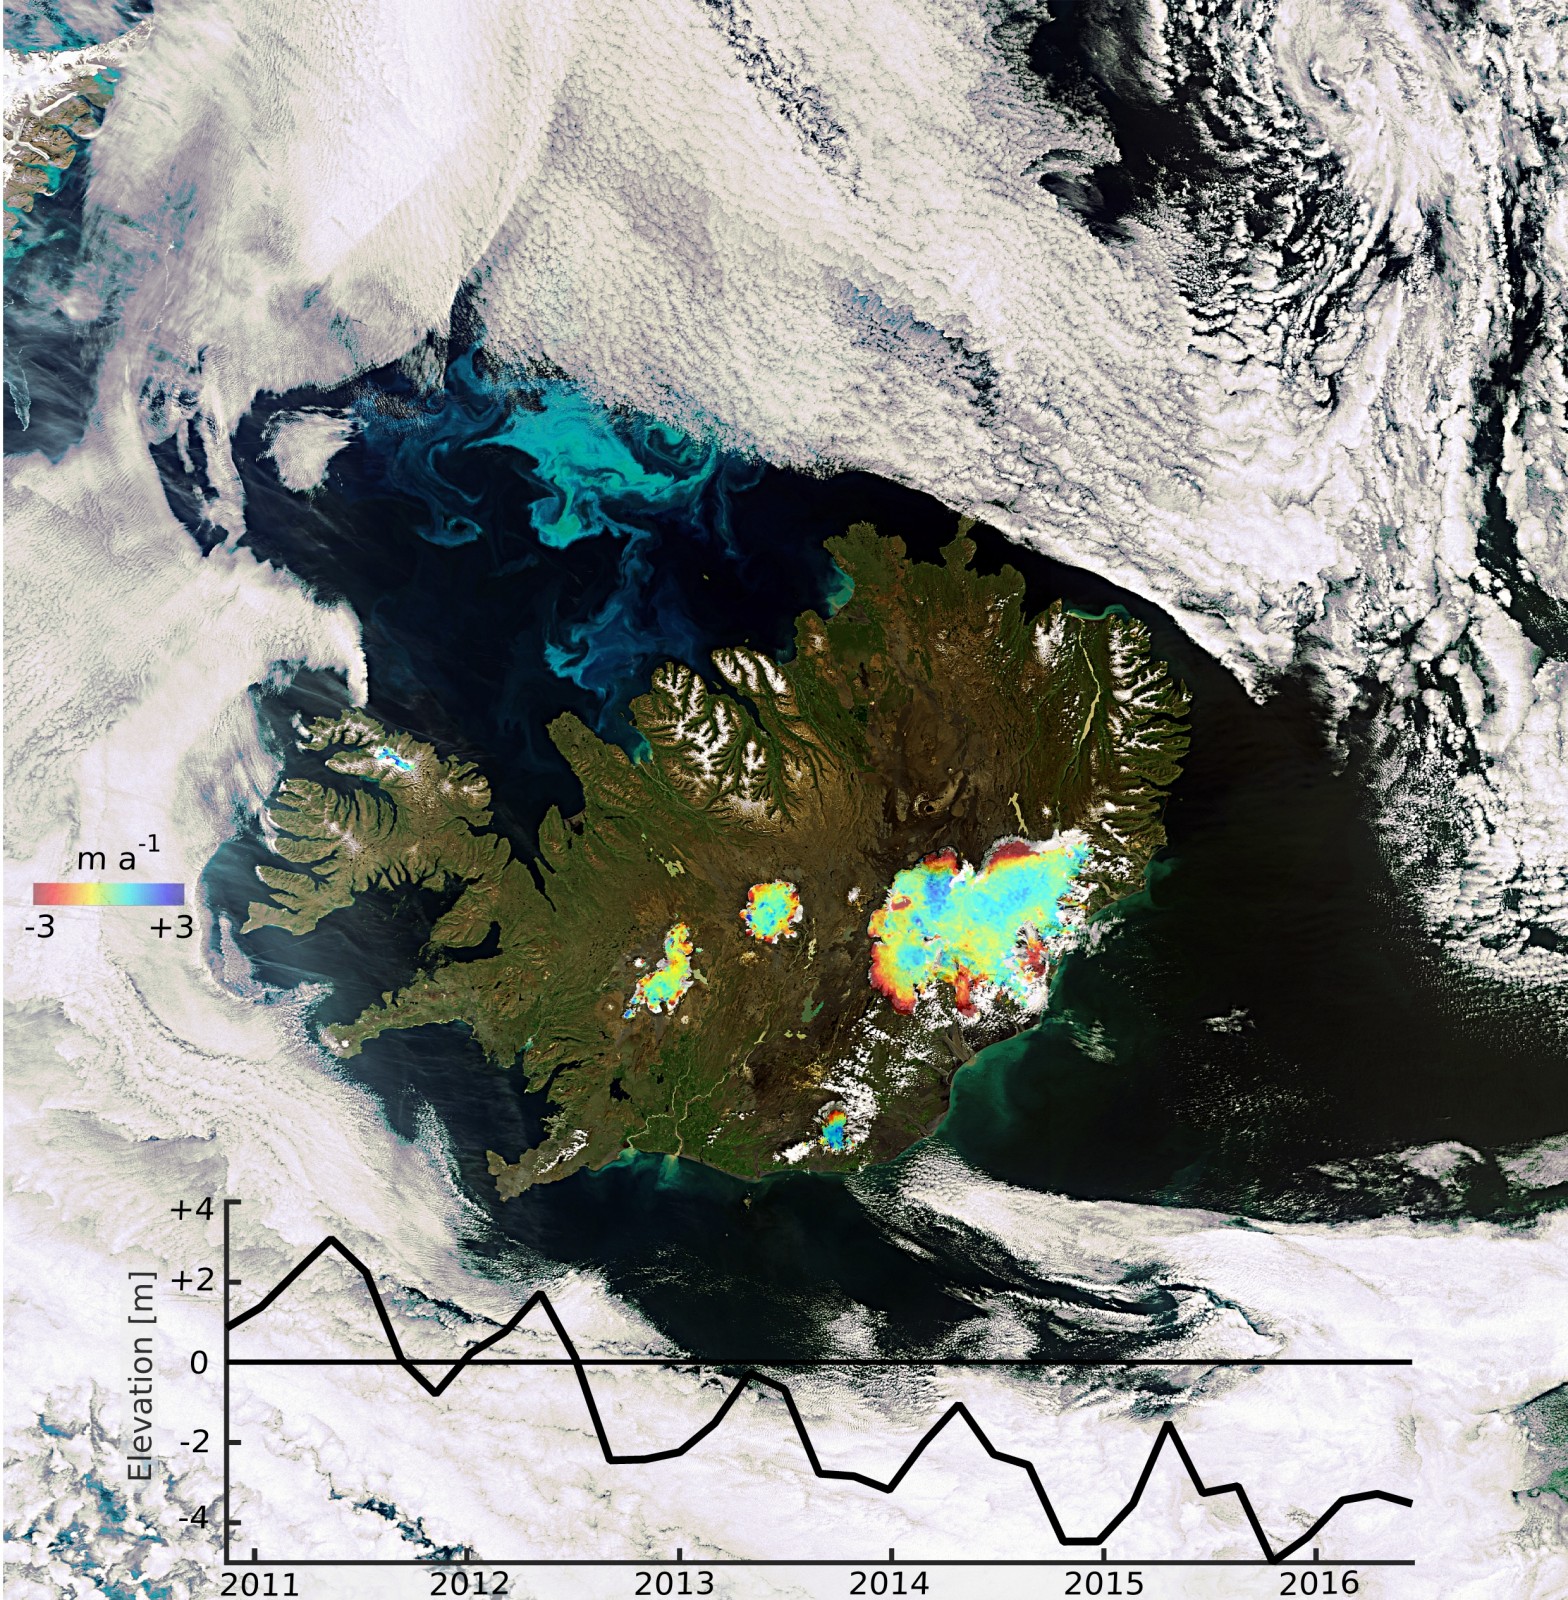
Figure 1: Exceptionally cloud free view of Iceland taken from ESA Envisat on 21, July 2010. Rates of surface elevation change between 2010-2015 derived from ESA CryoSat-2 swath-processed elevations are overlaid over the six largest ice caps. The time series shows thinning below 1200 m elevation over Vatnajökull, the largest ice cap in Iceland and Europe (by volume) -see Foresta et al. (2016) [Credit: L. Foresta and Dr. N. Gourmelen, University of Edinburgh, School of GeoSciences]
Located in the North Atlantic Ocean, just south of the polar circle, Iceland is a highly fascinating land. Covered by some of the largest glaciers in Europe and hosting active volcanoes, geothermal sites and subglacial lakes, it is extremely dynamic in nature and ever changing. With this Image of the Week we will tell you a bit about the changing ice caps of Iceland and how we can monitor them fro ...[Read More]