> Reflections from an ongoing art-science research project Common Grounds <
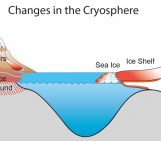
How to visualize thousands of thousands (> 20,000,000) of data points collected in the Arctic atmosphere and subsurface at a permafrost observatory over 25 years? How to tell the story of permafrost, ground that is permanently frozen and an important part of the cryosphere, that is currently warming and thawing at an unprecedented rate? Can we explore the history of these changes beyond the ongoing analysis and visualization pattern? How can a non-occular approach explore physical processes and communicate climate change through multisensorial perspectives? Imagine you encounter a polyphonic ‘choir’ of singing sensors… Thanks to a multi-channel, sound-light installation we sonified twenty years of measurements from our dataset gathered at the heart of the Arctic. This forms a polyphonic ‘choir’ that compresses these twenty years into a single hour loop. Let us explain to you how our project Common Ground merges an environmental soundscape and a guiding voice to take you at the edge of science and arts.
What happens when long term permafrost data is interpreted by artists?
Climate change is one of the most important issues of our time, yet people find it hard to talk about. The subject is so complex and multifaceted that it often causes emotional denial and aggression –– wearing people down. By focusing on data from the Arctic, I wanted to offer new ways of understanding how the climate is changing there and explore a different method of science communication: sonification of data (check these previous blog posts with related approaches in cryoseismology and hydrology).
Conveying the intense changes of the arctic permafrost landscapes (which includes the destabilization, lowering, slumping and erosion of the ground due to thawing of formerly frozen material) through data visualization can be challenging: graphics are often very dense, their format is not attractive and they are often simply overwhelming. The images can tell a very compelling story; they are often visualized as elements of slumping and erosion. Permafrost, defined by all-year-round negative ground temperatures and a cryospheric subsurface phenomenon (for at least two years), cannot be observed directly by surface imagery. Through my ongoing work at several Arctic sites in Svalbard, Siberia and North West Territories, Canada, I am collecting subsurface permafrost and atmospheric data at high temporal resolution, ranging from Hz to hours for more than 20 years. The typical visual representations of these data and the trends they portray are of course useful in many cases, but I felt a growing need to include the temporal aspect of the data. To go beyond the eyes to engage with it differently – to listen to it.
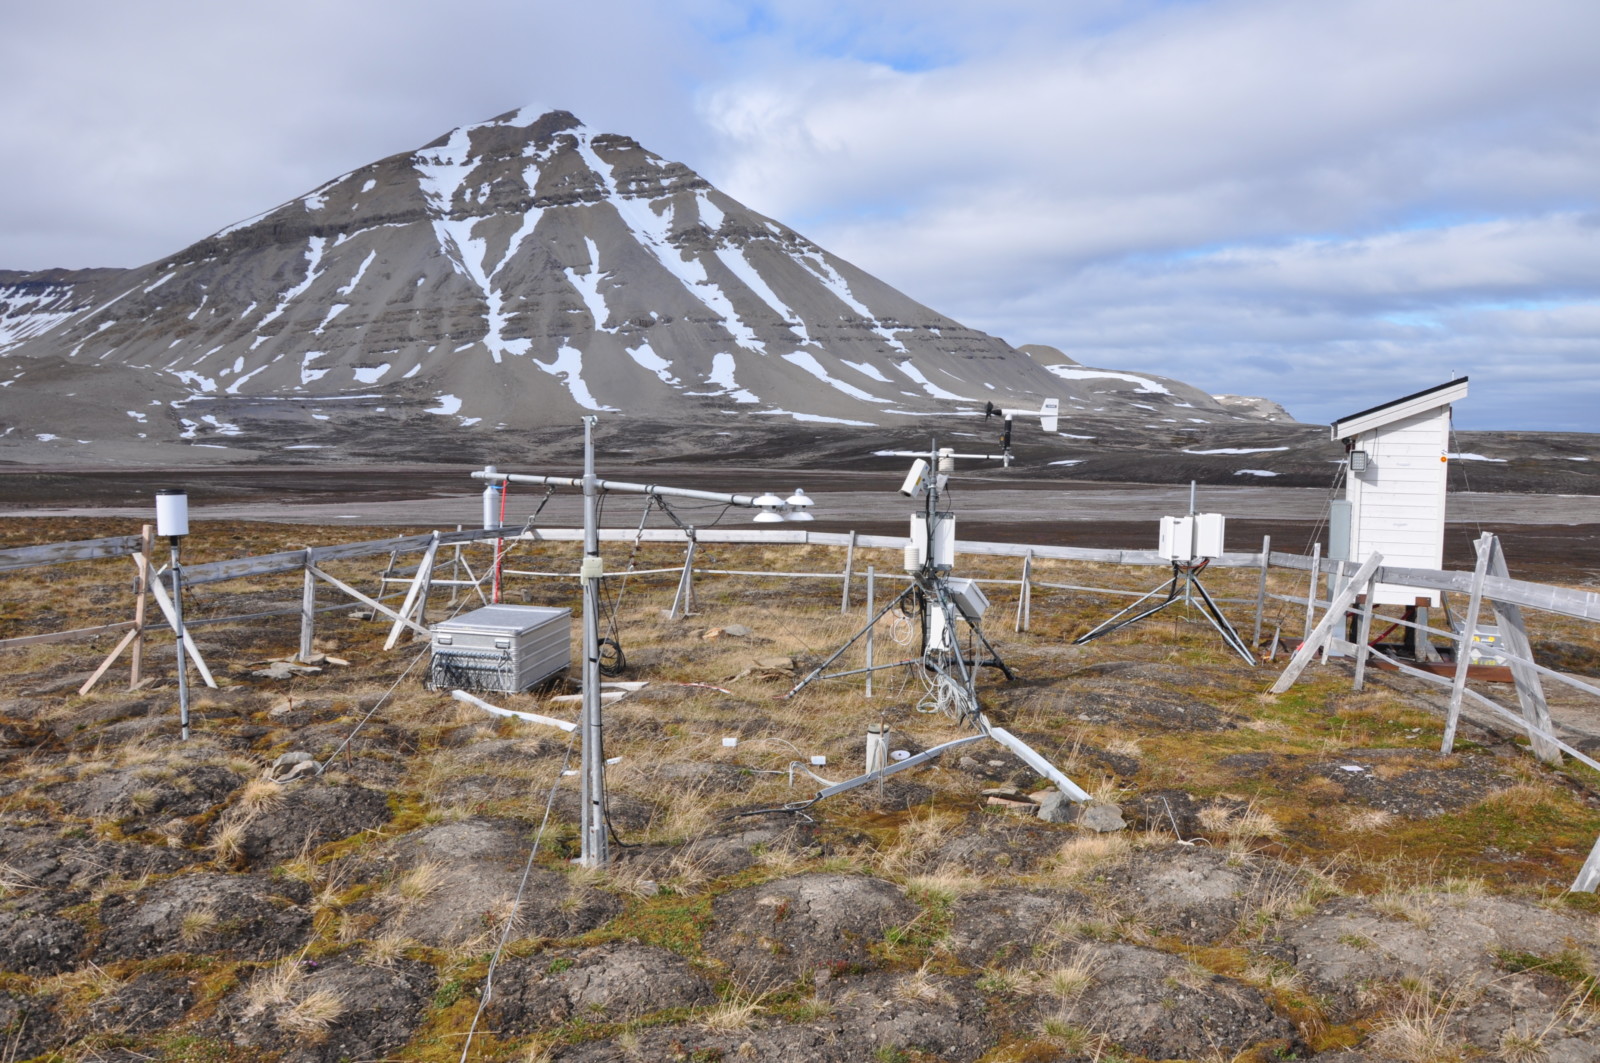
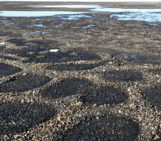
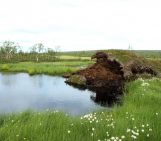
The Bayelva site (Svalbard, Ny-Alesund) during summer (July 2017). The surface is characterized by typical permafrost patterned ground, indicating freeze thaw processes. Picture by Niko Bornemann (AWI).
A warming Arctic
The Arctic has warmed almost four times faster than the globe since 1979 (Rantanen et al., 2022) and thus Arctic terrestrial landscapes are changing rapidly. Annual mean Arctic surface air temperatures over western Svalbard have increased by nearly 1.0 °C per decade (since 1981), but trends up to 2.0°C per decade were recorded for the Northern Barents Sea region (Isaksen et al., 2022). Ongoing observations by my research group’s point to prolonged changes across key and connected features of the Arctic land surface, such as permafrost warming, snow cover changes and vegetation changes. Although we may seem remote, we humans are directly linked to the changing Arctic environment through the regional and global teleconnections of the atmosphere, geosphere, biosphere and oceans.
So I was struck with the thought: how could I get the message of long-term data of permafrost changes ‘under the skin’ to the general public? To people who are not initiated at looking at graphs? A chance meeting with Kerstin Ergenzinger, artist, at a party quickly led to an enthusiastic discussion and the idea of collaborating on this topic. Our ongoing collaborative research project Common Grounds with the core three-person team (Kerstin Ergenzinger, Bnaya Halperin-Kaddari and myself), together with a group of AWI (Alfred Wegener Institute) data scientists and Tobias Grewenig, began to gather ideas and strategies on how to approach this transdisciplinary task.
Together we turned the data into sound (section “Turning to sound”), overcoming the difficulties that combining art and science brings along (section “Art-science encounters”) to achieve our common grounds (section “Corresponding with sites”).
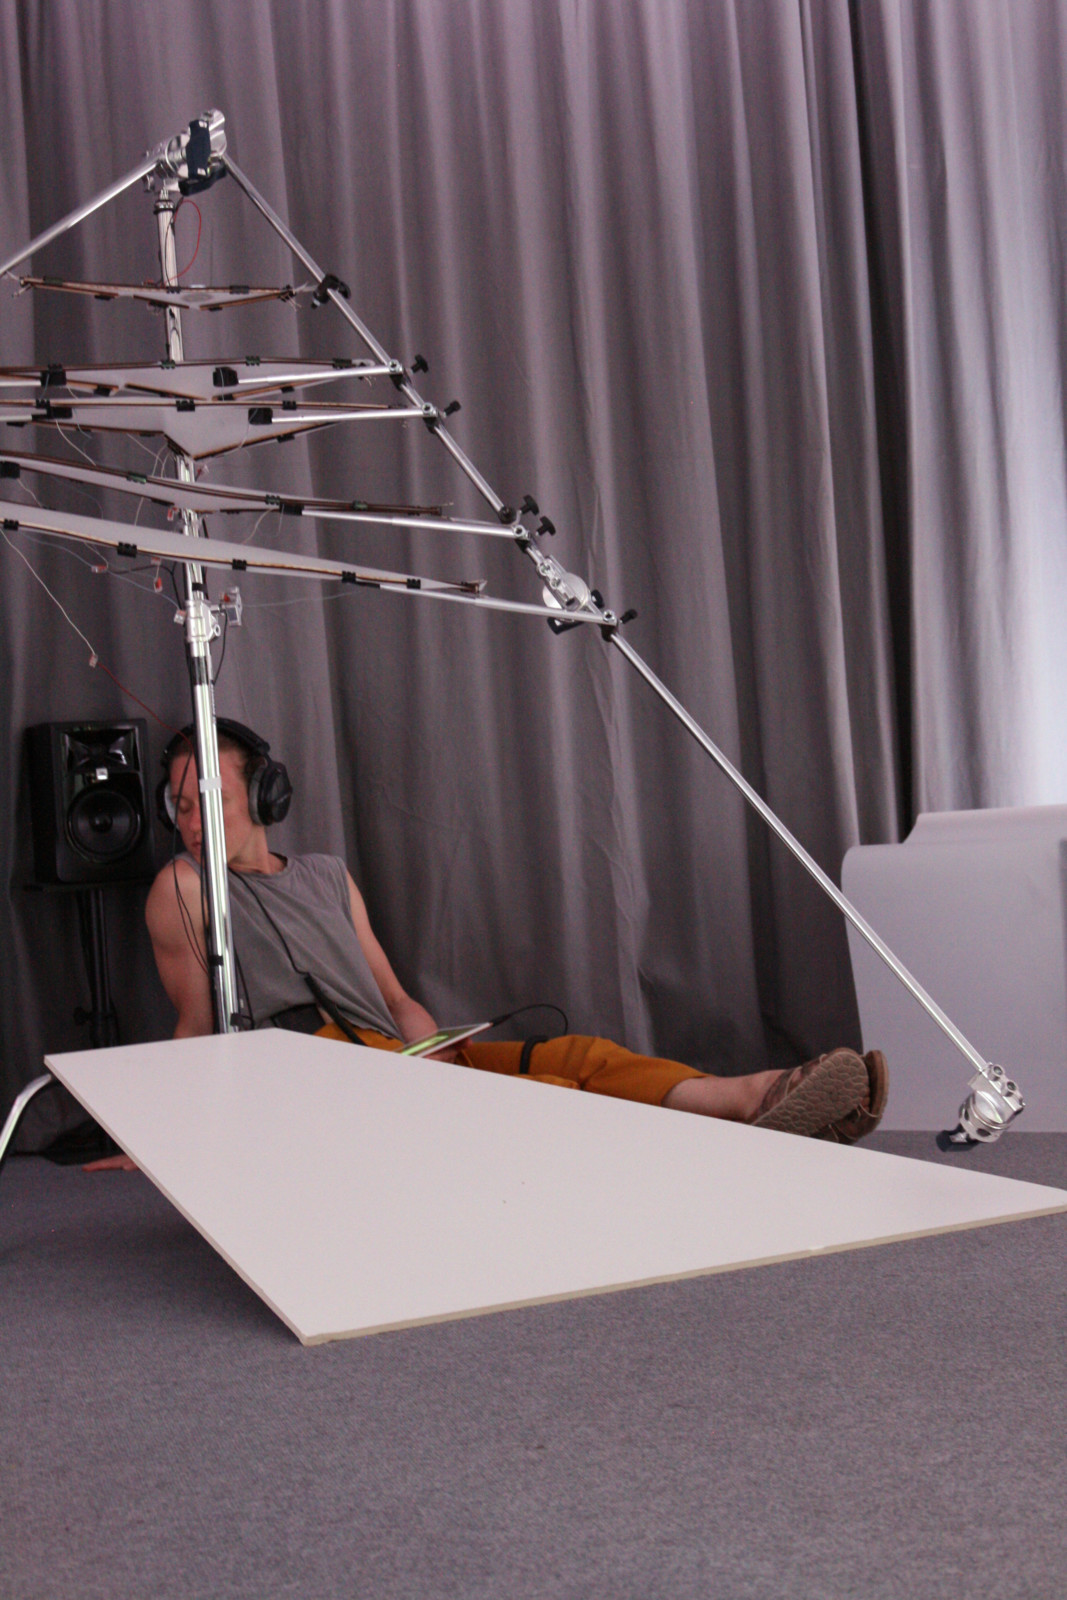
Common Grounds multi-channel sound-light installation at the open lab of the academy for theater and digitality 2022. Picture by Kerstin Ergenzinger
Turning to sound
For about two years we have been developing methods to translate our long-term data into sonic dimensions and then into a musical-installative context. Compared to our standard methods of visualizing highly complex datasets (Boike et al., 2018), this is a new method of transmitting and communicating science. The listener will experience changes in the data (variables) through changes in different sound parameters: amplitude, frequency, timbre and tempo. Because our hearing is multidimensional, it may be easier to track changes in these parameters simultaneously. Our datasets typically contain climate parameters, such as air temperature and humidity, wind speed and direction, soil and permafrost temperature and moisture, and snow cover. They are available at high resolutions (60 min, 30 min, to 1 sec interval), over decades, at several heights and depths and from various remote locations in the Arctic.
Sonifying these different parameters simultaneously establishes an alternative and complementary approach to the graphical representation of our large-scale data sets. Sonification of the data can facilitate or enhance the understanding of a warming and changing landscape without the depth and breadth of scientific knowledge across multiple disciplines that is usually required. For example, how does the temperature change with depth and time in a 10-meter deep borehole in Svalbard? Using sonification, the differences in annual temperatures ranges in the permafrost (higher at the surface, lower with depth), as well as the long-term warming trend, can be listened to at various speeds, compressing years, or even decades, into a perceptible duration and rhythm and making the data immediately available to the senses. Listen here for example, to an audio sonification of the time from early spring 2019 until the start of year 2020, where the 1h loop of the installation drops 192 cents in tone, back to its tuning of the year 2000 – a process analogous to the detected mean temperature rise of 1,92°C at the Svalbard station.
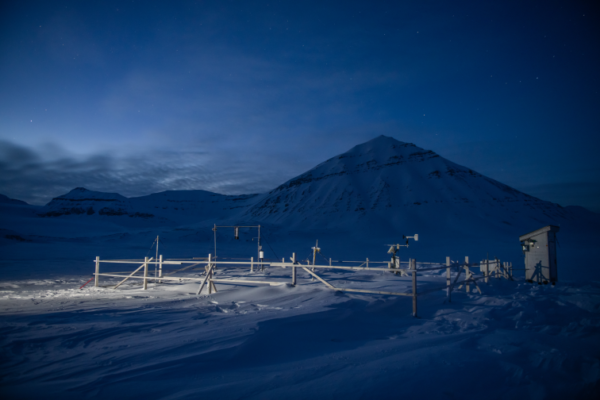
The Bayelva AWIPEV permafrost observatory is based on the island of Spitsbergen in the Svalbard archipelago, near the village of Ny-Ålesund (79°N). Although located far north, the West Spitsbergen Current, a branch of the North Atlantic, warms this area to an average air temperature of about -4.3°C. Average permafrost temperatures are higher (-2.8°C mean) compared to other High Arctic permafrost locations (such as the Canadian High Arctic or northern Siberia). Over the past 25 years, warmer air temperature (~0.09°/year) and a shorter snow season have resulted in warmer ground and increased thaw depth (Boike et al., 2018). The snow covered period has shortened by about 1.8 days/year. All climate and permafrost data are streamed daily from the site, which allows for rapid quality control and is available online (Boike et al., 2018). While the enormous retreat of glaciers has been quantified using images, changes in subsurface permafrost are often difficult to quantify.
Sonification allows the scaling of data sets into accessible auditory streams, from which we can gain intuition and experience these vast changes. We do this by translating data points into vector-like streams and mapping them to the various aspects of a synthesized sound mentioned above. The data points come together in lines we can follow and, unlike in vision, in the auditory realm we can retain the individuality of the lines even if we listen to several lines simultaneously.
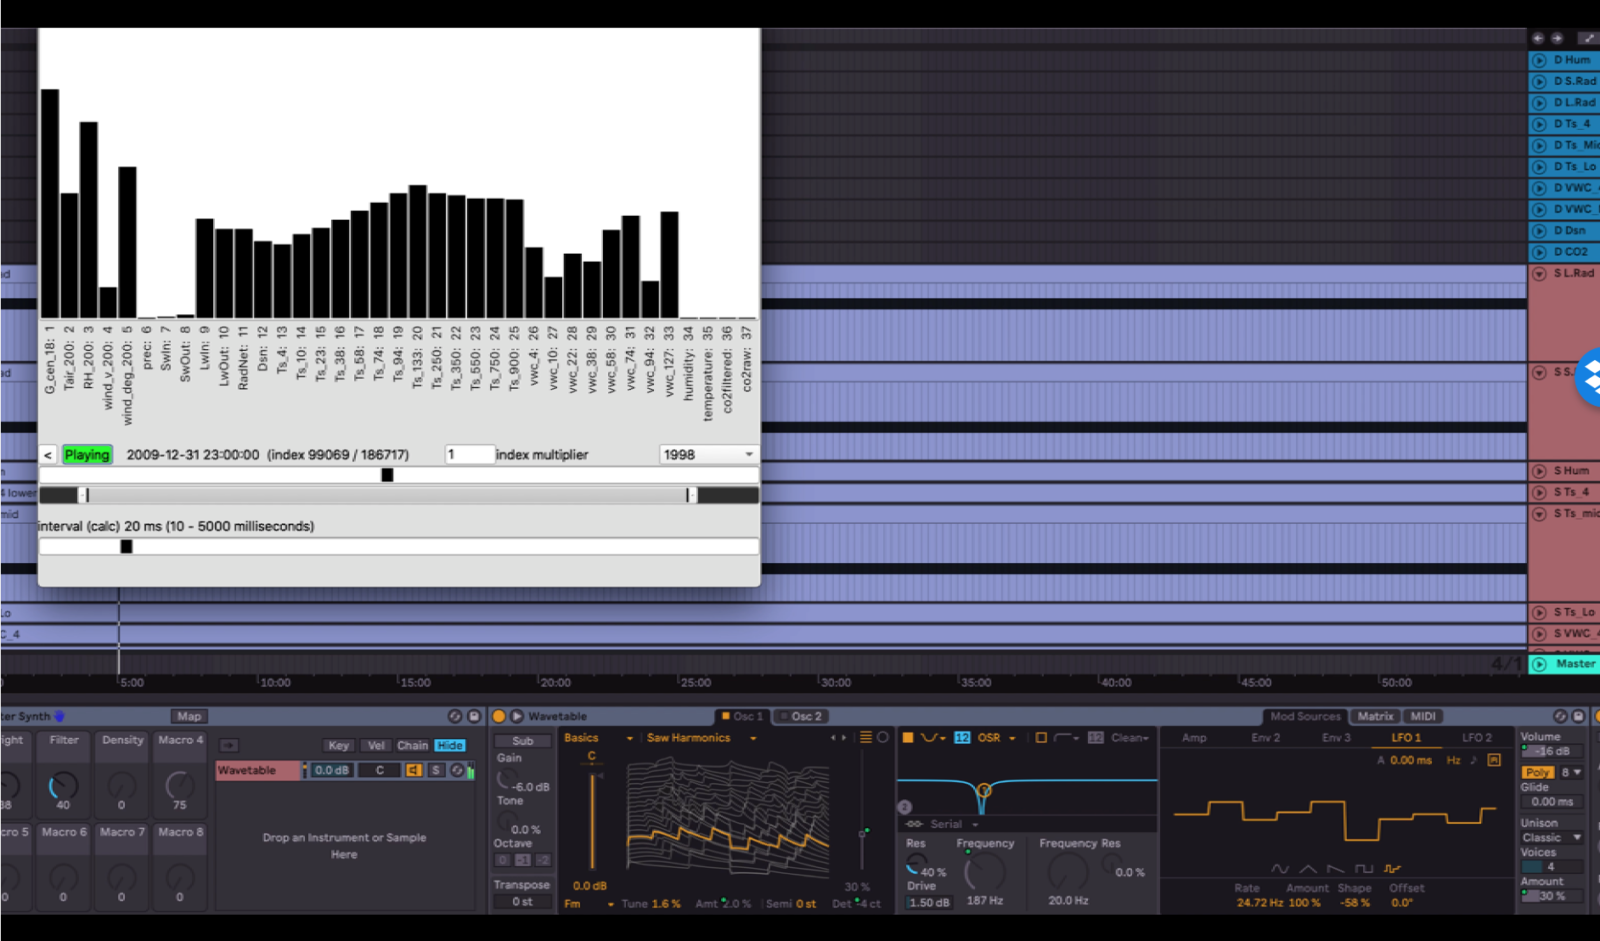
Screenshot sonification software mapped to sound synthesis
Art-Science encounters
Even when focused on this data listening task, as a multidisciplinary team of scientists and artists, we soon faced the typical challenges of communicating and thinking together across different fields and paradigms. This task of listening to the data requires time and patience to prepare and calibrate the ears to listen and evaluate differences in the behavior of changing sounds. This can be unfamiliar, partially irritating or even unsettling, as it is very different from listening to composed sound. In order to actually carry out joint perceptual and cognitive experiments, both parties had to take a big step forward. This speaks to the Arts-Science problem more broadly. In some ways, the differences in language and thinking were apparent in every move and included differences in our expectations, in our relationship to imagination and our degrees of openness to speculation; our approaches to intuition and its role and, of course, the different methods we use, the goals we pursue and the way we evaluate our work.
Reflecting on this exchange, in the Wiki of the project we wrote:
Whether a pedagogical category, a funding scheme or, at best, a transdisciplinary methodology, art and science dance around notions of action and interpretation. Making art in relation to making science opens a plethora of questions regarding the approaches, strategies, techniques and practices under each of these paradigms. And especially at their contact point, where the empirical meets the speculative, we are faced with the gaps of terminology, prior knowledge and expertise (or lack of). Coming as artists to this conversation we bring our hearts and minds poised to be open yet critical, intuitive yet thorough, curious and imaginative. But in order for the magpie to dance with the raven they must agree on rules of the game. Hence, what began in Common Grounds as a given task to sonify a data set, grew up to encompass an investigation into what this meeting could even be? As it surely means more than the raven putting on a white lab coat and making nice artworks based on visits to the magpie’s lab, there is an invitation here for a more profound interaction and exchange. One that reflects on our own artist’s patterns, omissions and deaf spots, and in turns critiques and asks about the fundamentals of science making.
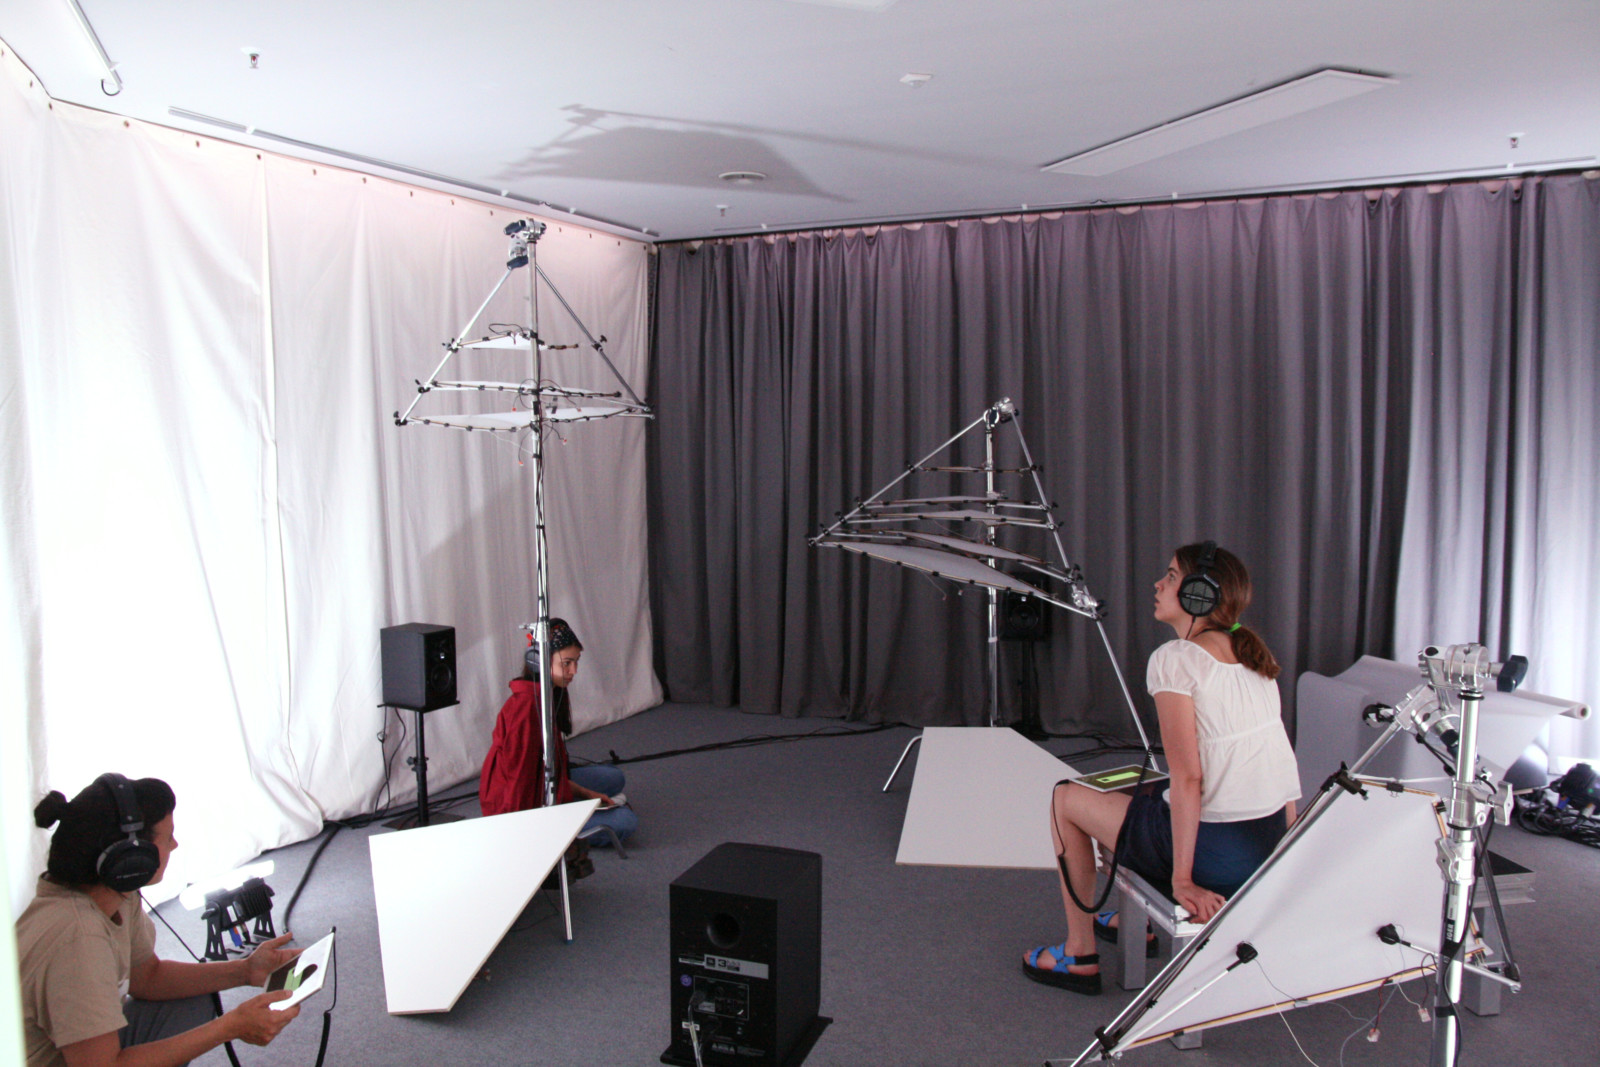
Common Grounds multi-channel sound-light installation at the open lab of the academy for theater and digitality 2022. Picture by Bnaya Halperin-Kaddari
Corresponding with sites
As a long-term artistic-scientific research project, two of our main research questions were how can we learn through our ears about the interdependencies of the atmosphere and the geosphere? And how can we translate what we learnt into an experience that offers an embodied and sensory connection to the fragile complexity of these planetary systems? In addition to the sonification methods we are implementing, our collaborative research project Common Grounds has taken the form of an immersive installation.This multi-channel, sound-light installation sonifies twenty years of hourly measurements from our Bayelva dataset. The data is made audible through sound sculptures of transduced and stretched papers. This environment forms a polyphonic ‘choir’ that compresses these twenty years into a single hour loop. Within this environment, an interactive map and a narrative audio-guide assist in establishing a common ground for listening using open-back headphones to merge the environmental soundscape with the guiding voice. By offering this experience, we are addressing a broad community: scientists, but also people without any scientific background. Through sonification, our ability to understand the magnitude and impact of phenomena such as climate change could be refined or even discovered. The musical experience that combines these data streams into the history of the Arctic permafrost landscape also makes audible dramatic changes. Listening to the >20 years of data turns into an almost painful hearing experience when this landscape is radically destroyed by warming (e.g., once the threshold is crossed, meaning that the ground ice of the permafrost is permanently thawed to 0°C, it is irreversibly destroyed).
Through Common Grounds, we are developing strategies to communicate climate research from within the crisis through uncompromising art. Some of our goals were:
- To portray an image that is neither beautiful nor apocalyptic, but rather to connect us humans to our surroundings through real data and a multi-sensory appeal towards hearts and minds.
- To use art as an expanded way of thinking about science (and vice versa).
- To question what might become of the art-science encounter by focusing on local exchange between a specific art practice and a specific science practice.
Listening to and following these specific exchanges, these polyphonic threads, we realized the question “how does the Arctic sound” is not appropriate as it is both too general and too static. Instead, when we started asking questions such as “how do we actually measure weather and climate changes?“, we became more attentive to our tools and sensors. In the installation we felt the need to complement the sounds, which are abstract in nature, with a communicative and informative layer about these sensor-tools and so we included an interactive map connected to short stories told from the perspective of each of the station’s sensors, personifying them and giving visitors important factual and emotional entry points into the experience.
We leave you with a poetic fragment from the audio guide:
I am a hole, ten meters deep, narrow, dark and cold. I am here to measure the permafrost’s temperature. Here you are standing on top of my ground, where the sensor’s tentacles crawl into me. I was drilled into this ground in August 2009 to get a good feeling of its depth, dark and cold. Feel my frozen beat, every waning and waxing moon, narrow, dark and cold, dark and cold.
Further reading
Examples of an art-science collaboration:
Zanella, A., Harrison, C.M., Lenzi, S. et al. Sonification and sound design for astronomy research, education and public engagement. Nat Astron 6, 1241–1248 (2022). https://doi.org/10.1038/s41550-022-01721-z
Metrological rain records: http://www.sirrende-duerre.dyffort-driesch.de/
Sonification and materilisation of precipitation data: https://www.nodegree.de/work/pluvial/
Common Grounds project wiki: https://wiki.theater.digital/projects:commongrounds:start
Cited references:
Boike, J., Juszak, I., Lange, S., Chadburn, S., Burke, E., Overduin, P. P., Roth, K., Ippisch, O., Bornemann, N., Stern, L., Gouttevin, I., Hauber, E., and Westermann, S.: A 20-year record (1998–2017) of permafrost, active layer and meteorological conditions at a high Arctic permafrost research site (Bayelva, Spitsbergen), Earth Syst. Sci. Data, 10, 355–390, https://doi.org/10.5194/essd-10-355-2018, 2018.
Isaksen, K., Nordli, Ø., Ivanov, B. et al. Exceptional warming over the Barents area. Sci Rep 12, 9371 (2022). https://doi.org/10.1038/s41598-022-13568-5
Rantanen, M., Karpechko, A.Y., Lipponen, A. et al. The Arctic has warmed nearly four times faster than the globe since 1979. Commun Earth Environ 3, 168 (2022). https://doi.org/10.1038/s43247-022-00498-3
Edited by Ugo Nanni and Loeka Jongejans
Common Grounds is an ongoing collaborative research project between artists and scientists:
 Kerstin Ergenzinger is a visual artist working across the fields of installation, electronic arts, sound and drawing. The inextricable relations between body and world, perception and the perceived, sensing and sense making are central themes of her practice. nodegree.de
 Bnaya Halperin-Kaddari is a composer and artist, working across a broad spectrum of practices to embody and re-ritualise ways of sounding as an alternative mode of being. Exploring a plethora of artistic strategies his work attempts to navigate the physical, political and spiritual turbulences of our world. Kaddari.net
Bnaya and Kerstin are long-time collaborators as part of the Sono-Choreographic Collective. sonochoreographic.net
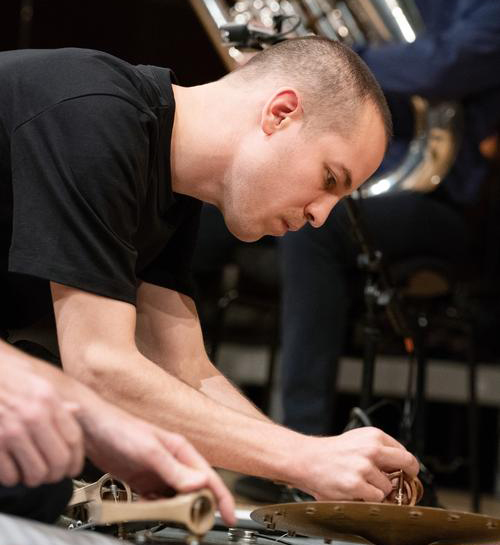
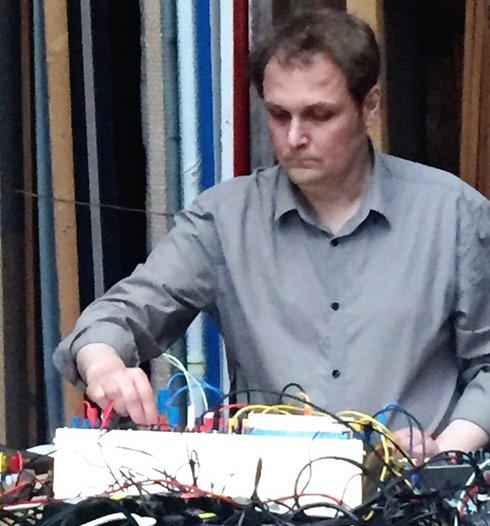 Tobias Grewenig primarily works with non-linear, installation-based works and audiovisual performances, including projects with the artist group “Therapeutische Hörgruppe Köln” and the Ensemble “The Knob, The Finger & The It”. The conception and developement of analog and hybrid electronic instruments is a key component of his work. www.tobiasgrewenig.com
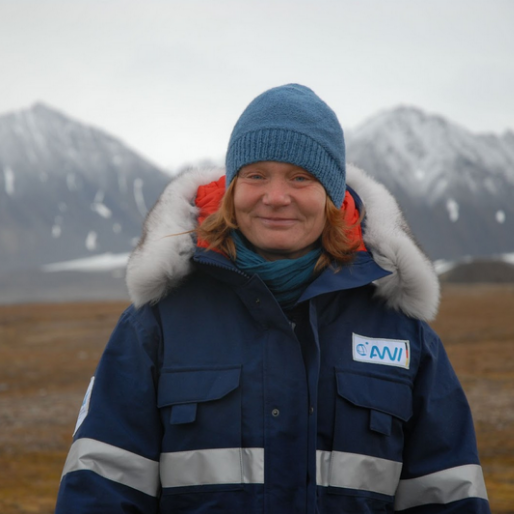 Julia Boike is the chair of the Energy- and Water fluxes research group at the, Permafrost research division at the Alfred-Wegener-Institut Potsdam and also a professor at the Humboldt Universität zu Berlin. Her research interests are: Thermal and hydrological processes in northern permafrost soils; Soil-atmosphere energy balance observations and modeling in high latitude regions; Water balance observations, modeling and scaling in the Arctic. https://www.awi.de/en/science/geosciences/permafrost-research/research-focus/energy-and-waterbalance.html
The initial phase of this project was supported by a HIDA X ATD Fellowship from the Helmholtz Information & Data Science Academy (HIDA) and the Academy for Theater and Digitality Dortmund and the Alfred-Wegener-Institut Helmholtz-Zentrum für Polar- und Meeresforschung.
Jack Herzig
Fascinating! Thank you for sharing your process and hoping you will continue this important work!