Percent change in ice shelf melting, caused by the ocean, during the four future projections. The values are shown for all of Antarctica (written on the centre of the continent) as well as split up into eight sectors (colour-coded, written inside the circles). Figure 3 of Naughten et al., 2018 ). ©American Meteorological Society. Used with permission.
Climate change will increase ice shelf melting around Antarctica. That’s the not-very-surprising conclusion of a recent modelling study, resulting from a collaboration between Australian and German researchers. Here’s the less intuitive result: much of the projected melting is actually linked to a decrease in sea ice formation. Learn why in our Image of the Week…
Different types of Antarctic ice
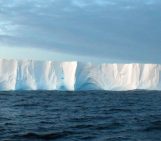
Sea ice is just frozen seawater. But ice shelves (as well as ice sheets and icebergs) are originally formed of snow. Snow falls on the Antarctic continent, and over many years compacts into a system of interconnected glaciers that we call an ice sheet. These glaciers flow downhill towards the coast. If they hit the coast and keep going, floating on the ocean surface, the floating bits are called ice shelves. Sometimes the edges of ice shelves will break off and form icebergs, but they don’t really come into this story (have a look at this and this previous post if you want to read about icebergs nevertheless!).
Climate models don’t typically include ice sheets, or ice shelves, or icebergs. This is due to a combination of insufficient resolution and software engineering challenges, and is one reason why future projections of sea level rise are so uncertain. However, some standalone ocean models, i.e. ocean models without a coupled atmosphere, do include ice shelves. At least, they include the little pockets of ocean beneath the ice shelves – we call them ice shelf cavities – and can simulate the melting and refreezing that happens on the undersides of ice shelves.
Modelling future ice shelf melting
We took one of these ocean/ice-shelf models and forced it with the atmospheric output of regular climate models, which periodically make projections of climate change from now until the end of this century. As forcing, we used the atmospheric output of the Australian model ACCESS 1.0 in two experiments, and the mean of the atmospheric output from 19 other climate models taking part in the Coupled Model Intercomparison Project Phase 5 (Multi-Model Mean or “MMM”) in another two experiments. Each set of experiments considered two different scenarios for future greenhouse gas emissions (“Representative Concentration Pathways” or RCPs), for a total of four simulations. Each simulation required 896 processors on the supercomputer in Canberra. By comparison, your laptop or desktop computer probably has about 4 processors. These are pretty sizable models!
In every simulation, and in every region of Antarctica, ice shelf melting increases over the 21st century. The total increase ranges from 41% to 129% depending on the emissions scenario and choice of climate model. The largest increases occur in the Amundsen Sea region, marked with red circles in our Image of the Week, which also happens to be the region exhibiting the most severe melting in recent observations. In the most extreme scenario, i.e. with the highest future greenhouse gas emissions and the more sensitive climate model, ice shelf melting in this region nearly quadruples.
Understanding the drivers of melting
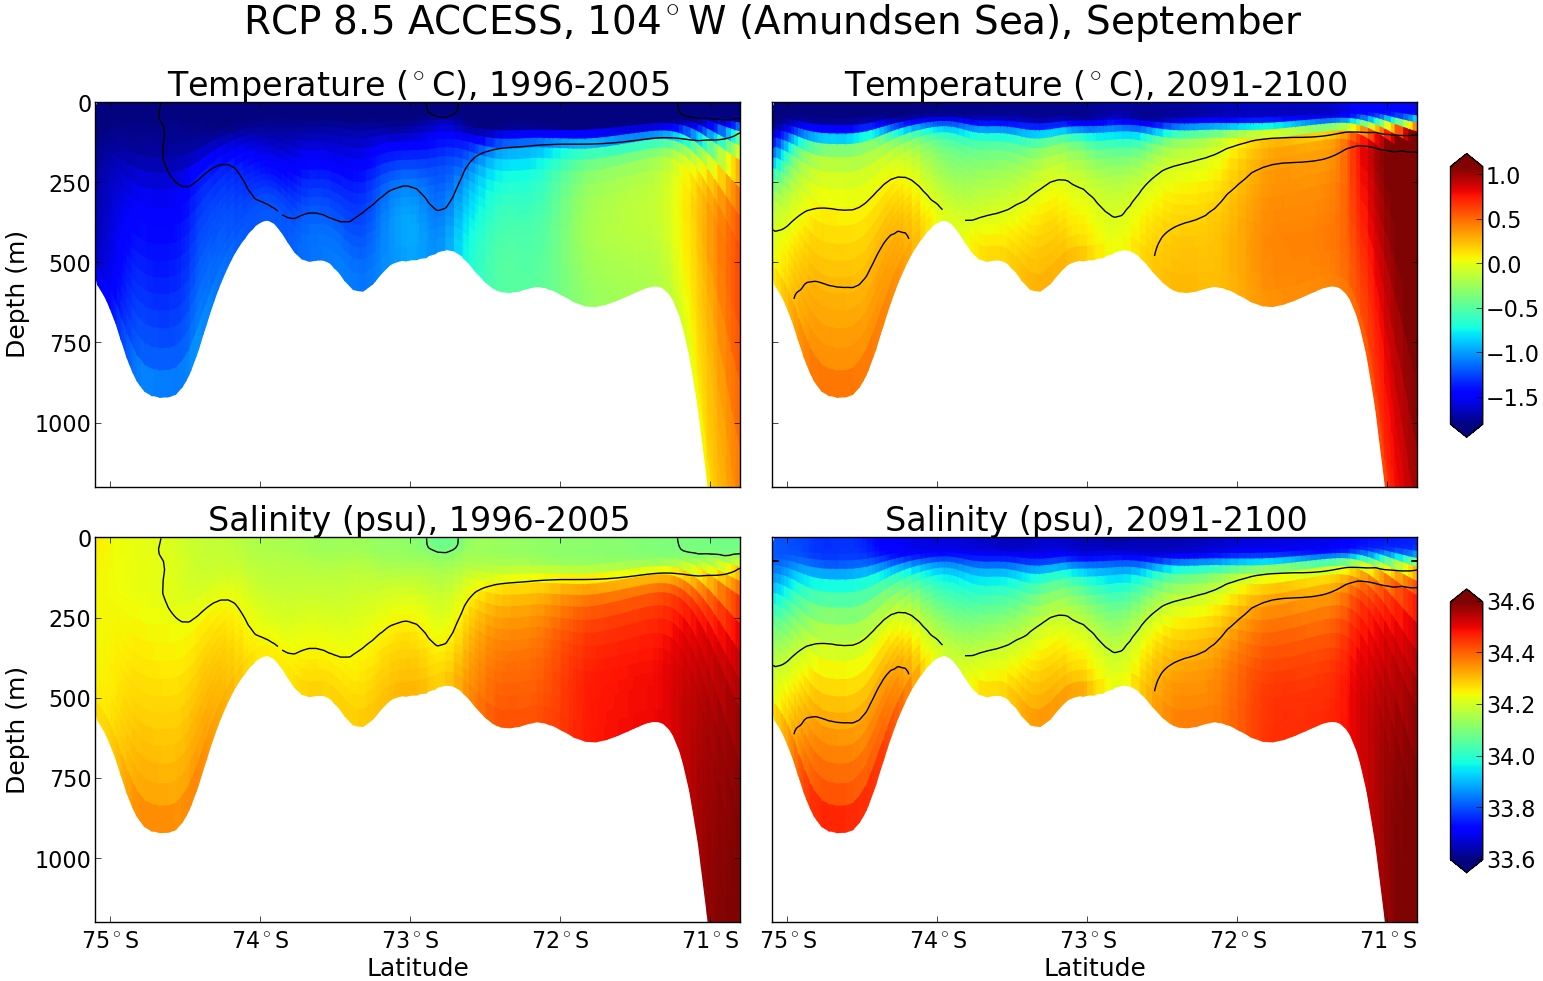
So what processes are causing this melting? This is where the sea ice comes in. When sea ice forms, it spits out most of the salt from the seawater (brine rejection), leaving the remaining water saltier than before. Salty water is denser than fresh water, so it sinks. This drives a lot of vertical mixing, and the heat from warmer, deeper water is lost to the atmosphere. The ocean surrounding Antarctica is unusual in that the deep water is generally warmer than the surface water. We call this warm, deep water Circumpolar Deep Water, and it’s currently the biggest threat to the Antarctic Ice Sheet. (I say “warm” – it’s only about 1°C, so you wouldn’t want to go swimming in it, but it’s plenty warm enough to melt ice.)
In our simulations, warming winters cause a decrease in sea ice formation. This leads to less brine rejection, causing fresher surface waters, causing less vertical mixing, and the warmth of Circumpolar Deep Water is no longer lost to the atmosphere. As a result of reduced vertical mixing, ocean temperatures near the bottom of the Amundsen Sea increase and this better-preserved Circumpolar Deep Water
finds its way into ice shelf cavities, causing large increases in melting.

Slices through the Amundsen Sea – you’re looking at the ocean sideways, like a slice of birthday cake, so you can see the vertical structure. Temperature is shown on the top row (blue is cold, red is warm); salinity is shown on the bottom row (blue is fresh, red is salty). Conditions at the beginning of the simulation are shown in the left 2 panels, and conditions at the end of the simulation are shown in the right 2 panels. At the beginning of the simulation, notice how the warm, salty Circumpolar Deep Water rises onto the continental shelf from the north (right side of each panel), but it gets cooler and fresher as it travels south (towards the left) due to vertical mixing. At the end of the simulation, the surface water has freshened and the vertical mixing has weakened, so the warmth of the Circumpolar Deep Water is preserved. Figure 8 of Naughten et al., 2018, ©American Meteorological Society. Used with permission.
Going to the next level
This link between weakened sea ice formation and increased ice shelf melting has troubling implications for sea level rise. The next step is to simulate the sea level rise itself, which requires some model development. Ocean models like the one we used for this study have to assume that ice shelf geometry stays constant, so no matter how much ice shelf melting the model simulates, the ice shelves aren’t allowed to thin or collapse. Basically, this design assumes that any ocean-driven melting is exactly compensated by the flow of the upstream glacier such that ice shelf geometry remains constant.
Of course this is not a good assumption, because we’re observing ice shelves thinning all over the place, and a few have even collapsed. But removing this assumption would necessitate coupling with an ice sheet model, which presents major engineering challenges. We’re working on it – at least ten different research groups around the world – and over the next few years, fully coupled ice-sheet/ocean models should be ready to use for the most reliable sea level rise projections yet.
Further reading
- Naughten, K.A., K.J. Meissner, B.K. Galton-Fenzi, M.H. England, R. Timmermann, and H.H. Hellmer (2018) Future Projections of Antarctic Ice Shelf Melting Based on CMIP5 Scenarios.J. Climate,31, 5243–5261, doi: 10.1175/JCLI-D-17-0854.1
- Paolo, F.S., Fricker, H.A. and Padman, L. (2015). Volume loss from Antarctic ice shelves is accelerating, Science,348, (6232), 327-331, doi: 10.1126/science.aaa0940
- Image of the Week – Quantifying Antartica’s ice loss
Edited by Clara Burgard
 Kaitlin Naughten is a postdoc at the British Antarctic Survey in Cambridge, UK. She is an ocean modeller focusing on interactions between Antarctic ice shelves, sea ice, and the Southern Ocean. Tweets as @kaitlinnaughten Website: climatesight.org


