Many polar scientists who have traveled to Svalbard have heard several times how most of the stuff there is the “northernmost” stuff, e.g. the northernmost university, the northernmost brewery, etc. Despite hosting the four northernmost cities and towns, Svalbard is however accessible easily by “usual-sized” planes at least once per day from Oslo and Tromsø. This is not the case for the fifth northernmost town: Qaanaaq (previously called Thule) in Northwest Greenland. Only one small plane per week reaches the very isolated town, and this only if the weather permits it. And, coming from Europe, you have to change plane at least twice within Greenland! It is near Qaanaaq, during a measurement campaign, that our Image of the Week was taken…
Who, When and Where?
In January 2017, a few German and Danish sea-ice scientists traveled to Qaanaaq to set up different measurement instruments on, in and below the sea ice covering the fjord near Qaanaaq. While in town, they stayed in the station ran by the Danish Meteorological Institute. After a few weeks installation they traveled back to Europe, leaving the instruments to measure the sea-ice evolution during end of winter and spring.
What and How?
The goal of the measurement campaign was to measure in a novel way the evolution of the vertical salinity and the temperature profiles inside the sea ice, and the evolution of the snow covering the ice. These variables are not measured often in a combined way but are important to understand better how the internal properties of the sea ice evolve and how it affects or is affected by its direct neighbors, the atmosphere and the ocean. The team had to find a place remote enough from human influence, and with good ice conditions. As there are only few paved roads in Qaanaaq, cars are not the best mode of transport. The team therefore traveled a couple of hours on dog sleds (in the dark and at around -30°C!), with the help of local guides and their well-trained dogs (see Fig. 2 and 3).
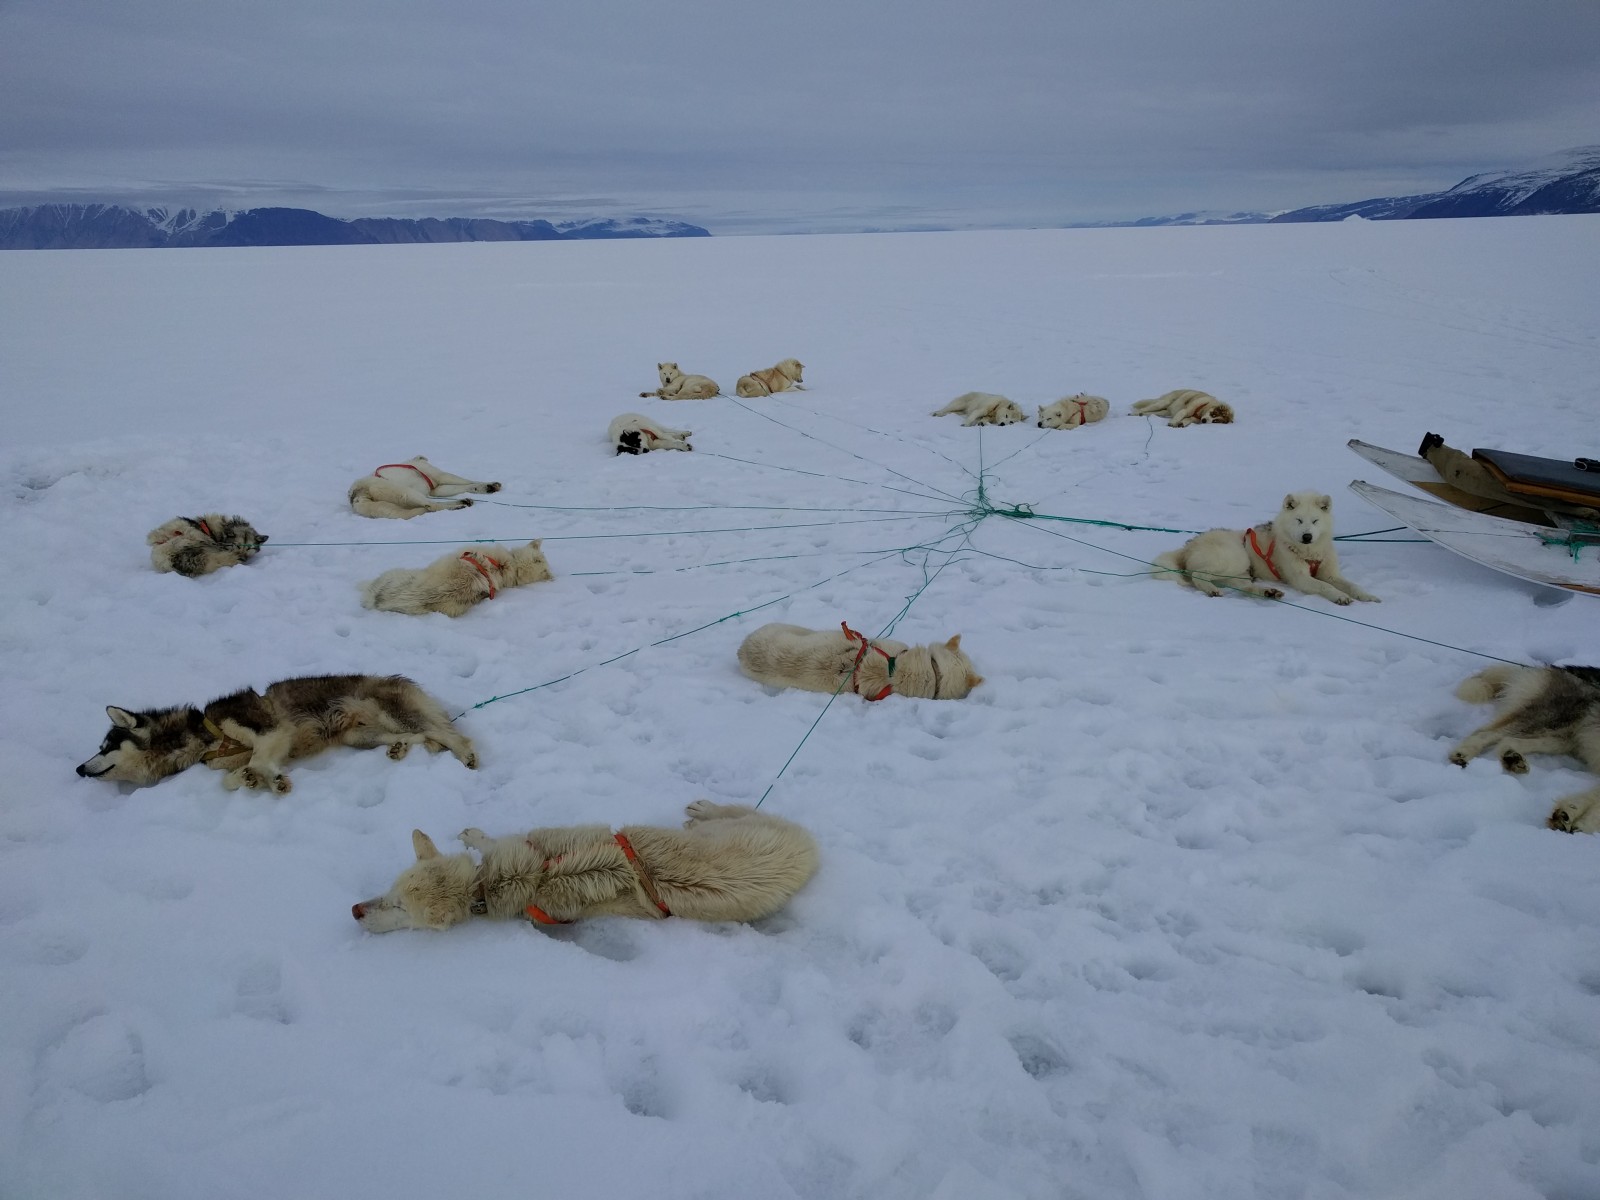
Fig. 2: While the humans were working, the dogs could take a well-deserved break [Credit: Measurement campaign team].
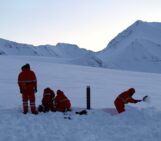
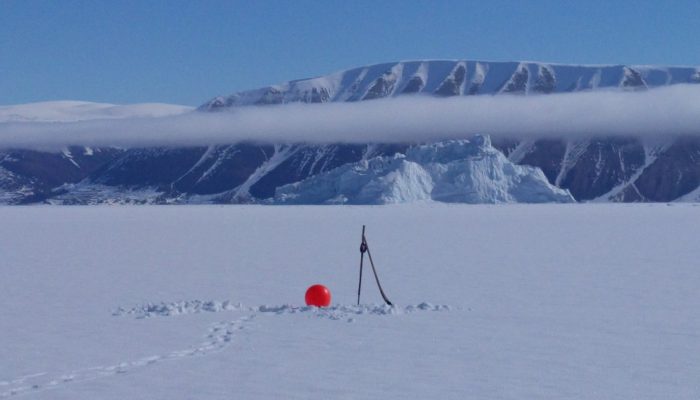
Once on the spot, the sea-ice measurement device was introduced into the ice by digging a hole of 1m x 1m in the ice, placing the measurement device in it, and waiting until the ice refroze around it. Additionally, a meteorological mast and a few moorings were installed nearby (see Image of the Week and Fig. 3) to provide measurements of the atmospheric and oceanic conditions during the measurements. Further, a small mast was installed to enable the data to be transferred through the IRIDIUM satellite network.
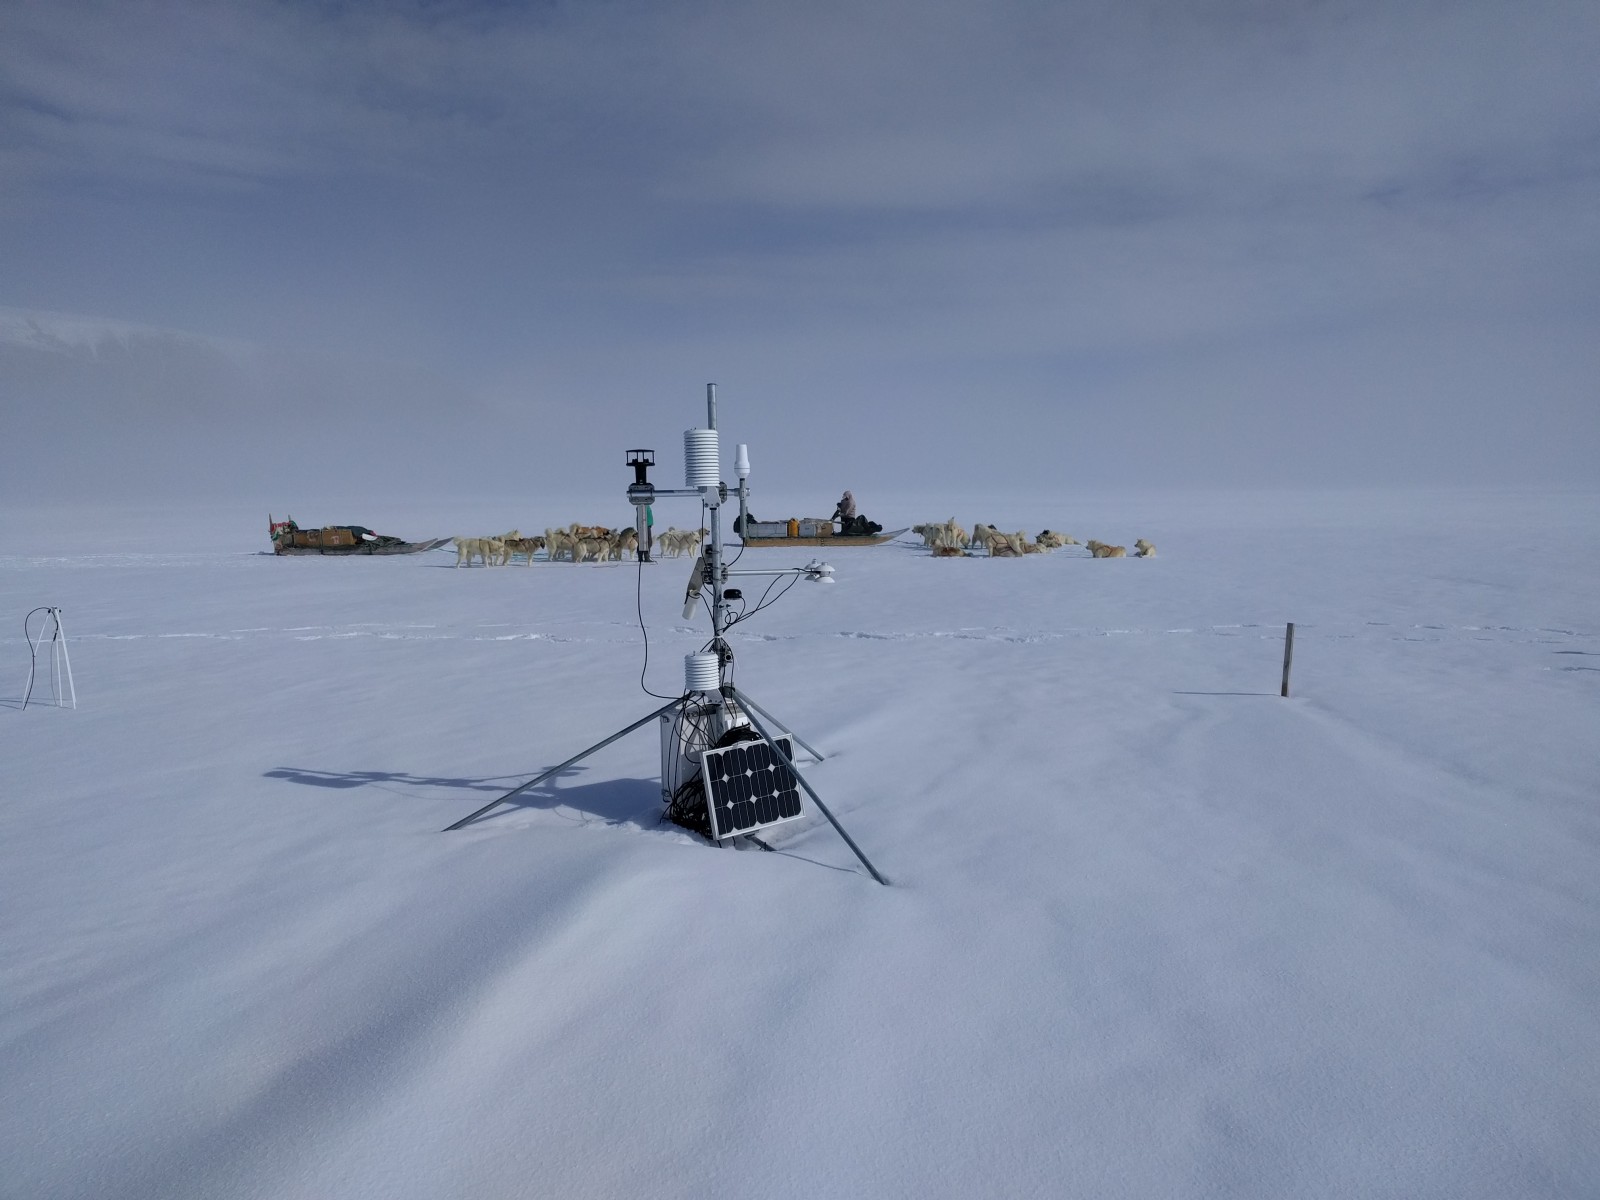
Fig. 3: Small meteorological mast with dog sleds in the background [Credit: Measurement campaign team].
Finally, the small instrument family was left alone to measure the atmosphere-ice-ocean evolution for around four months. After this monitoring period, in May, the team had to do this trip all over again to get all the measurement devices back. Studying Greenlandic sea ice is quite an adventure!
Further reading
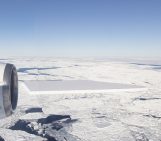
- Image of the Week – Apocalypse snow? … No, it’s sea ice!
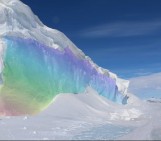
- Image of the Week – The colors of sea ice
- Image of the Week – ROVing in the deep
Edited by Violaine Coulon