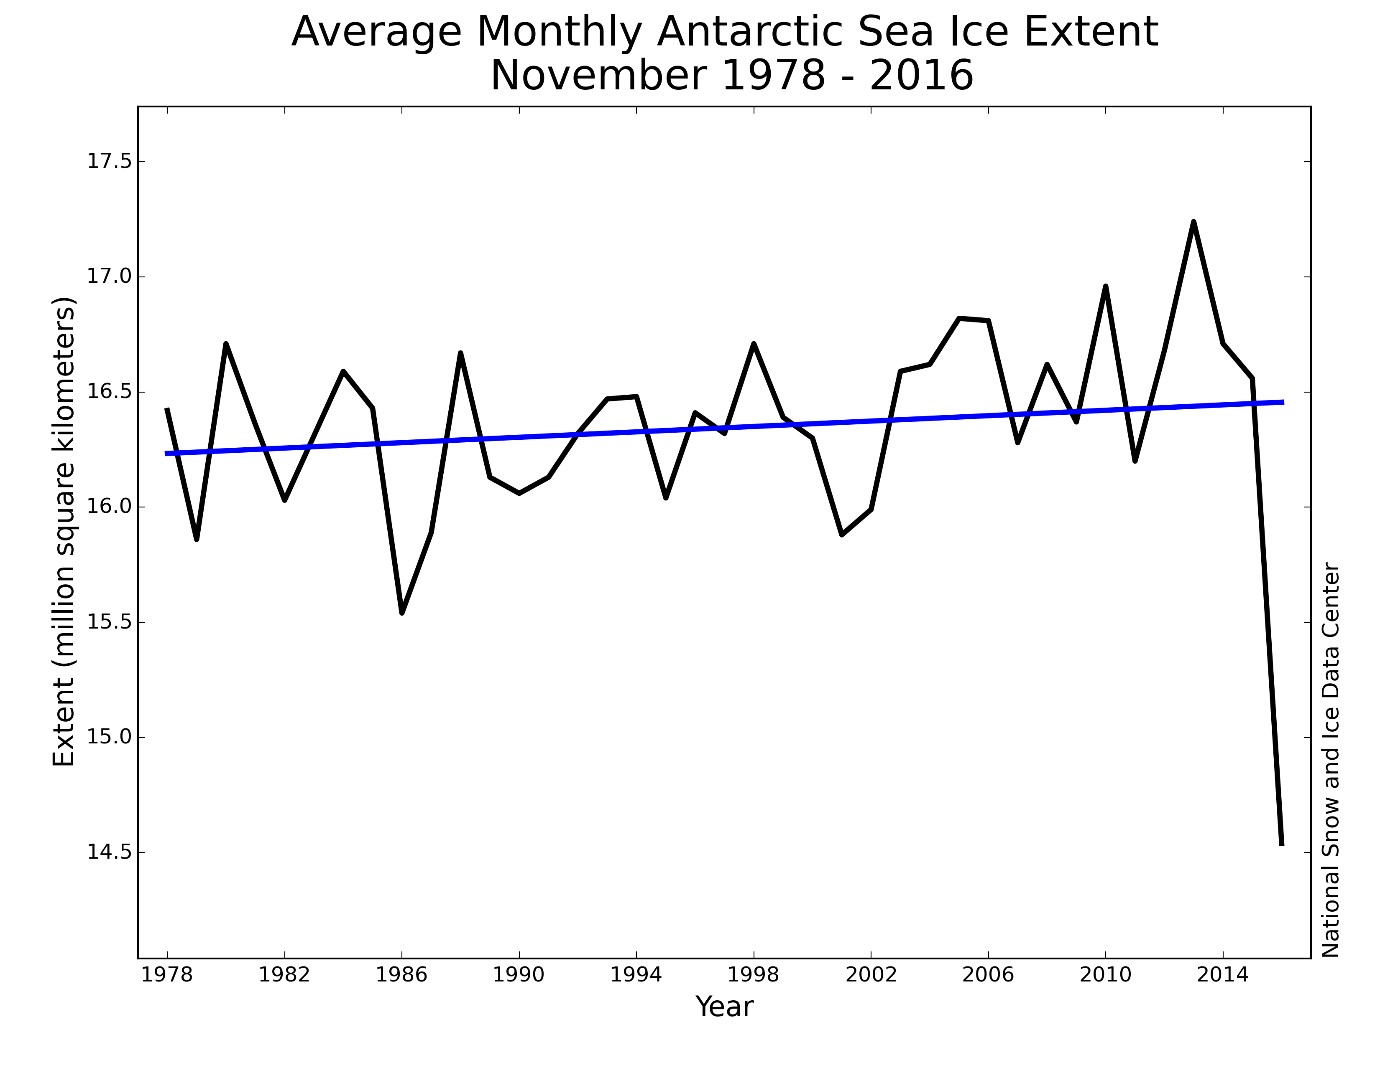
Fig. 1: Average monthly Antarctic sea ice extent time series in black, with the small increasing trend in blue. [Credit: NSIDC]
Sea ice is an extremely sensitive indicator of climate change. Arctic sea ice has been dubbed ‘the canary in the coal mine’, due to the observed steady decline in the summer sea ice extent in response to global warming over recent decades (see this and this previous posts). However, the story has not been mirrored at the other pole. As shown in our image of the week (blue line in Fig. 1), Antarctic sea ice has actually been expanding slightly overall!
The net expansion is the result of opposing regional trends
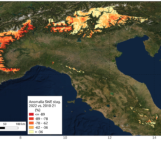
The small increasing trend in Antarctic sea-ice extent is the sum of opposing regional trends (click here for definitions of area, concentration and extent). Sea ice in the Weddell and Ross seas has expanded whereas in the Amundsen and Bellingshausen (A-B) seas the sea-ice cover has diminished (Holland 2014). The size of these trends varies with the seasons (Fig. 2). There are no significant trends in ice concentration – the fraction of a chosen area/grid box that is sea ice covered — if you look at (Southern hemisphere) winter values, however we do see trends when looking at a time series of summer values. The differences in trends between seasons suggests interactions with atmosphere and ocean (feedbacks) that amplify (in the spring) and dampen (in the autumn) changes in the ice cover, creating this seasonality. Some of this variability can be explained by changes in the winds (Holland and Kwok, 2012). But the complexity of the trends can’t be explained by one single change in forcing (e.g. winds, snowfall or temperature) or a single process (e.g. ice albedo feedback acting in the spring/summer).

Fig. 2: Seasonal trend in ice concentration. Maximum trends are seen in summer. Large increases are seen in the Weddell and Ross seas, and decreases in the Amundsen and Bellingshausen (A-B) seas. [Credit: Fig 2 from Holland (2014). , reprinted with permission by Wiley and Sons].
Why hasn’t Antarctic sea ice extent been decreasing?
There is no clear consensus on this. In short, we don’t really know… It is not as intuitive as the ‘warmer climate results in less ice’ narrative for the Arctic. We only have a time series of Antarctic sea ice extent from 1979 (the start of satellite observations). We therefore can’t be sure what role natural variability is having on decadal and longer timescales, i.e. if this is just natural ups and downs or an “unusual” trend related to climate change. Another difficulty is that we don’t have a reliable time series of sea ice volume as we have difficulties in getting reliable sea ice thickness measurements, because of the thick snow covering on sea ice in the Southern Ocean. For example, it could be that the ice is becoming thinner although the sea-ice area has increased.
There are important processes and/or feedbacks between sea ice and ocean or between sea ice and atmosphere that we are missing from our models
Currently, global climate models are poor at reproducing the observed Antarctic sea ice changes (Turner et al. 2013). Models simulate a decrease in the overall sea ice extent, instead of the observed increase. They also fail to reproduce the correct spatial variations, as shown in Fig. 2. This makes it very hard to make predictions about future changes in Antarctic sea ice from model results, and implies that there are important processes and/or feedbacks between sea ice and ocean or between sea ice and atmosphere that we are missing from our models, and therefore our understanding of the Southern Ocean climate system is incomplete.
However, there are some suggestions as to processes that could explain some of the observed Antarctic sea ice variability. The largely fall into two main categories: natural variability and anthropogenic changes.
1.Natural Variability
Natural variability refers to the repeating oscillations and patterns we see in the climate system. Some of these repeating patterns can be correlated with increases/decreases in Antarctic sea ice. In particular El Nino Southern Oscillation (ENSO) and the Southern Annular Mode (SAM) have been linked to Antarctic sea ice changes. The SAM is a measure of the difference in pressure between 40°S and 65°S, a positive SAM indicates a stronger difference in pressure, driving stronger westerly winds around Antarctica, increasing the thermal isolation of Antarctica. Stronger westerlies are associated with cooler sea surface temperatures and expansion of the sea ice cover on short timescales (seasons to years).
The SAM has been in a mostly positive phase since the mid-1990s, so is believed may have something to do with some of the small increase in sea ice extent we have seen. However, variability on longer time scales (decades or longer) could also explain some of the small increase, but this is tricky to assess without a longer observational time series.
2. Anthropogenic Changes
The main two human-induced changes on the Antarctic climate system are the ozone hole and increased melting of the Antarctic ice sheet.
- Ozone hole
The ozone hole causes the westerly winds to strengthen, making the sea ice cover expand. However it is more complicated than this, as the impact on the sea ice may depend on what timescale we look at. Over longer timescales (years to decades) the initial response may be outweighed by an increase in ocean upwelling (due to the stronger winds). This brings warm water from below the cold surface layer up to the surface, melting the sea ice from below, eventually resulting in a net sea ice area decrease in response to the ozone hole. See Ferreira et al. (2015) for details.
- Increased melting of the Antarctic ice sheet
This could also play a role in the observed sea ice expansion, by increasing the ocean stratification. This results in a cooler and fresher surface layer, favouring the growth of sea ice (Bintanja et al. 2015).
It is very tricky to distinguish what is natural variability, what is human induced, or a complicated combination of two.
It is very tricky to distinguish what is natural variability, what is human induced, or a complicated combination of two. This means we don’t really know whether the observed large decrease in Antarctic sea ice extent seen in 2016/2017 (read more about it here) is just an anomaly or the start of a decreasing trend. So, in summary Antarctic sea ice is confusing, and we still can’t claim to completely understand observed variability. But this makes it interesting and means there is still a wealth of secrets left to be discovered about Antarctic sea ice!
Further reading
- Skeptical Science – Why is southern sea ice increasing?
- Image of the Week – The ups and downs of sea ice
- Image of the Week – For each tonne of CO2 emitted, Arctic sea ice shrinks by 3m2 in summer
Edited by Clara Burgard et Sophie Berger
 Rebecca Frew is a PhD student at the University of Reading (UK). She investigates the importance of feedbacks between the sea ice, atmosphere and ocean for the Antarctic sea ice cover using a hierarchy of climate models. In particular, she is looking at the how the importance of different feedbacks may vary between different regions of the Southern Ocean.
Contact: r.frew@pgr.reading.ac.uk

Daniele Pernigotti
I don’t see in the paper any comment on the contribution of the increased snowfall caused by the increased quantity of water in the atmosphere due to a warmer temperature.
Is It not relevant in your study?