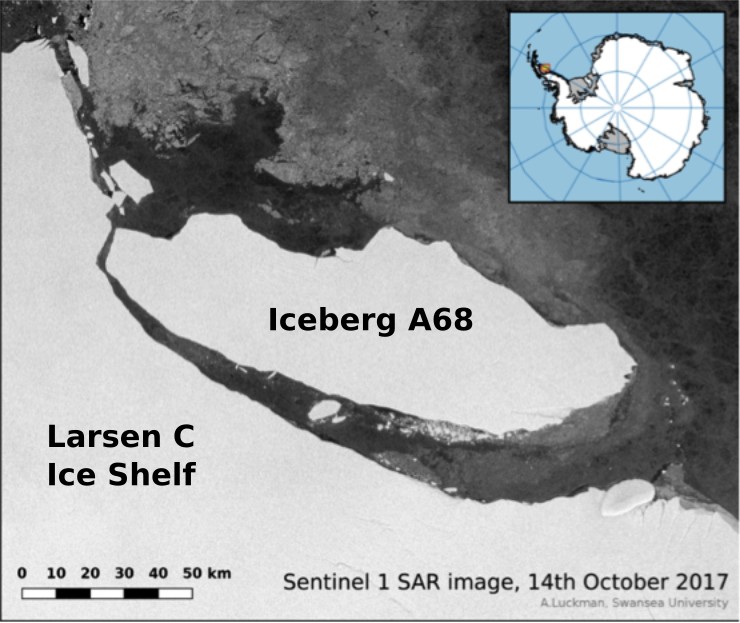
Sentinel 1 SAR image [Credit: Adrian Luckman, Swansea University].
Much of the Antarctic continent is fringed by ice shelves. An ice shelf is the floating extension of a terrestrial ice mass and, as such, is an important ‘middleman’ that regulates the delivery of ice from land into the ocean: for much of Antarctica, ice that passes from land into the sea does so via ice shelves. I’ve been conducting geophysical experiments on ice for over a decade, using mostly seismic and radar methods to determine the physical condition of ice and its wider system, but it’s only in the last couple of years that I’ve been using these methods on ice shelves. The importance of ice shelf processes is becoming more widely recognised in glaciological circles: after hearing one of my seminars last year, a glaciology professor told me that he was revising his previous opinion that ice shelves were largely ‘passengers’ in the grand scheme of things and this recognition is becoming more common. Slowly, we are coming to appreciate that ice shelves have their own specific dynamics and, moreover, that they are the drivers of change on other ice masses.
The MIDAS Project
In 2015, I joined the MIDAS project – led by Swansea and Aberystwyth Universities and funded by the Natural Environment Research Council – dedicated to investigating the effects of a warming climate on the Larsen C ice shelf in West Antarctica (Fig. 1). My role was to to assist with geophysical surveys (Fig. 2) on the ice shelf – but more about that later!
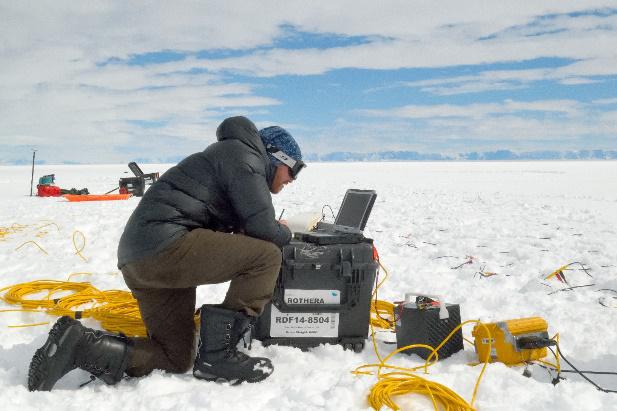
Figure 2: Adam Booth overseeing seismic surveys on the Larsen C ice
shelf in 2015 [Credit: Suzanne Bevan].
Larsen C is located towards the northern tip of the Antarctic Peninsula, and is one of a number of “Larsen neighbours” that fringe its eastern cost. MIDAS turns out to have been an extremely timely study, culminating in 2017 just as Larsen C hit the headlines by calving one of the largest icebergs – termed A68 – ever recorded. On 12th July 2017, 12% of the Larsen C area was sliced away by a sporadically-propagating rift through the eastern edge of the shelf, resulting in an iceberg with 5800 km2 area (two Luxembourgs, one Delaware, one-quarter Wales…). As of 14th October 2017 (Fig. 1), A68 is drifting into the Weddell Sea, with open ocean between it and Larsen C. See our previous post “Ice ice bergy” to find out more about how and why ice berg movement is monitored.
The aftermath of A68
As colossal as A68 (Fig, 1) is, its record-breaking statistics are only (hnnngh…) the tip of the iceberg, and of greater significance is the potential response of what remains of Larsen C. This potential is best appreciated by considering what happened to Larsen B, a northern neighbour of Larsen C. In early 2002, over 3000 km2 of Larsen B Ice Shelf underwent a catastrophic collapse, disintegrating into thousands of smaller icebergs (and immortalised in the music of the band British Sea Power). Rewind seven years further back, to 1995: Larsen B calved an enormous iceberg, exceeding 1700 m2 in area. An ominous extrapolation from this is that large iceberg calving somehow preconditions ice shelves to instability, and several models of Larsen C evolution suggest that it could follow Larsen B’s lead and become more vulnerable to collapse over the coming years.
The enormous mass of the intact ice shelf acts like a dam that blocks the delivery of terrestrial ice into the ocean, and the disappearance of the ice shelf removes so-called ‘backstress’ – essentially ‘breaking the dam’.
Then what? Well, ice shelves are in stress communication with their terrestrial tributaries, therefore processes affecting the shelf can propagate back to the supply glaciers. The enormous mass of the intact ice shelf acts like a dam that blocks the delivery of terrestrial ice into the ocean, and the disappearance of the ice shelf removes so-called ‘backstress’ – essentially ‘breaking the dam’. In the aftermath of Larsen B’s collapse, its tributary glaciers were seen to accelerate, thereby delivering more of their ice into the Weddell Sea. It is this aftermath that we are particularly concerned about, since it’s the accelerated tributaries that promote accelerated sea-level rise. Ice shelf collapse has little immediate impact on sea-level: since it is already floating, the shelf displaces all the water that it ever will. But, in moving more ice from the land to the sea, we risk increased sea levels and, with them, the associated socio-economic consequences.
How can we improve our predictions?
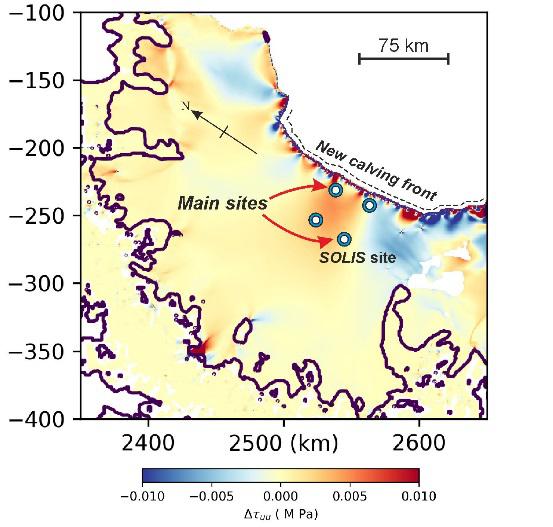
Figure 3: Computational model of the changed stress state, Δτuu, of Larsen C following the calving of A68 (output from BISICLES model, from Stephen Cornford, Swansea University). The stress change is keenly felt at the calving front, but also propagates further upstream [Credit: Stephen Cornford]
A key limitation in our ability to predict the evolution of Larsen C is a lack of observational evidence of how ice shelf stresses evolve in the short-term aftermath of a major calving event. These calving events are rare: we simply haven’t had much opportunity to investigate them, so while our computer predictions are based on valid physics (e.g., Fig. 3) it would be valuable to have actual observations to constrain them. Powerful satellite methods are available for tracking the behaviour of the shelf but these provide only the surface response; Larsen C is around 200 m thick at its calving front so there is plenty of ice that is hidden away from the satellite ‘eye in the sky’, but that is still adapting to the new stress regime. So how can we “see” into the ice?
To address this, we’ve recently been awarded an “Urgency Grant” – Response to the A68 Calving Event (RA68CE) – from NERC to send a fieldcrew to the Larsen C ice shelf, involving researchers from Leeds, Swansea and Aberystwyth, together with the British Geological and British Antarctic Surveys.

Figure 4: Emma Pearce and Dr Jim White preparing seismic equipment – intrepid geophysicists ready to wrap-up warm for field deployment on Larsen C! [Credit: Adam Booth]
The field team – Jim White and Emma Pearce (Fig. 4) – will undertake seismic and radar surveys at two main sites (Fig. 3) to assess the new stress regime around the Larsen C calving front. One of these sites is being reoccupied after seismic surveying in 2008-9, during the Swansea-led SOLIS project, allowing us to make a long-term comparison. These, and two other sites, will also be instrumented with EMLID REACH GPS sensors, to track small-scale ice movements than can’t be captured in the satellite data. The field observations will be supplied to a team of glacial modellers at Swansea University, to allow them to improve future predictions (e.g. Fig. 3), while their remote sensing team continues to monitor the evolving stress state at surface.
It’s truly exciting to be coordinating the first deployment, post A68, on Larsen C. Our data should provide a unique missing piece from the predictive jigsaw of Larsen C’s evolution, ultimately improving our understanding of the causes and effects of large-scale iceberg calving – both for Larsen C and beyond!
For ice-hot news from the field, follow Emma Pearce on twitter: @emm_pearce
Edited by Emma Smith
Further Reading
- More information on Larsen C at the project MIDAS website
- Learn more about ice shelf evolution with the Ice Flows game – eduction by stealth! Also check out the EGU Cryoblog post about it!
- Borstad et al., 2017; Fracture propagation and stability of ice shelves governed by ice shelf heterogeneity; Geophysical Research Letters, 44, 4186-4194.
- Wuite et al., 2015; Evolution of surface velocities and ice discharge of Larsen B outlet glaciers from 1995 to 2013. The Cryosphere, 9, 957-969.
- Cornford et al., 2013; Adaptive mesh, finite volume modelling of marine ice sheets; Journal of Computational Physics, 232, 1, 529-549.

Adam Booth is a lecturer in Exploration Geophysics at the University of Leeds, UK. He is the PI on the NERC-funded project “Ice shelf response to large iceberg calving” (NE/R012334/1). After obtaining his PhD from the University of Leeds in 2008, he held postdoctoral positions at Swansea University and Imperial College London, in which he worked with diverse research applications of near-surface geophysics. He tweets as: @Geophysics_Adam

Adam Booth
A quick update from Larsen C – the team just completed their first deployment, and data are flooding in! Exciting times! See @emm_pearce on Twitter for some icy-looking photos!