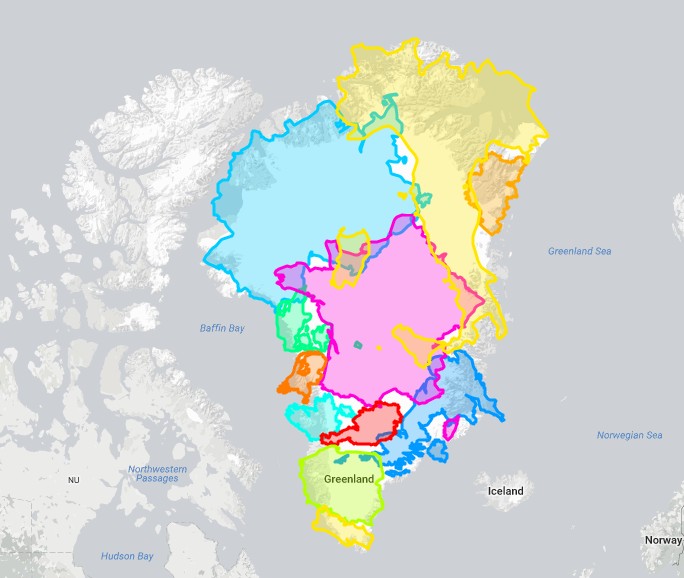
Fig. 1: Greenland is slightly bigger than Austria, Belgium, Denmark, France, Germany, Ireland, Italy, Poland, Portugal, the Netherlands and the United Kingdom together [Credit: The True Size].
However, despite being the world’s largest island Greenland, appears disproportionately large on the most common world maps (Fig. 2). Our new image of the week takes a look at the true size of Greenland…
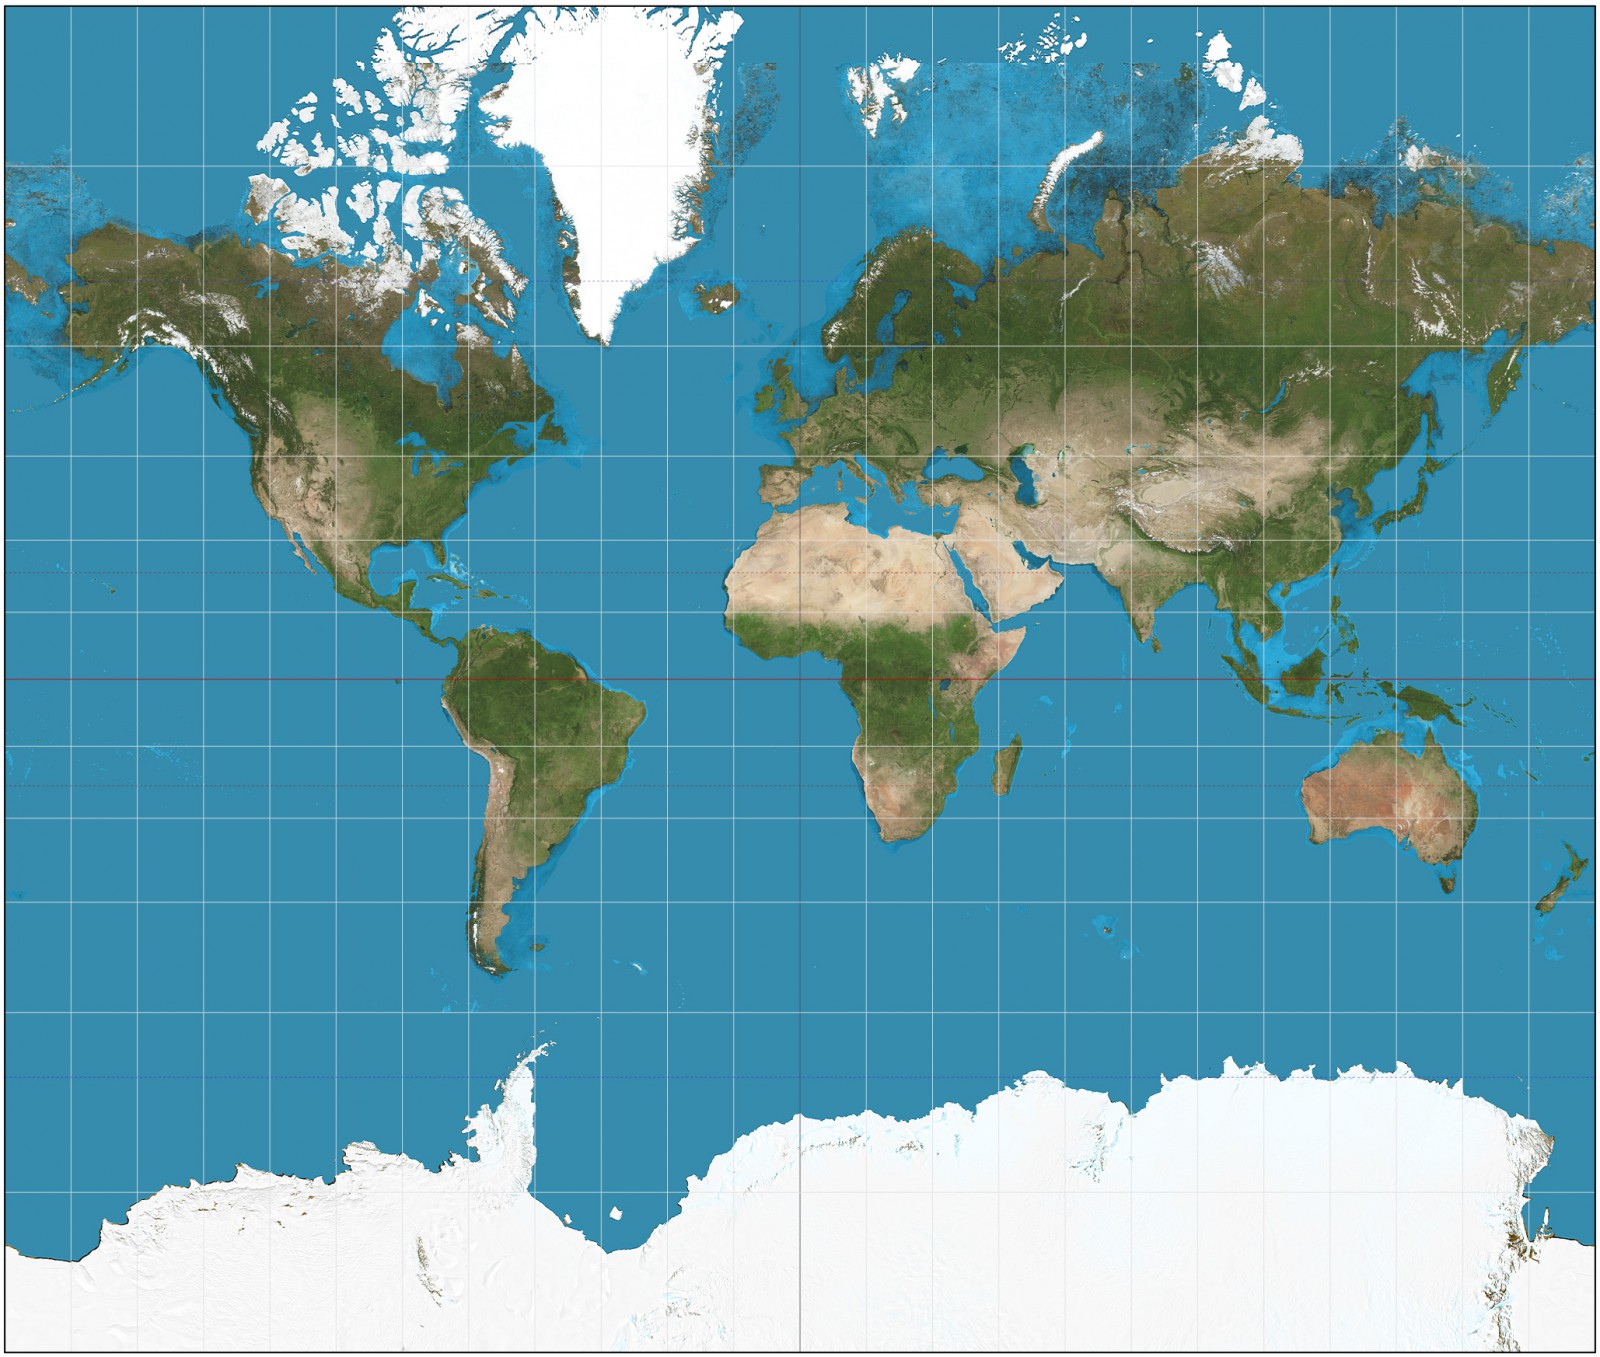
Fig. 2: World (Mercator) map used by many online mapping applications. [Credit: D. Strebe/Wikimedia commons]
How big is Greenland?
We could simply tell you that Greenland stretches over ~2 million km². For most people, this figure would however not speak for itself. Luckily, The True Size is a web application that comes to our rescue by enabling us to compare the true size of all the countries in the world.
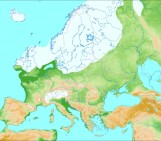
As we can see in Fig. 1, Greenland is in fact only slightly bigger than Austria, Belgium, Denmark, France, Germany, Ireland, Italy, Poland, Portugal, the Netherlands and the United Kingdom together.
Similarly, Greenland is also (Fig. 3):
-
roughly the size of the Democratic Republic of Congo
-
could fit 1.4 times in India
-
4.2 times smaller than than the United States
-
could fit 3.5 times in Australia
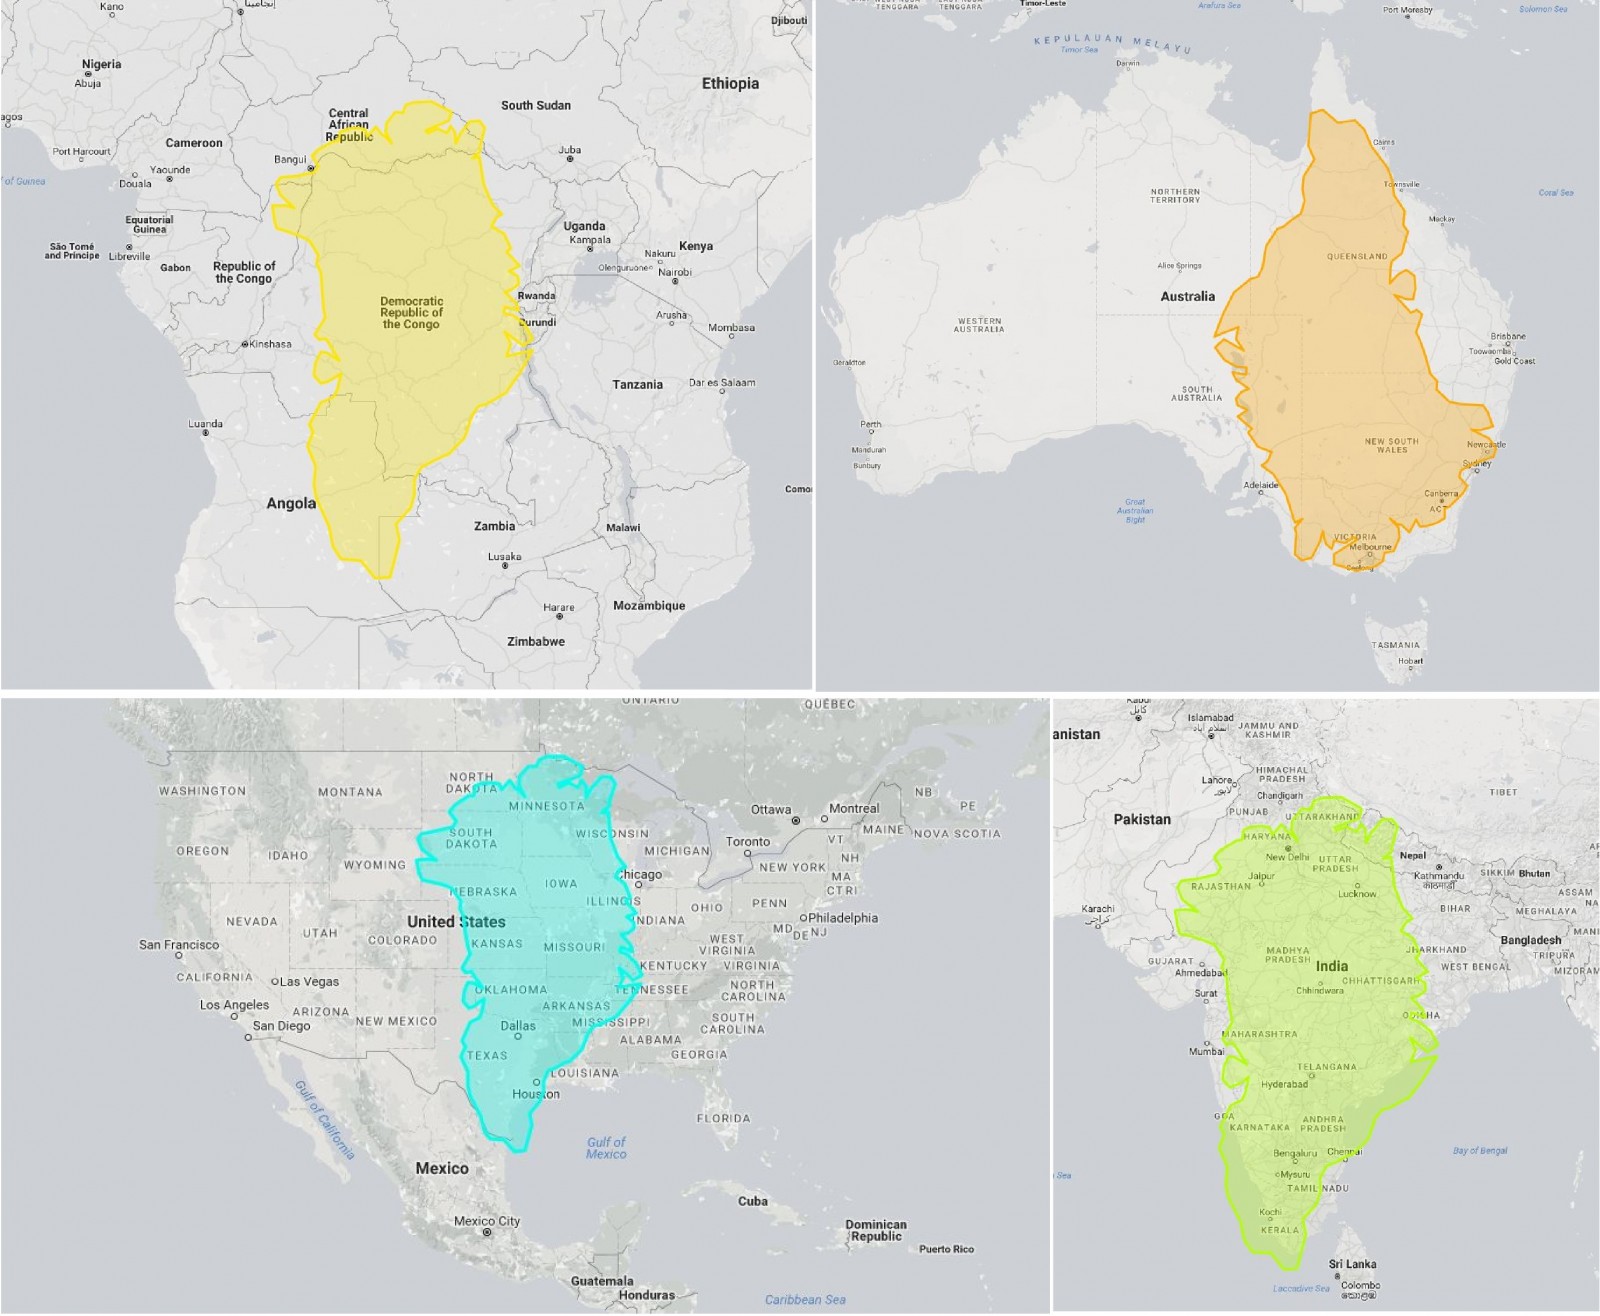
Fig. 3: Greenland vs Democratic Republic of Congo, Australia, the United States and India. [Credit: The True Size]
Greenland is therefore big but not as big as what is suggested by the most common maps (Fig. 2). As a result, one can therefore wonder why the most popular world maps distort the size of the countries.
All maps are wrong but some are useful
To map the world, cartographers must project a curved surface on a flat piece of paper. There are different approaches to do so but all distort the earth surface in some ways. For instance, conformal projections preserve angles and shapes but change the size of the countries, whereas equal-area projections conserve the sizes but distort the shapes. As a result, a map projection that suits all purposes does not exist. Instead, the choice of the projection will depend on the use of the map.
Fig. 4: Mercator cylindrical projection [Credit: National Atlas of the United States]
The most popular projection, the Mercator projection (Fig. 2), is used by many online mapping applications (e.g. google maps, OpenStreetMap, etc.). In Mercator maps, the Earth’s surface is projected on a cylinder that surrounds the globe (Fig. 4). The cylinder is then unrolled to produce a flat map that preserves the shapes of landmasses but tends to stretch countries towards the poles. This is why the size of Greenland is exaggerated in many world maps.
Why does google map use the Mercator projection then?
If Google Maps and other web mapping services rely on the Mercator projection, it is not to make countries at high latitudes appear bigger, but, because those tools are mainly intended to be used at local scales. The fact that the Mercator projection preserves angles and shapes therefore ensures minimal distortions at the city-level: two perpendicular streets will always appear perpendicular in Google Maps. This is not necessarily the case at high latitudes with projections that preserves areas (as can be seen here).
Interested in this topic? Then, you might enjoy this video !
Michael Zurek
Awesome piece, fascinating,
paul_orosz
what if it all melts
Joseph Bear
https://www.smithsonianmag.com/smart-news/melting-greenland-ice-sheet-will-cause-at-least-ten-inches-of-sea-level-rise-study-finds-180980675/
Howard
Why is it called the biggest island in the world? Australia is far bigger and is definitely an island, you can sail round it.
Mads, Denmark
Actually, Australia is not an island. It is a continent. Greenland on the other hand, is an Island which is part of the North American Continent… (it’s the same as: you can also sail all around South America)
Andrew
You can only sail all around South America because of a man-made canal. In the same way as you can only sail around Africa by using the Suez Canal.