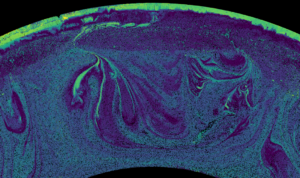
In this week’s blog post, Daniel Douglas teaches us everything about poroelasticity, water in subduction zones and… sponges under the sea! Are you ready kids? Aye, aye, Captain!
Why study subduction zones?
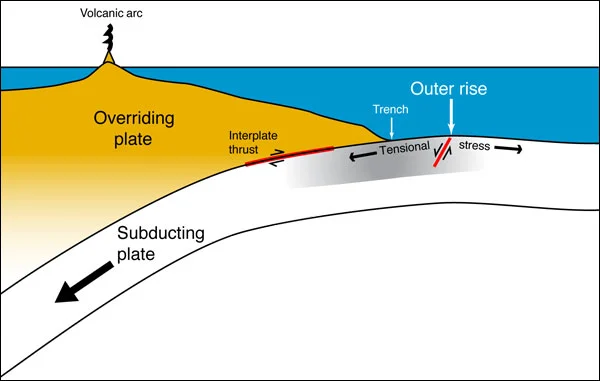
“Subduction” is a process that occurs when two tectonic plates collide with each other. As long as one of the plates is an “oceanic plate”, then the denser of the two tectonic plates will be pushed under the less dense plate and subduction will occur. This phenomenon occurs all over the world, with the total length of subduction spanning more than 55,000 km. Apart from being a primary driver of plate tectonics, an important reason to study subduction zones is that they are the locus for some of the most devastating geologic hazards on Earth. Subduction zones produce the largest magnitude earthquakes on the planet and they lead to consistent volcanic activity on the plate that lies above the sinking plate. One important consideration for understanding these geologic hazards is how water influences their evolution.
Subduction zones are spongy???
Before discussing how water influences the evolution of these hazards, it’s first important to highlight that, in some situations, rocks can behave as poro-elastic materials. A poro-elastic material is one that has “pores” (empty void space) within its matrix and, when subject to small strains, will deform elastically. The interesting property of these materials is how the “pores” and the “elastic” deformation influence each other. To get a feeling for poro-elastic deformation, let’s imagine the textbook example of a poro-elastic material: a sponge. When a sponge is completely dry, it is stiffer and harder to deform than when it is wet. When placed in water, the dry sponge will absorb water into existing pore space leading to expansion and creating new pore space, resulting in a weaker sponge that is easier to deform. Imagine you are holding this water-filled sponge in your hand. If you squeeze the sponge in your hand, water will leave the sponge due to the removal of pore space. If you stop squeezing the sponge, the sponge will rebound back to its original shape and pores will re-open, which is an example of elastic deformation. The key feedback is that when you apply a compressive force (squeezing your hand), the pore space of the sponge is reduced. Conversely, when the amount of compressive force is reduced (you stop squeezing your hand) the pore space increases. The strength of the sponge is directly related to how much pore space there is, with more pore space leading to a “weaker” sponge. Rocks behave analogously to a sponge. When subject to small enough stress over small enough time scales, rocks deform elastically, and pore space can be opened or closed in rocks depending on the applied stress, which will make the rock weaker or stronger depending on how much pore space there is.
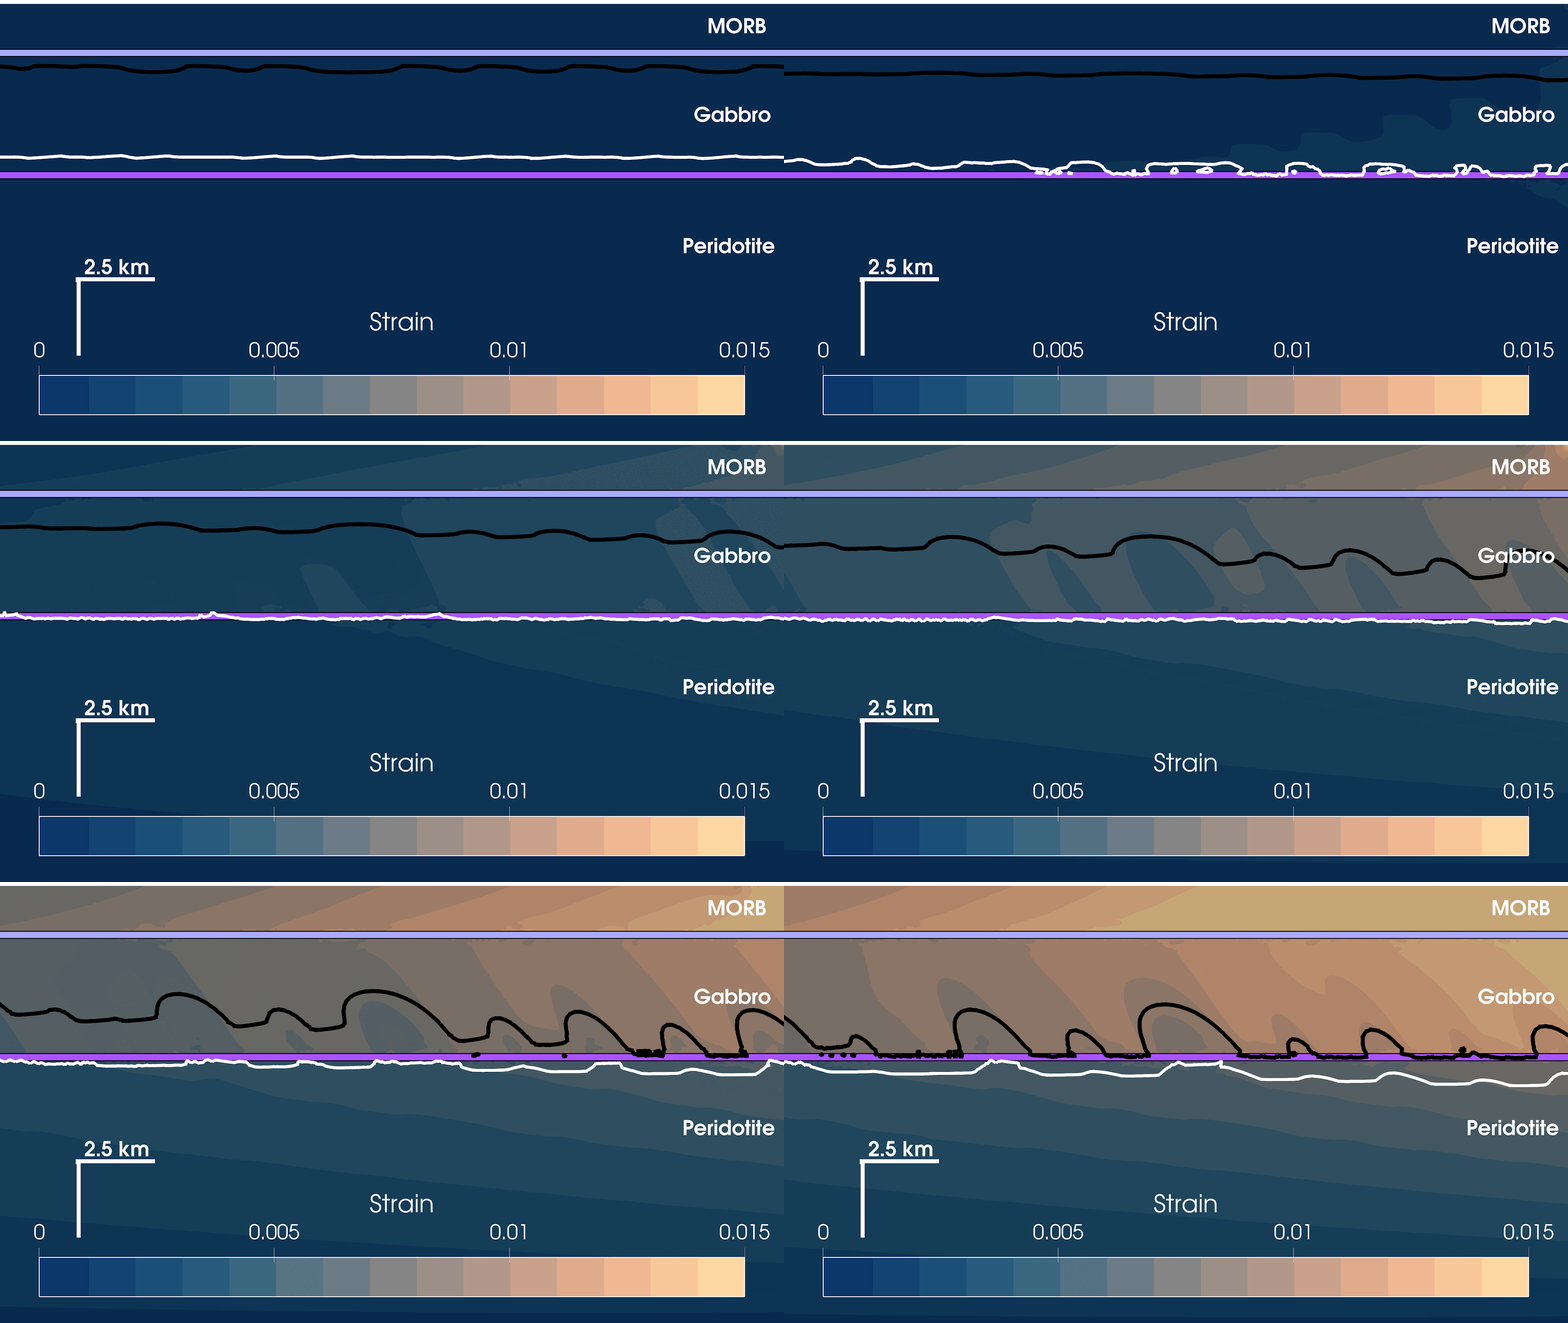
An animation showing how the development of strain and porosity in the outer-rise (cyan box in Figure 2) in the model as bending stress is applied to the material. The light purple line delineates the base of the Mid-oceanic ridge basalt layer, the dark purple line delineates the base of the gabbro layer. Black and white contours show where the model porosity is 1% and 0.5%, respectively. The animation shows the top of the bending crust, so all strain is extensional. The extensional stress leads to the opening of pore-space, and where the more permeable fault zones are located water is more readily focused into the deeper crust.
Returning to the context of subduction zones, just prior to entering the trench and being subducted, the oceanic plate is subjected to bending stresses as it is forced beneath the overriding plate and into the Earth’s mantle. This bending stress causes faults to form, which crack the rock and result in a reduction in the local compressive force acting on the rocks. As in our sponge example, this leads to the formation of pore space (though of course not nearly as much pore space as in a sponge), and because these rocks sit at the bottom of the ocean, seawater can infiltrate and fill this new pore space.
If we knew how much water there was within the rocks just before being subducted and could relate that to how easily that water can move through the rocks, we might be able to improve our understanding of how water moves throughout the system.
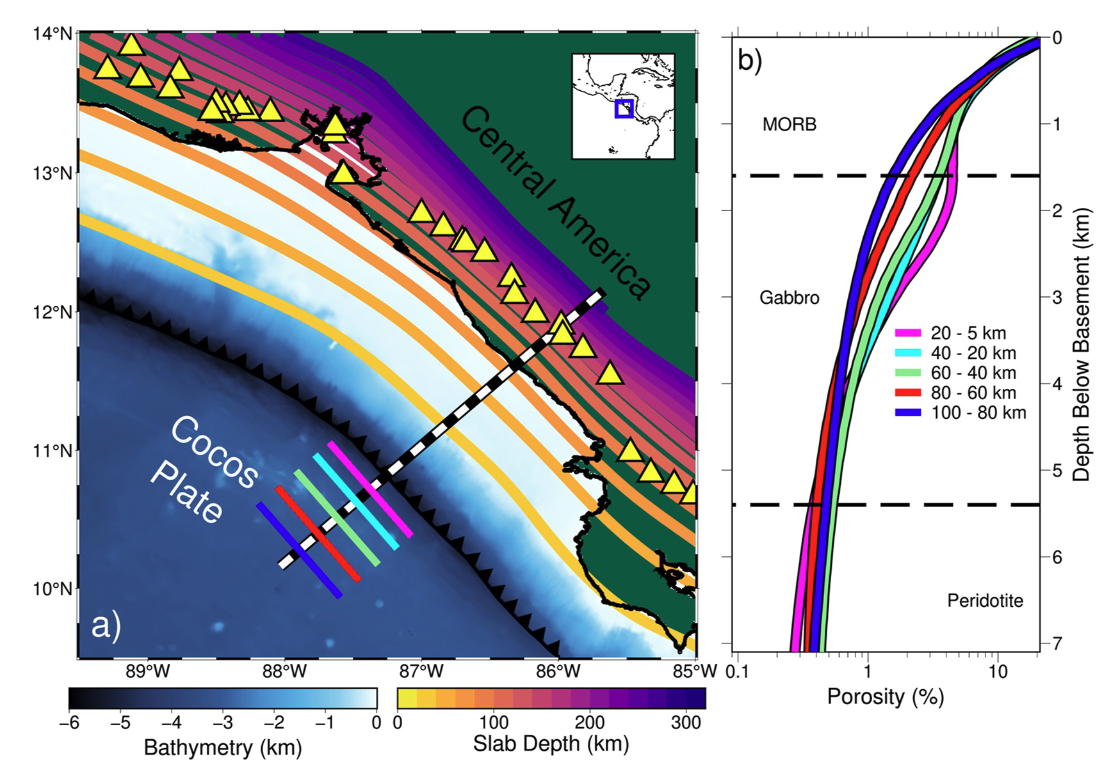
Figure 1: a) Map of the subduction zone off the coast of Nicaragua. Coloured contours show the depth to the subducting plate. The black-white dashed line shows the location of our model, and the black, red, green, cyan, and magenta lines show where the volume of water in the crust is calculated in panel b). b) The depth-averaged “porosity” (volume of water) corresponding to the trench distances on panel a). Porosity is calculated at distances of 5-20 km (magenta), 20-40 km (cyan), 40-60 km (green), 60-80 km (red), and 80-100 km (blue).
How much water is in subducting crust?
Thankfully, we have an idea of how much water exists in the pore space of rocks in a subduction zone off the coast of Nicaragua (Figure 1). We know the volume of water because the conductivity of the subducting plate was imaged. Rocks that do not have any water in them are much less conductive than rocks that do have water in them, so measuring the conductivity can give an idea of how much water is in a rock. A volume of rock with a high conductivity would have more water in it than the same volume of rock with no water in it. Therefore, if we know the conductivity of the dry rocks that are being subducted (which we do), and we know the conductivity of seawater (which we do), we can determine how much water must be in a given volume of rock in order to give the conductivity value that is measured (See Naif et al., 2015 for more information on this). In Figure 1b), there is a clear trend with increasing amounts of water in the subducting crust with proximity to trench. Returning to our sponge analogy, this makes sense because there is more bending the closer you are to the trench, so more pore space can be opened. Because we know how much water is in the subducting plate, and because we know that these rocks deform like a “poro-elastic” material, we can construct a numerical model that tries to understand how water moves throughout the system to get the distribution of water that we observe.
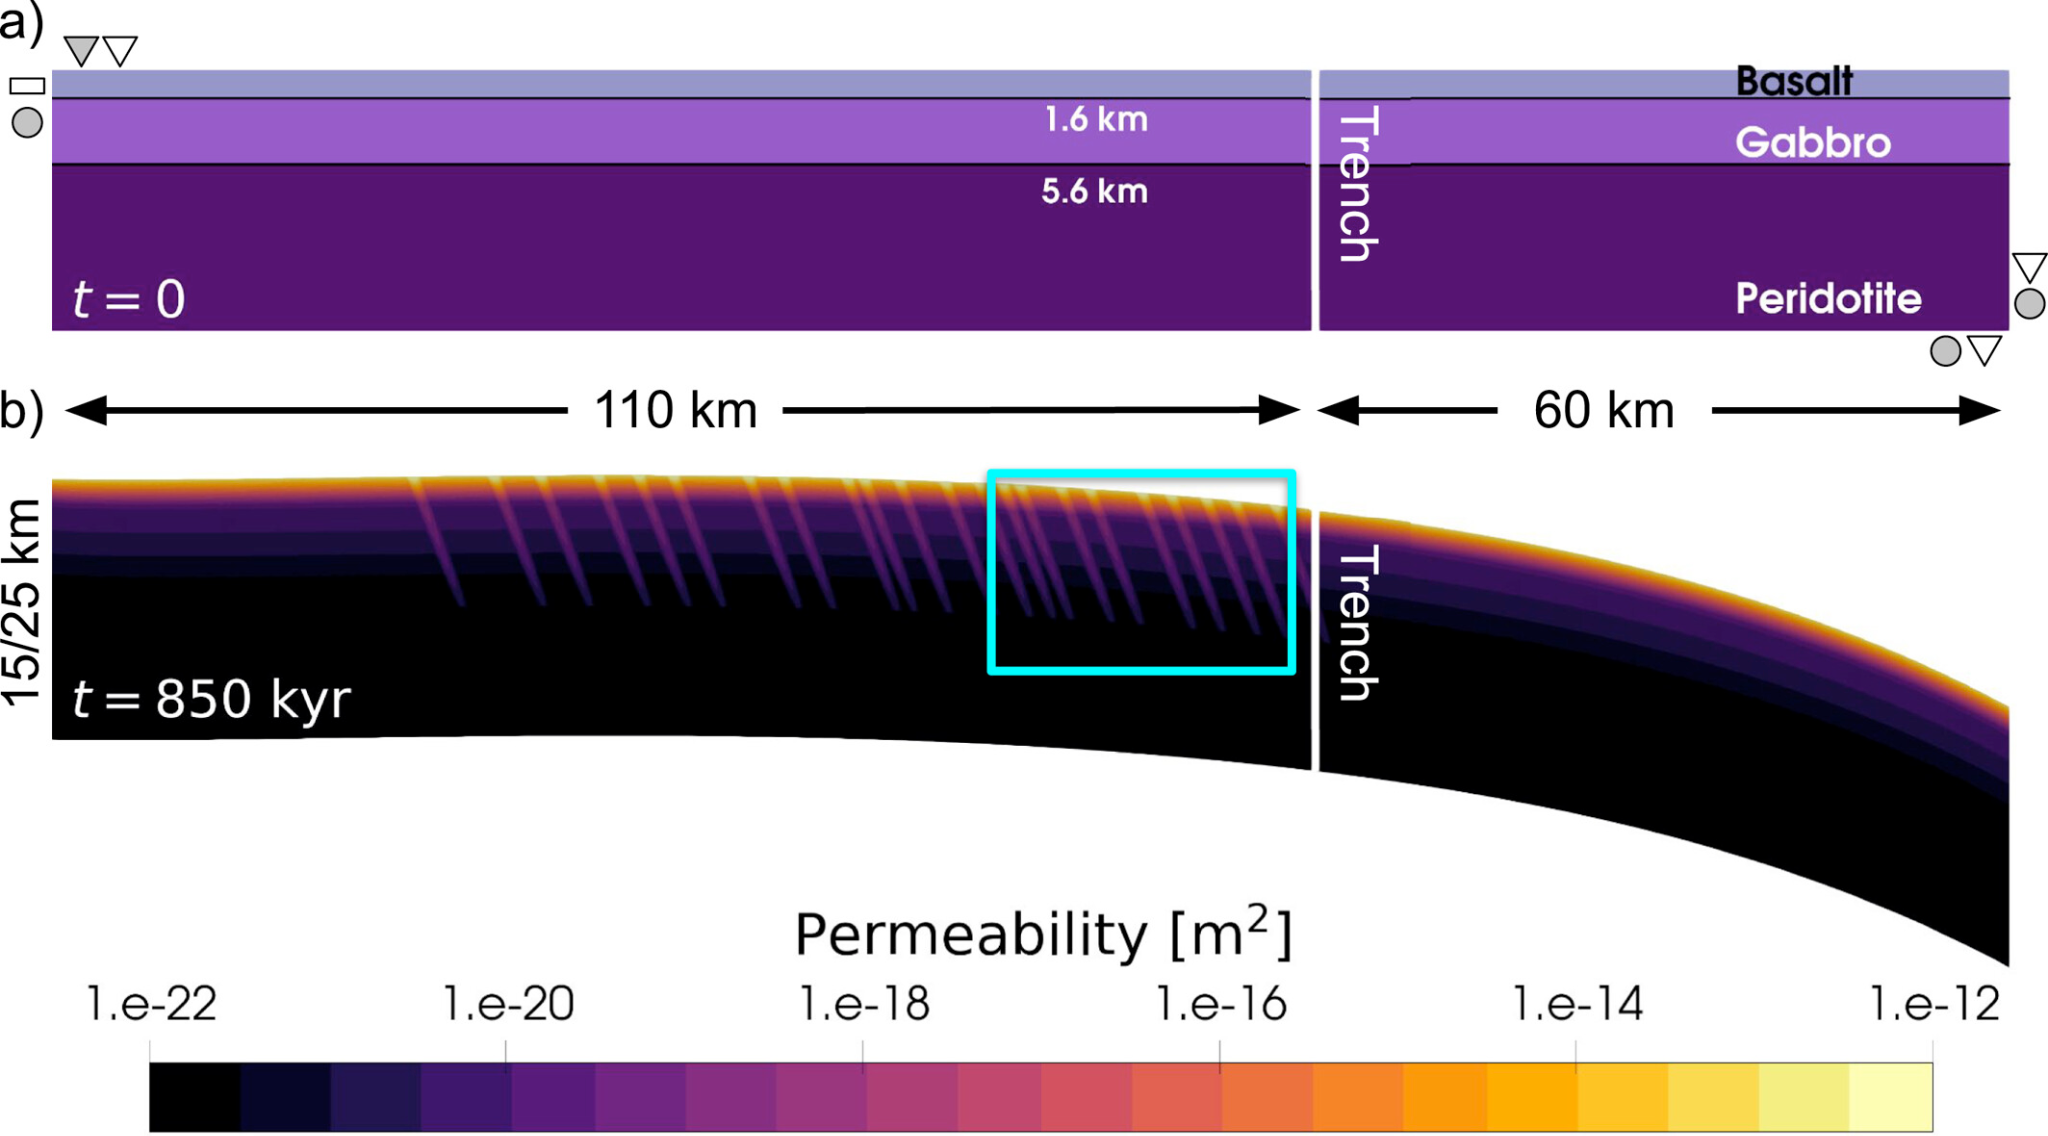
Figure 2: a) The initial model geometry showing the layering of the different rocks, the thicknesses of which are constrained from seismic studies. b) The permeability of the model at the end of the model run-time for the high permeability end member with more permeable fault zones. The cyan box shows the location of the region in the animation.
Modeling spongy subducting crust
To create this model, my co-authours and I start with a 2-D rectangular area that represents the oceanic plate prior to subduction (Figure 2a). Then, we bend the plate to the observed bathymetry within the same region where the volume of water was measured off the coast of Nicaragua (Figure 2b). This effectively reproduces the amount of strain that the rocks are feeling, which will result in the opening/closing of pore space (see animation). Next, we prescribe layers of different materials, which have different strengths, based on the layering of rocks that have been observed using seismic observations (Ivandic et al., 2008). The last thing to test is how “easily” water is able to move downwards through the rocks as pore space is being opened. The way that this can be investigated is by changing the “permeability” of the rocks, a quantity which is not well constrained. A high permeability allows for water to move through the rocks more easily than a low permeability. Therefore, by constraining the permeability of the subducting crust, the models can help to understand how easily water is able to move around a subduction zone. Additionally, because faults are thought to increase the amount of water that can enter the plate, the models test whether increasing the permeability locally within fault zones can help reproduce the observed volume of pore fluid.
The results of the model are shown in Figure 3. The plot shows 4 different panels, each one representing a certain distance from the trench. The X-axis shows the average volume of water at a given depth below the bottom of the seafloor. The blue curves show the observed volume of water, and the other curves show results from the models. The purple curves represent a high permeability end-member, and the gold curves are the low permeability end-member. With decreasing distance from the trench, the higher permeability end-member significantly over-predicts the amount of water entering the subducting crust below a depth of ~3 km. This suggests that, in reality, the stresses being applied to the rocks is high enough to open more pore space, but the water is not able to easily move through the rocks to fill this pore space because the permeability of the rocks is too low.
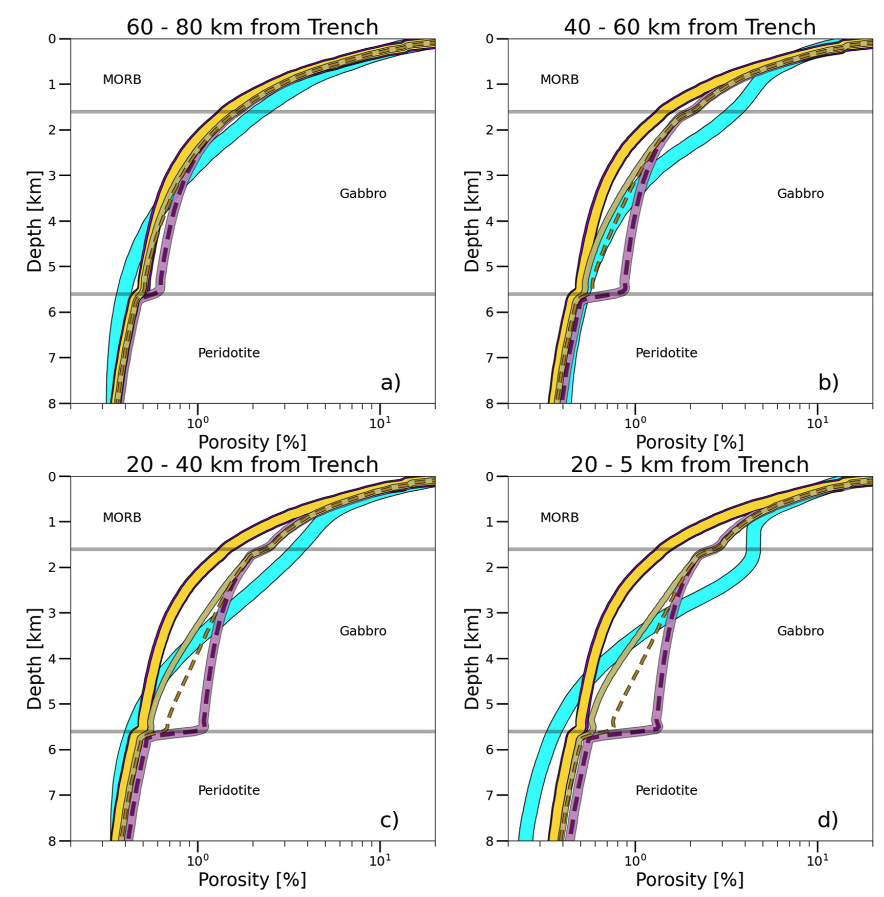
Figure 3: The depth-averaged porosity within distances from the trench for the least permeable end-member (gold curves) and most permeable end-member (purple curves). The dashed lines show models that include more permeable fault zones. Cyan curve shows the observed porosity. Panels show different distances from the trench: a) 60-80 km, b) 40-60 km, c) 20-40 km, and d) 5-20 km.
This has important implications for understanding how water will move through the subduction zone and influence the development of earthquakes and volcanism. Since the permeability of the rocks has to be sufficiently low, this means that water might not be readily able to move around the system after being subducted. This could mean that the water either gets dragged deeper down into the Earth before it is released from the subducting crust, or, that since the fluid is unable to move quickly, that the pore space becomes over-pressurized and results in “hydraulic fracturing”.
You might have noticed that all of the models under-predict the volume of fluid at shallow depths, especially closest to the trench (Figure 3d). The cause of this is most likely that the models do not include the stress effect from creating faults. While the models capture the increased permeability locally within fault zones, they neglect the reality that these high permeability areas are caused by the rupturing of faults, which would necessarily alter the stress state of the rocks. Because the development of pore space is entirely dependent on local changes in stress, and because fault rupture would be most pervasive at shallow depths where stress accumulation is highest, this seems like the most likely reason for the under-prediction in water volume at shallow depths. If you are interested in diving deeper into this topic, check out the publication that this blog post was based off of (Douglas et al., 2026).
References

Douglas, D., Aagaard, B. T., Naliboff, J., & Naif, S. (2026). Constraining the permeability and outer-rise hydration at the Central America Margin. Journal of Geophysical Research: Solid Earth, 131, e2025JB032427. doi:10.1029/2025JB032427

Ivandic, M., I. Grevemeyer, A. Berhorst, E. R. Flueh, and K. McIntosh (2008), Impact of bending related faulting on the seismic properties of the incoming oceanic plate offshore of Nicaragua, J. Geophys. Res., 113, B05410, doi:10.1029/2007JB005291.

Naif, S., K. Key, S. Constable, and R. L. Evans (2015), Water-rich bending faults at the Middle America Trench, Geochem. Geophys. Geosyst., 16, 2582–2597, doi:10.1002/2015GC005927.