Geothermal heat flux is the major unknown when we evaluate the temperature and the presence/absence of water at the bed of the Antarctic Ice Sheet. This information is crucial for the Beyond Epica Oldest Ice project, which aims to find a continuous ice core spanning 1.5 million years (see this previous post). A lot of work has been done* to determine geothermal heat flux under the entire Antarctic ...[Read More]
Image of the Week – A Hole-y Occurrence, the reappearance of the Weddell Polynya
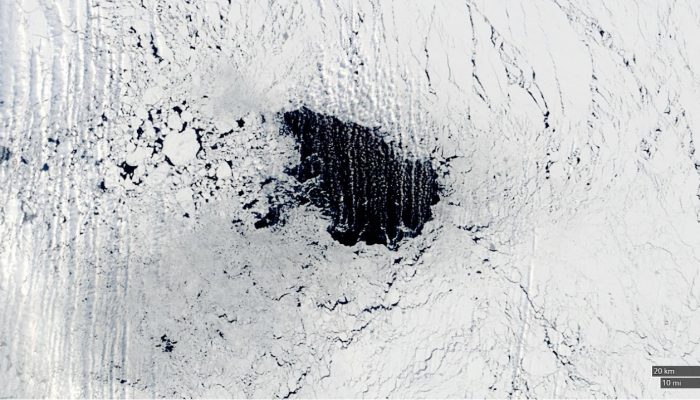
Fig. 1: The Weddell polynya as seen in the 7th September 2017. The size is around 2500 km2. Black areas are sea-ice free (open water) [Credit: NASA].
REMARK: If you’ve enjoyed reading this post, please make sure you’ve voted for it in EGU blog competition (2nd choice in the list)! During both the austral winters of 2016 and 2017, a famous feature of the Antarctic sea-ice cover was observed once again, 40 years after its first observed occurrence: the Weddell Polynya! The sea-ice cover exhibited a huge hole (of around 2600 km2 up to ...[Read More]
Image of the Week – Vibrating Ice Shelf!
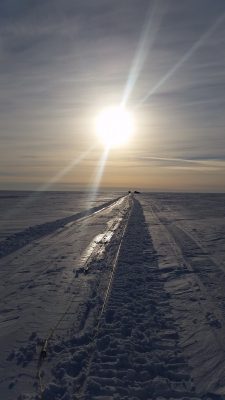
Fig. 1: Geophones in the evening on the Ekström Ice Shelf, Antarctica. These devices are used to record seismic waves that are sent into the ice and bound back [Credit: Emma Smith]
If you listen carefully to the Ekström ice shelf in Antarctica, a strange sound can be heard! The sound of a vibrating truck sending sounds waves into the ice. These sound waves are used to “look” through the ice and create a seismic profile of what lies beneath the ice surface. Read on to find out how the technique works and for a special Cryosphere Christmas message! What are we doing with this ...[Read More]
Image of the Week – Understanding Antarctic Sea Ice Expansion
Sea ice is an extremely sensitive indicator of climate change. Arctic sea ice has been dubbed ‘the canary in the coal mine’, due to the observed steady decline in the summer sea ice extent in response to global warming over recent decades (see this and this previous posts). However, the story has not been mirrored at the other pole. As shown in our image of the week (blue line in Fig. 1), Antarcti ...[Read More]
Image of the Week — Climate change and disappearing ice
The first week of the Climate Change summit in Bonn (COP 23 for those in the know) has been marked by Syria’s decision to sign the Paris Accord, the international agreement that aims at tackling climate change. This decision means that the United States would become the only country outside the agreement if it were to complete the withdrawal process vowed by President Trump. In this context ...[Read More]
Back to the Front – Larsen C Ice Shelf in the Aftermath of Iceberg A68!
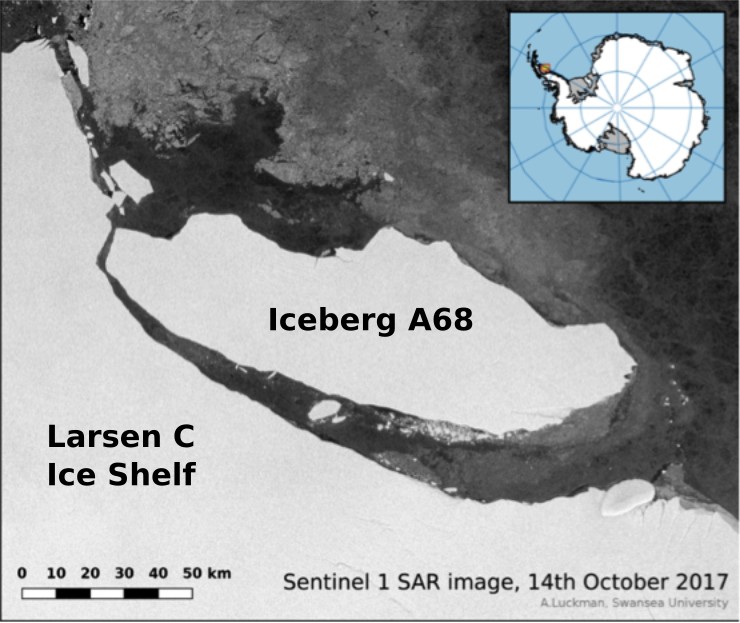
Figure 1: A68 sets sail from Larsen C.
Sentinel 1 SAR image [Credit: Adrian Luckman, Swansea University].
Sentinel 1 SAR image [Credit: Adrian Luckman, Swansea University].
Much of the Antarctic continent is fringed by ice shelves. An ice shelf is the floating extension of a terrestrial ice mass and, as such, is an important ‘middleman’ that regulates the delivery of ice from land into the ocean: for much of Antarctica, ice that passes from land into the sea does so via ice shelves. I’ve been conducting geophysical experiments on ice for over a decade, using mostly s ...[Read More]
Mapping the bottom of the world — an Interview with Brad Herried, Antarctic Cartographer
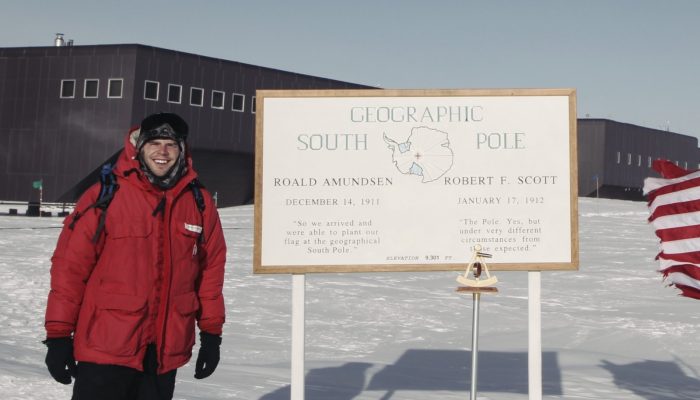
Brad Herried, Antarctic cartographer at South Pole. [Credit: Brad Herried].
Mapping Earth’s most remote continent presents a number of unique challenges. Antarctic cartographers and scientists are using some of the most advanced mapping technologies available to get a clearer picture of the continent. We asked Brad Herried, a Cartographer and Web Developer at the Polar Geospatial Center at the University of Minnesota, a few questions about what it’s like to do this unique ...[Read More]
Image of the Week – See sea ice from 1901!
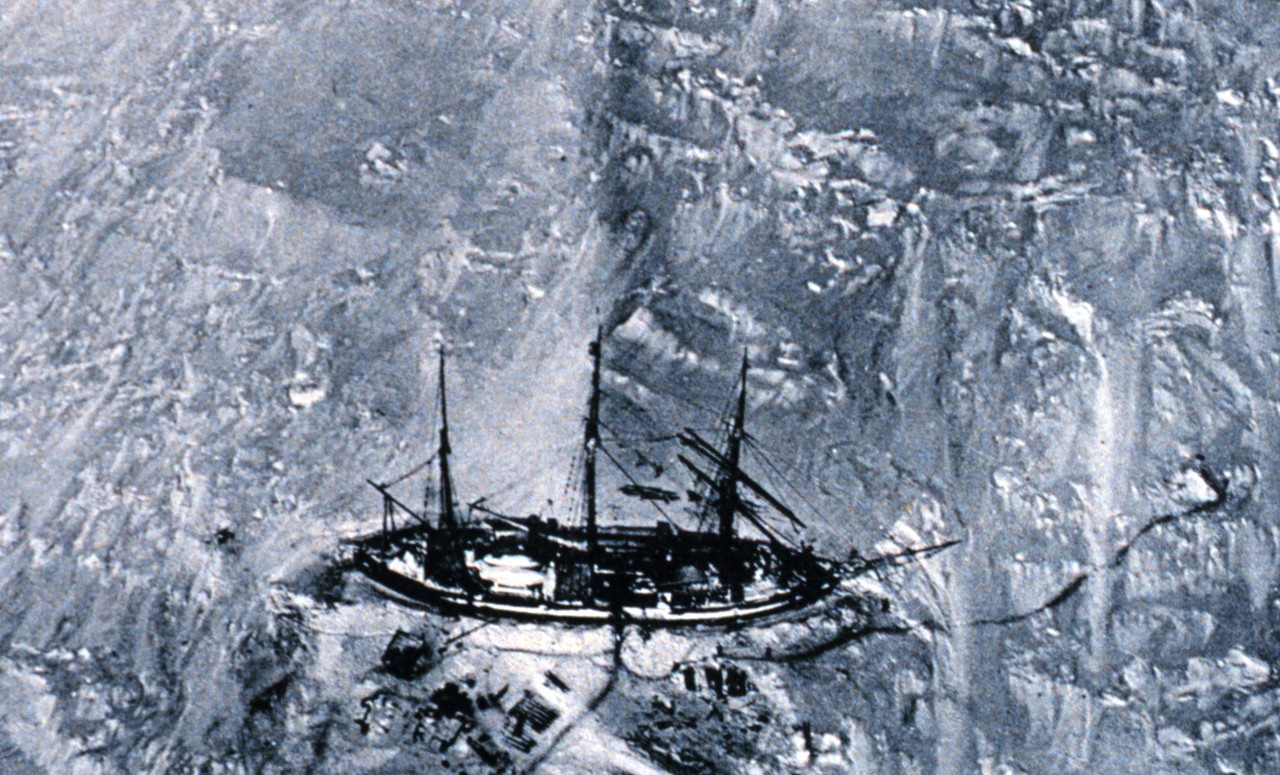
Aerial photograph of the German explorer Erich von Drygalski’s ship, making its way through Antarctic sea ice. This picture was obtained from a hot air balloon in 1901. The log books of this ship were used to study sea-ice conditions at the turn of the century in the Antarctic. [Credit: National Oceanic and Atmospheric Administration/Department of Commerce]
The EGU Cryosphere blog has reported on several studies of Antarctic sea ice (for example, here and here) made from high-tech satellites, but these records only extend back to the 1970s, when the satellite records began. Is it possible to work out what sea ice conditions were like before this time? The short answer is YES…or this would be a very boring blog post! Read on to find out how hero ...[Read More]
Image of the Week – A new way to compute ice dynamic changes
Up to now, ice sheet mass changes due to ice dynamics have been computed from satellite observations that suffer from sparse coverage in time and space. A new method allows us to compute these changes on much wider temporal and spatial scales. But how does this method work? Let us discover the different steps by having a look at Enderby Land in East Antarctica, for which ice velocities are shown i ...[Read More]
Image of the Week — High altitudes slow down Antarctica’s warming
When it comes to climate change, the Arctic and the Antarctic are poles apart. At the north of the planet, temperatures are increasing twice as fast as in the rest of the globe, while warming in Antarctica has been milder. A recent study published in Earth System Dynamics shows that the high elevation of Antarctica might help explain why the two poles are warming at different speeds. The Arctic vs ...[Read More]