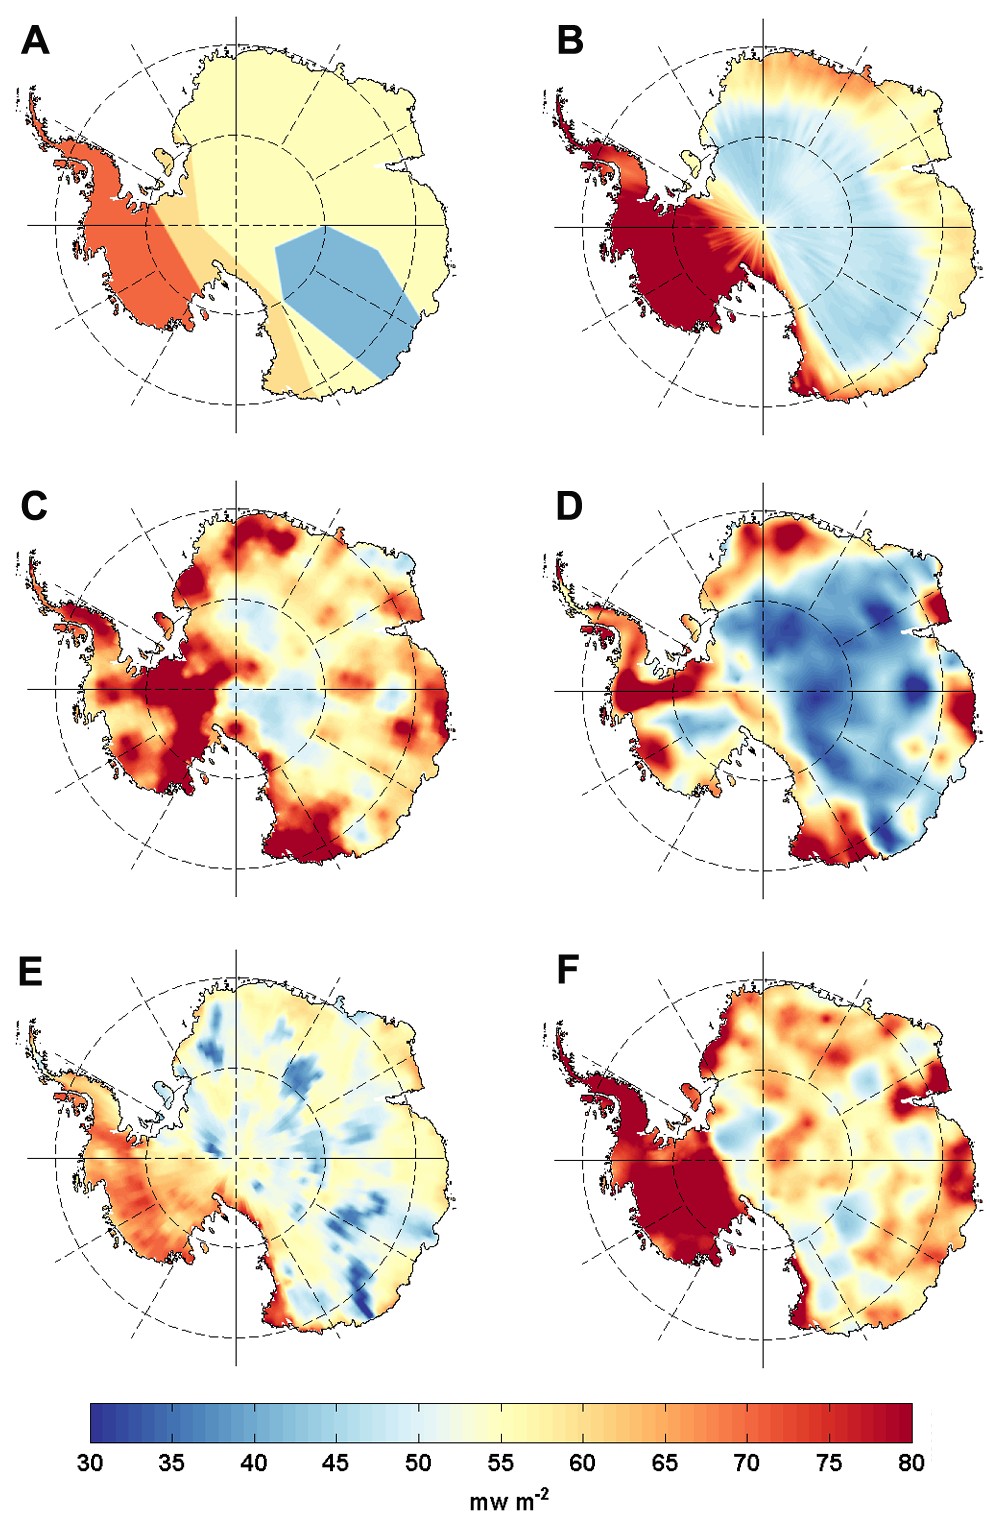
Spatial distributions of geothermal heat flux: (A) Pollard et al. (2005) constant values, (B) Shapiro and Ritzwoller (2004): seismic model, (C) Fox Maule et al. (2005): magnetic measurements, (D) Purucker (2013): magnetic measurements, (E) An et al. (2015): seismic model and (F) Martos et al. (2017): high resolution magnetic measurements. The color scale is truncated at 30 and 80 mW m-2. The black line locates the grounding line. Note, (B)-(F) are in order of publication from oldest to most recent. [Credit: Brice Van Liefferinge, (2018), PhD thesis]
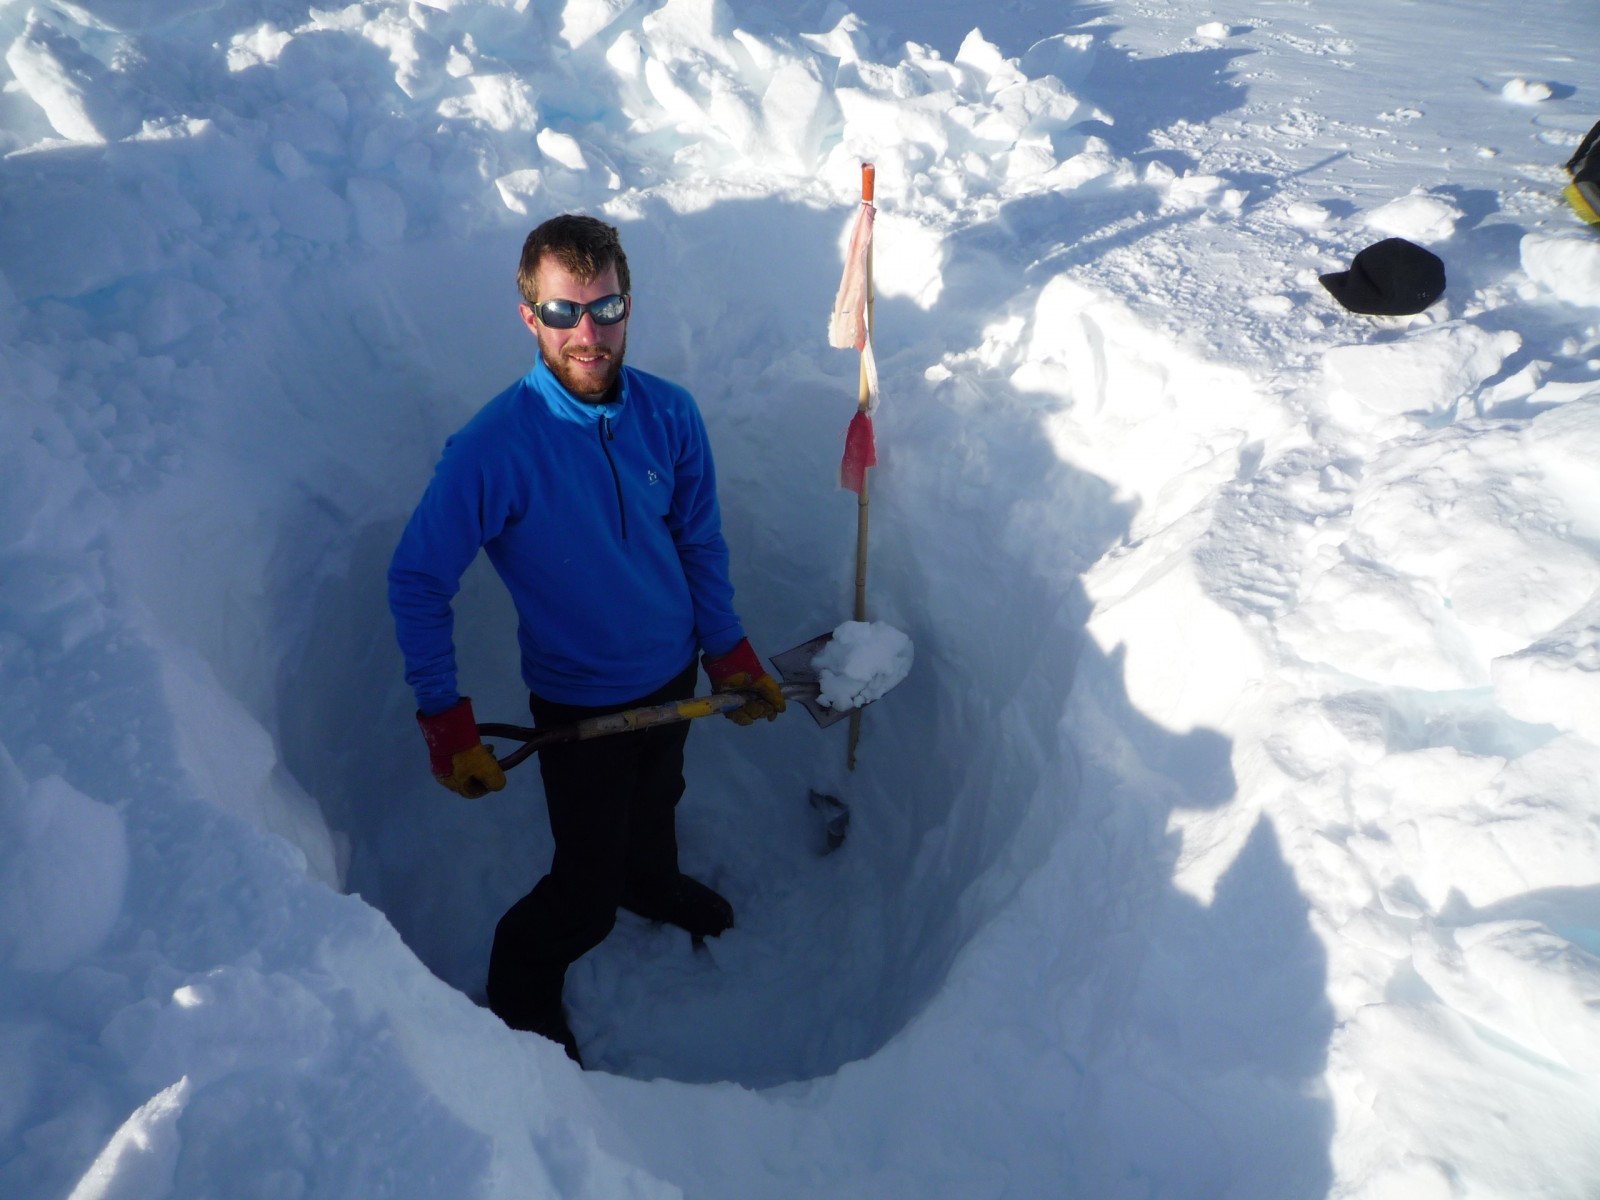
Geothermal heat flux is the major unknown when we evaluate the temperature and the presence/absence of water at the bed of the Antarctic Ice Sheet. This information is crucial for the Beyond Epica Oldest Ice project, which aims to find a continuous ice core spanning 1.5 million years (see this previous post). A lot of work has been done* to determine geothermal heat flux under the entire Antarctic Ice Sheet, and all conclude that additional direct measurements are necessary to refine basal conditions! However direct measurements are difficult to obtain, due to the thick layer of ice that covers the bedrock. Our new image of the week goes over what we currently know about the geothermal heat flux in Antarctica and presents the five data sets that currently exist. But first, let’s see where this heat flux come from?
What determines geothermal heat flux and how can we estimate it?
Heat flux measured at the surface of the Earth has two sources: (i) primordial heat remaining from when the Earth formed and (ii) contemporary-sourced heat coming from radioactive isotopes present in the mantle and the crust. This heat, concentrated in the Earth’s centre, can propagate to the surface through both conduction in the solid earth (inner core and crust) and convection in the liquid-viscous earth (outer core, lower and upper mantles). The net heat flux to reach the surface of the crust and penetrate the overlying ice is what we refer to as the ‘geothermal heat flux’. Wherever the crust is thinner, convection in the mantle can transfer heat more efficiently to the surface. In those locations, the net geothermal heat flux is higher, and vice versa. At mid-ocean ridges and in active volcanic areas, the heat can be delivered almost directly to the surface by advection (i.e. by the movement of magma), therefore leading to a higher net surface geothermal heat flux (think of Iceland, where the shallow crust allows them to take advantage of geothermal heat flux directly).
As a result, we know that the geology determines the magnitude of the geothermal heat flux and the geology is not homogeneous underneath the Antarctic Ice Sheet: West Antarctica and East Antarctica are significantly distinct in their crustal rock formation processes and ages.
Nowadays, five independent global geothermal heat flux data sets exist: Shapiro and Ritzwoller, (2004); Fox Maule et al., (2005); Purucker, (2013); An et al., (2015); Martos et al., (2017) (see image of the week). All geothermal heat flux data sets compiled and currently used have been inferred from the properties of the crust and the upper mantle, as geology dictates the magnitude of geothermal heat flux spatially. Let’s see together how the estimation of geothermal heat flux has evolved over the years….
Using constant values (Panel A)
The simplest method, which consists in using a constant value of geothermal heat flux over the entire continent, was common at first and is still sometimes used (e.g. sensitivity tests and model intercomparison projects) as it facilitates model inter-comparisons. Pollard et al. (2005), in panel A, used bands of constant geothermal heat flux values (70, 60, 55 and 41 mW m-2), with geothermal heat flux decreasing from West Antarctica to East Antarctica, consistent with the known geology.
2004, a seismic model (Panel B)
Shapiro and Ritzwoller (2004) are the first to propose a geothermal heat flux distribution map based on seismic methods, and not strictly on rock composition. They extrapolate the geothermal heat flux from a global seismic model of the crust and the upper mantle which is an analysis of seismicity all over the world. Regions of the globe are grouped by their similarity in seismic structure. Assuming that a certain magnitude of seismicity represents a certain geothermal heat flux value, they assign geothermal heat flux value to regions where geothermal heat flux cannot be directly measured by using geothermal heat flux data from regions of similar seismicity. The geothermal heat flux spatial distribution obtained, with values up to 80 mW m-2 in West Antarctica and 48 mW m-2 in East Antarctica, agrees with that of Pollard et al. (2005). However, errors associated with this method are quite large, reaching 50% of the geothermal heat flux value.
2005, magnetic measurements (Panel C)
A year later, Fox Maule et al. (2005) derive a geothermal heat flux map based on satellite magnetic measurements and a thermal model. The objective is to determine the depth to the Curie temperature, the temperature at which a material loses its permanent magnetic properties. They set the Curie temperature to 580 °C, while the temperature at the ice-bedrock interface is set at 0 °C. Satellite magnetic measurements allow the calculation of the depth of each of these boundaries. The geothermal heat flux is then obtained using a thermal model of the crust between the depth of the two boundary temperatures. This method also has a large associated error, 60% of the geothermal heat flux value for the East Antarctic interior.
2013, reanalysis of magnetic measurements (Panel D)
In 2013, Purucker updates the Fox Maule et al. (2005) geothermal heat flux map with new magnetic data. The spatial geothermal heat flux pattern obtained still retains the characteristic pattern of low values in West Antarctica and high values in East Antarctica, but predicts lower absolute values for East Antarctica and around the West Antarctic coast.
2015, new seismic model (Panel E)
More recently, An et al. (2015) derive a new geothermal heat flux distribution based on seismic velocities. The method is similar to that used by Shapiro and Ritzwoller (2004). They analyse the Earth’s mantle properties using a new 3D crustal shear velocity model to calculate crustal temperatures and the surface geothermal heat flux. However, their spatial distribution of geothermal heat flux differs quite a bit from the other data sets, particularly in East Antarctica where geothermal heat flux values differ by 10 mW m-2 from those of Shapiro and Ritzwoller (2004). An et al. (2015) find very low geothermal heat flux values at the domes, which is good news for the search of Oldest Ice, but rather high overall values for East Antarctica compared to the other data sets. They explain that the model is invalid for geothermal heat flux values exceeding 90 mW m-2. But such high values should only impact young crust areas, mainly West Antarctica and therefore the variability observed in East Antarctica cannot be explained.
2017, high resolution magnetic measurements (Panel F)
In 2017, Martos et al. provide a high resolution geothermal heat flux map based on the spectral analysis of airborne magnetic data. They use a compilation of all existing airborne magnetic data to determine the depth to the Curie temperature and infer the geothermal heat flux using a thermal model. Their continent-wide spatial distribution of geothermal heat flux obtained agrees with previous studies, but they show higher overall magnitudes of geothermal heat flux including East Antarctica. They report an error of 10 mW m-2 which is interestingly smaller than for the other data sets. However, their data set does not take into account point measurements of geothermal heat flux. The same year, Goodge (2017) calculates an average geothermal heat flux value of 48 mW m-2 for East Antarctica with a standard deviation of 13.6 mW m-² from the analysis of clasts in the region between Dome A and the Ross Sea. A geothermal heat flux value of 48 mW m-2 is consistent with the mean value of the data sets described above.
All in all
To sum up, although all geothermal heat flux data sets agree on continent scales (with higher values under the West Antarctic ice sheet and lower values under East Antarctica), there is a lot of variability in the predicted geothermal heat flux from one data set to the next on smaller scales. A lot of work remains to be done …
* (e.g. Shapiro and Ritzwoller, 2004; Fox Maule et al., 2005; Purucker, 2013; An et al., 2015; Fisher et al., 2015; Parrenin et al., 2017; Seroussi et al., 2017; Martos et al., 2017; Goodge, 2017)
References
Van Liefferinge, B., Pattyn, F., Cavitte, M. G. P., Karlsson, N. B., Young, D. A., Sutter, J., and Eisen, O.: Promising Oldest Ice sites in East Antarctica based on thermodynamical modelling, The Cryosphere Discuss., https://doi.org/10.5194/tc-2017-276, in review, 2018.
Van Liefferinge, B. Thermal state uncertainty assessment of glaciers and ice sheets: Detecting promising Oldest Ice sites in Antarctica, PhD thesis, Université libre de Bruxelles, Brussels, 2018.
Edited by Sophie Berger
 Brice Van Liefferinge has just earned his PhD at the Laboratoire de Glaciology, Universite Libre de Bruxelles, Belgium. His research focuses on the basal conditions of the ice sheets. He tweets as @bvlieffe.
Anna
Hello,
For Purucker (2013), you have written “ characteristic pattern of low values in West Antarctica and high values in East Antarctica,” but I think this be the opposite way around, i.e. low values in East Antarctica and high values in West Antarctica.
Cheers,
Anna