When you go down to the woods today you’re in for a big surprise….. hair ice! Did you know that there is a type of ice called hair ice? It is shaped like fine, silky hairs and looks like white candy floss. It grows on the rotten branches of broad-leaf trees during humid winter nights when the air temperature drops slightly below 0°C. A 100-year-old theory states that hair ice a ...[Read More]
Image of the Week – Mushrooms at zero degrees = hair ice?!
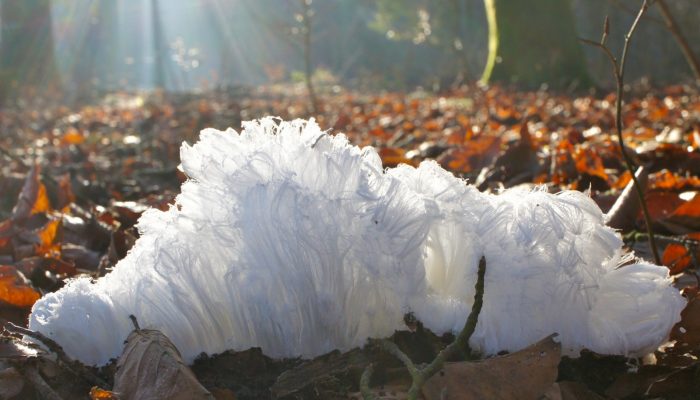
Hair ice in a forest near Moosseedorf, Switzerland (Credit: Christian Mätzler)