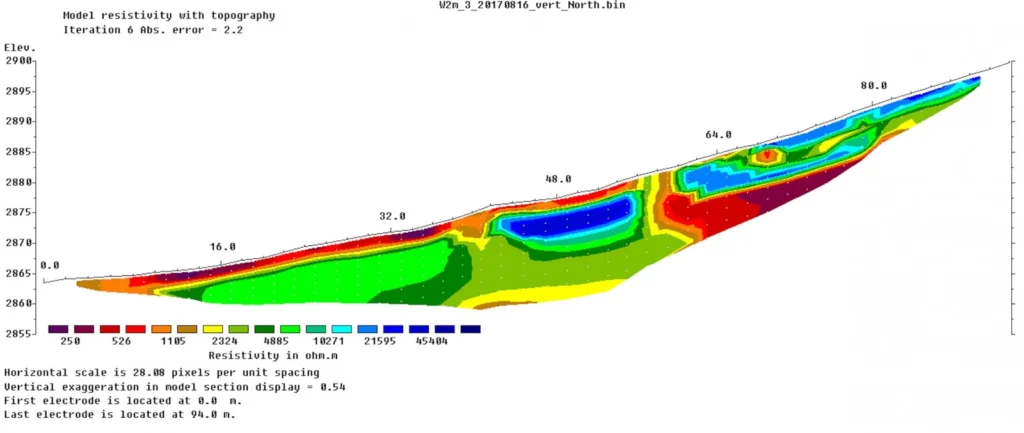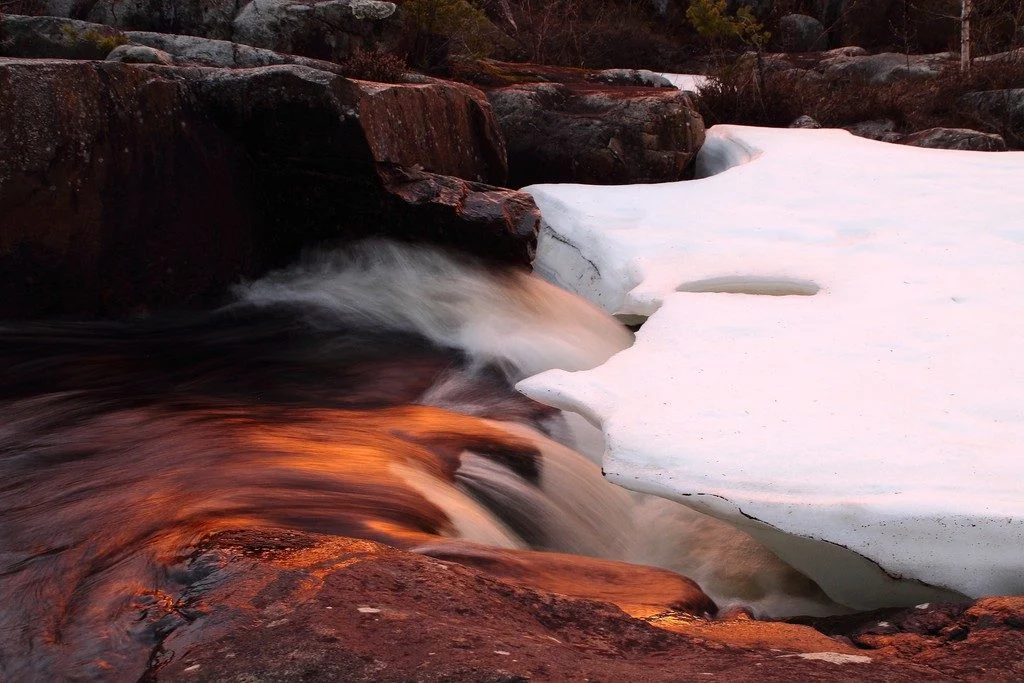
In an earlier post, we talked briefly about below-ground ice and the consequences of its disappearing. However, to estimate the consequences of disappearing ground ice, one has to know that there actually is ice in the area of study. How much ice is there – and where is it? As the name suggests, below-ground …[Read More]
General Public
Image of the Week – ROVing in the deep…
Robotics has revolutionised ocean observation, allowing for regular high resolution measurements even in remote locations or harsh conditions. But the ice-covered regions remain undersampled, especially the ice-ocean interface, as it is still too risky and complex to pilot instruments in this area. This is why it is exactly the area of interest of the paper …[Read More]
Image of the Week – Bioalbedo: algae darken the Greenland Ice Sheet
Most of the energy that drives glacier melting comes directly from sunlight, with the amount of melting critically dependent on the amount of solar energy absorbed compared to that reflected back into the atmosphere. The amount of solar energy that is reflected by a surface without being absorbed is called the albedo. A low albedo …[Read More]
Image of the week – Getting glaciers noticed!
Public engagement and outreach in science is a big deal right now. In cryospheric science the need to inform the public about our research is vital to enable more people to understand how climate change is affecting water resources and sea level rise globally. There is also no better way to enthuse people about science …[Read More]
Image of the Week – See sea ice from 1901!
The EGU Cryosphere blog has reported on several studies of Antarctic sea ice (for example, here and here) made from high-tech satellites, but these records only extend back to the 1970s, when the satellite records began. Is it possible to work out what sea ice conditions were like before this time? The short answer is YES…or …[Read More]
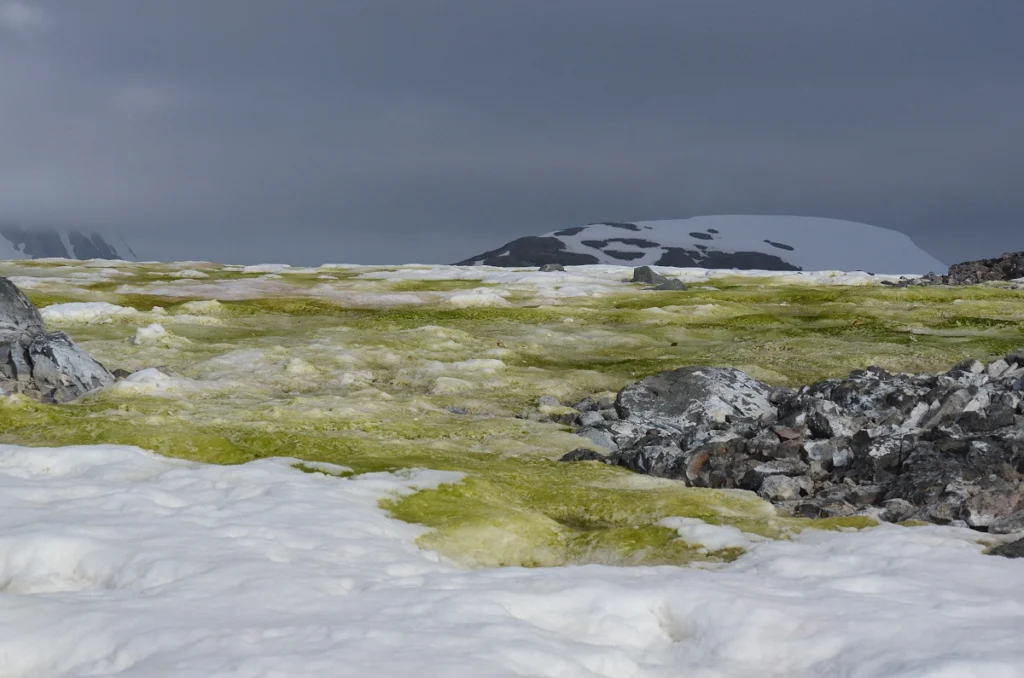
Image of the Week – Fifty shades of snow
When I think of snow, I tend to either think about the bright white ski slopes in the mountains or the large white areas in the Arctic. However, natural phenomena can lead to colorful snow. Our Image of the Week shows snow can be green! Snow can also turn orange, pinkish, grey and even yellow… …[Read More]
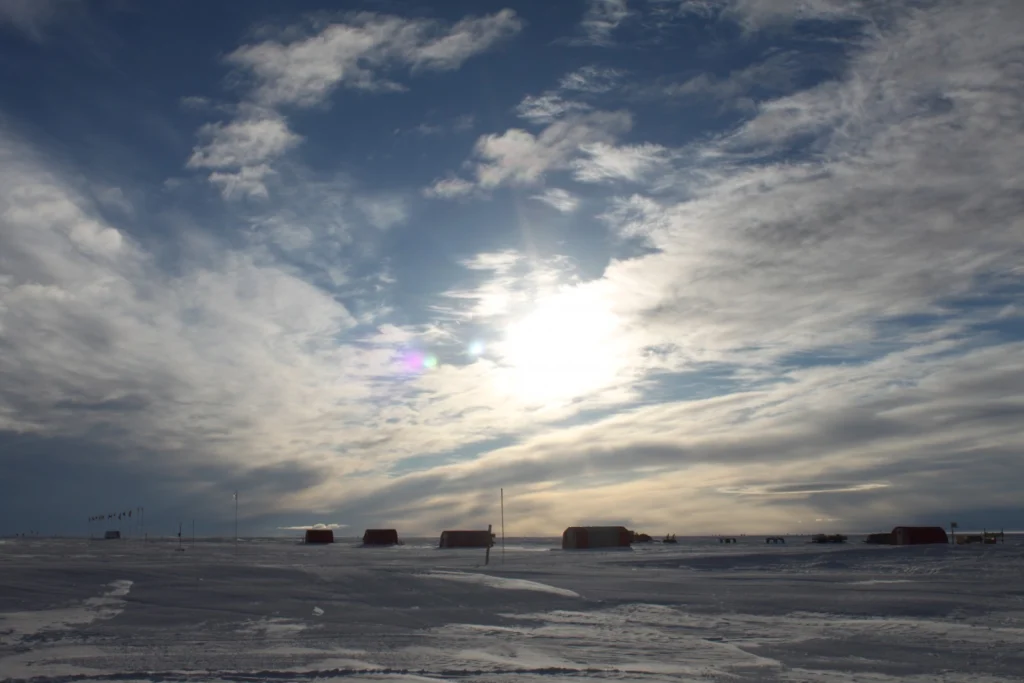
Image of the Week – Summer is fieldwork season at EastGRIP!
As the days get very long, summer is a popular season for conducting fieldwork at high latitudes. At the North East Greenland Ice Stream (NEGIS), the East Greenland Ice-core Project (EastGRIP) is ongoing. Several scientists are busy drilling an ice core through the ice sheet to the very bottom, in continuation to previous years (see …[Read More]
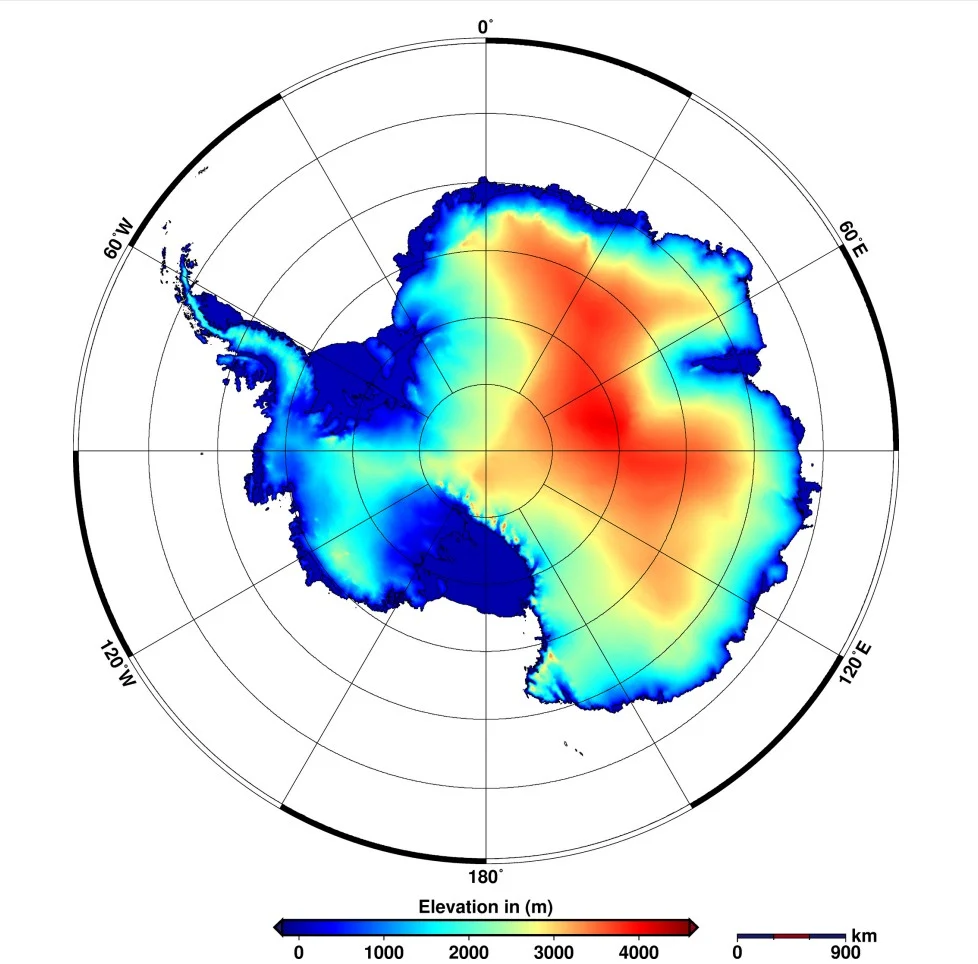
Image of the Week — High altitudes slow down Antarctica’s warming
When it comes to climate change, the Arctic and the Antarctic are poles apart. At the north of the planet, temperatures are increasing twice as fast as in the rest of the globe, while warming in Antarctica has been milder. A recent study published in Earth System Dynamics shows that the high elevation of Antarctica …[Read More]
Image of the Week – A rather splendid round-up of CryoEGU!
The 2017 edition of the EGU general assembly was a great success overall and for the cryospheric division in particular. We were for instance thrilled to see that two of the three winning photos of the EGU Photo contest featured ice! To mark the occasion we are delighted to use as our image of this …[Read More]
Quantarctica: Mapping Antarctica has never been so easy!
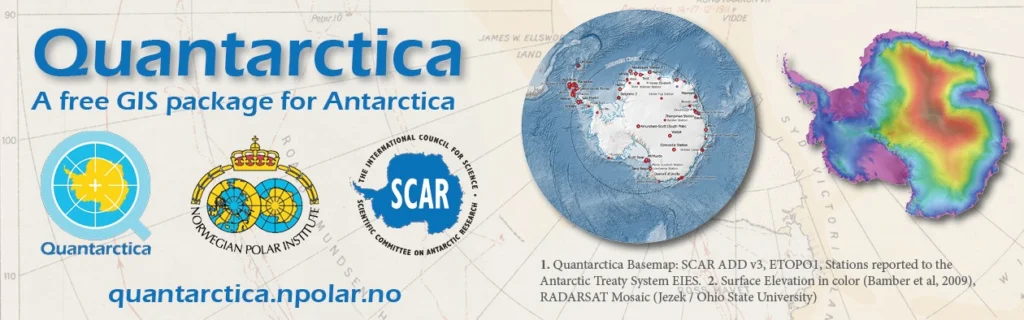
One of the most time-consuming and stressful parts of any Antarctic research project is simply making a map. Whether it’s plotting your own data points, lines, or images; making the perfect “Figure 1” for your next paper, or replying to a collaborator who says “Just show me a map!,” it seems that quick and effective …[Read More]