
Born on this Day On this day in 1872 – 145 years ago –Ludvig Mylius-Erichsen, Danish author and polar explorer, was born. He led two expeditions to Greenland and successfully mapped the then unknown northeastern part of the country. The second expedition was his last. The expedition was surprised by an early onset of spring and could no longer use their dog sledges. The two Danes, Mylius-Eri ...[Read More]
Image of the Week – The Sound of an Ice Age
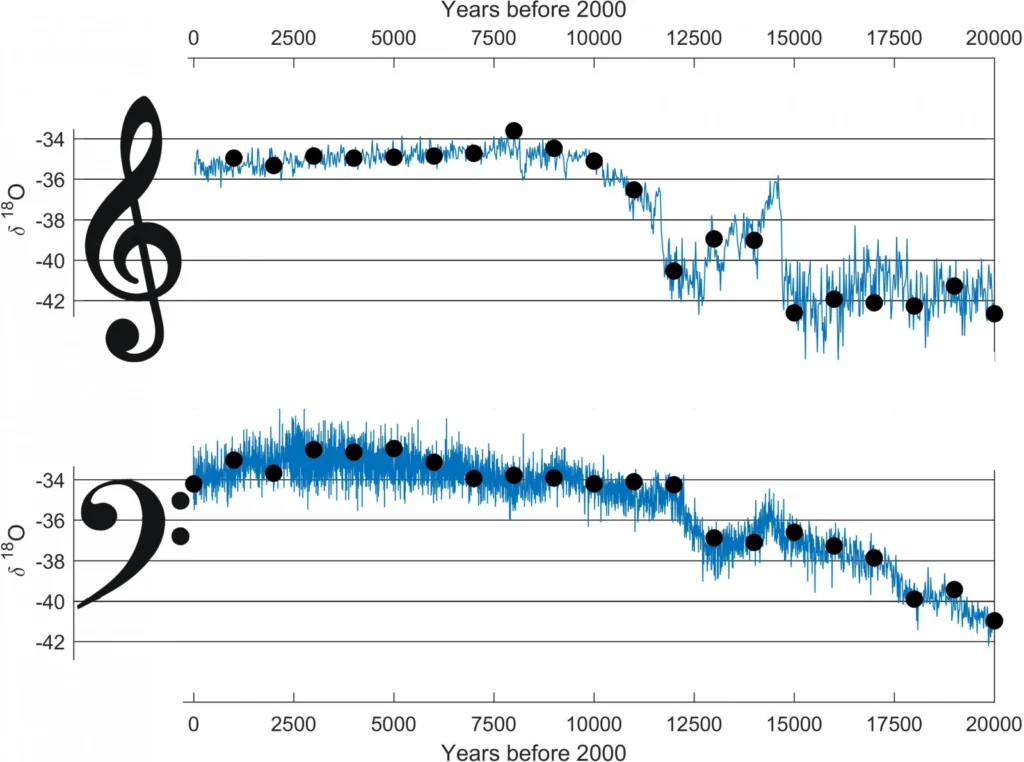
New Year’s Eve is just around the corner and the last “image of the week” of 2016 will get you in the mood for a party. If your celebration needs a soundtrack with a suitably geeky touch then look no further. Here is the music for climate enthusiasts: The sound of the past 60,000 years of climate. Scientist Aslak Grinsted (Centre for Ice and Climate, University of Copenhagen, Denmark) has transfor ...[Read More]
Image of the Week — Listening to the Snow
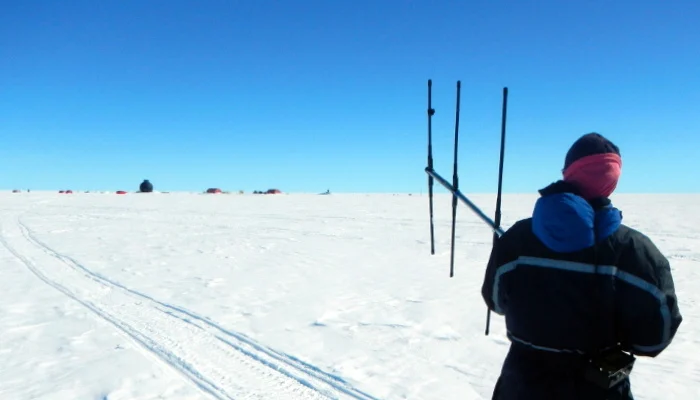
When working in the middle of an ice sheet, you rarely get to experience the amazing wildlife of the polar regions. So what are we doing hundreds of kilometres from the coast with an animal tracker device? We are listening to the snow of course! It is not crazy; It is what Image of the Week today is all about! Going Wireless In June 2016, Liz Bagshaw and I travelled to the EGRIP (East Greenland Ic ...[Read More]
Image of The Week – Ballooning on the Ice
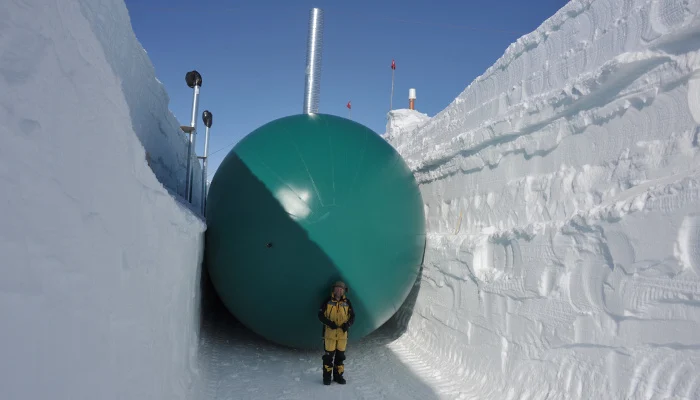
A curious experiment is taking place in Greenland. An experiment involving very large balloons and – of course – a lot of snow. Read on to discover why balloons are an environmentally friendly tool when constructing an ice core drill camp. Last year, a small team traversed 400km from northwest Greenland to the EastGRIP site (read more about the traverse here). This year another strenuous task is w ...[Read More]
An Antarctic Road Trip
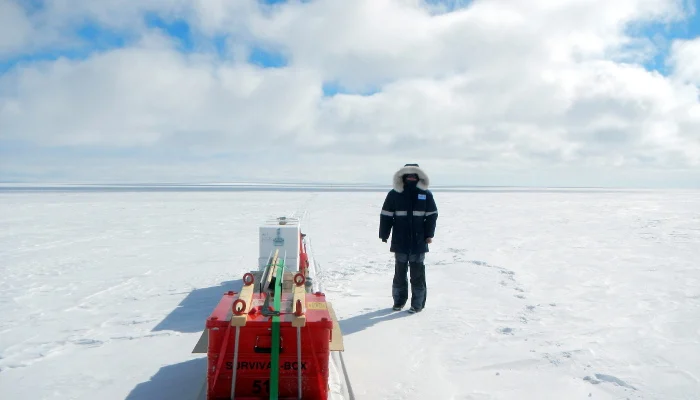
Working in the Arctic and Antarctic presents its own challenges. It is perhaps easy to imagine how a station situated close to the coast is resupplied: during the summer, one or more ships will arrive bringing fuel, food and equipment, but what about stations inland? Flying in supplies by aircraft is expensive and, in the case of large quantities of fuel, unsustainable. Besides, many stations are ...[Read More]
Image of the Week: The Bipolar Seesaw
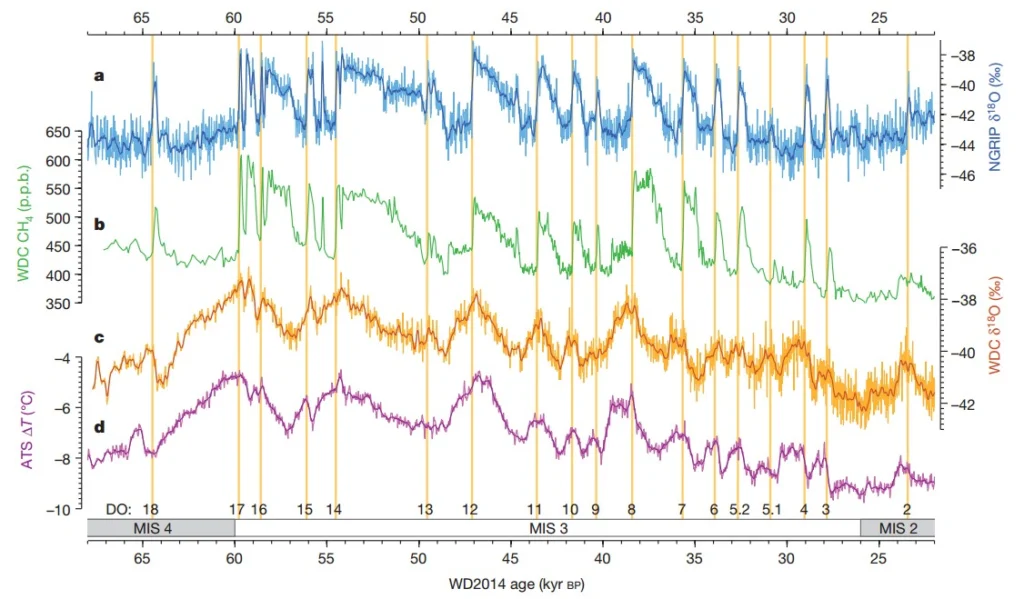
The colourful graphs above show how the climate changed in the period from 65 to 25 thousand years ago when Earth was experiencing an ice age. A wealth of information on the dynamics of our climate is embedded in the curves, especially how the northern and southern hemisphere interact, and how fast climate can change. The figure represents thousands and thousands of hours of work by scientists, te ...[Read More]
What to do at EGU — a guide for early-career scientists
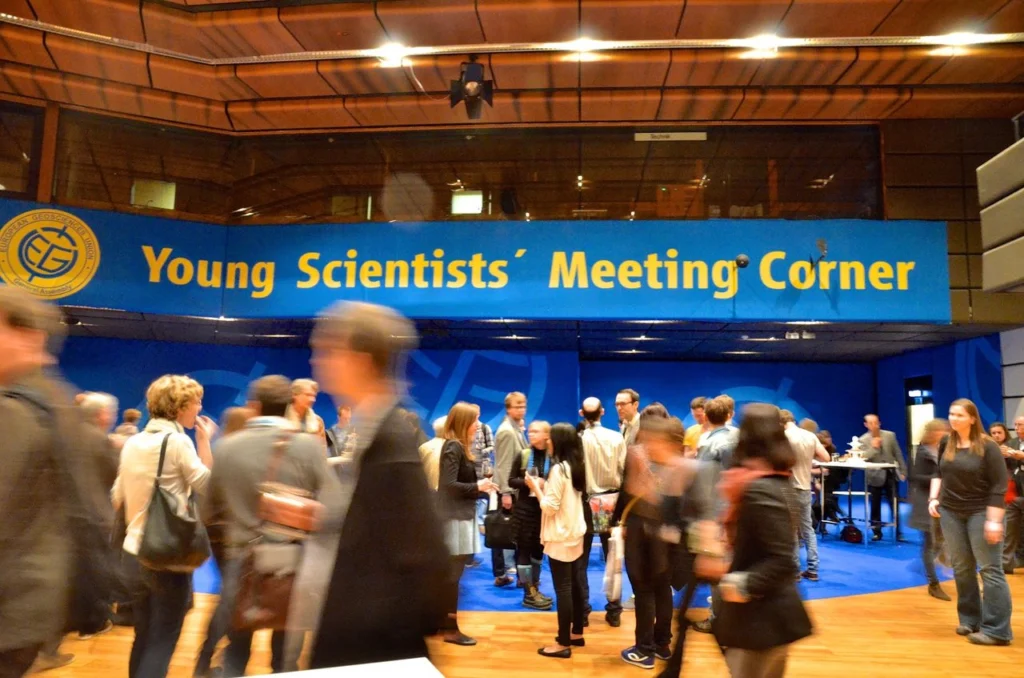
Are you going to the EGU General Assembly in Vienna next week? Check out these events for early career scientists. To remind you when and where all these nice events and activities take place, you can directly view and import them in your electronic calendar (Isn’t it wonderful?! :-)) Social event for Early Career Cryosphere Scientists! If you cannot make it to anything else; make it to our ...[Read More]
Image of Week: Blue Ice in East Antarctica
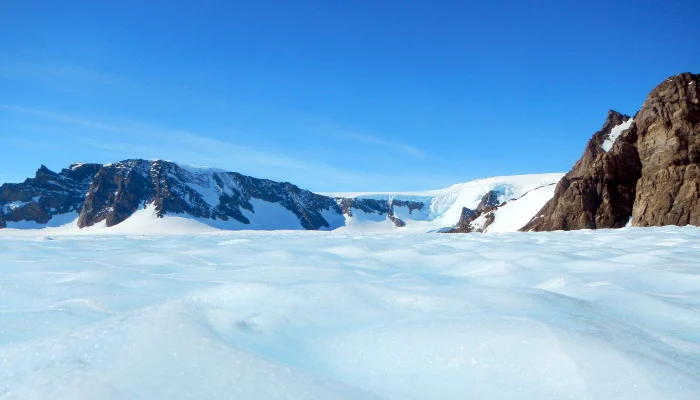
The blue ice areas of Antarctica are one of the most fascinating parts of the ice sheet. In these regions, snowfall is so low that the ice is laid bare by the wind and consequently sublimates. This exposes beautiful, blue ice surfaces, like an ocean frozen in time. This picture was taken at a site named “Windy Corner” by the Kottas Mountains, in the northernmost part of the Heimefrontf ...[Read More]
Image of the Week: Ice Sheets in the Climate
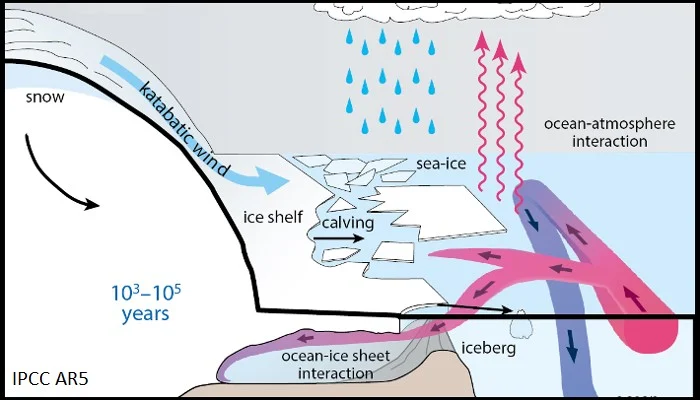
Ice sheets play a central role in the climate system. They store significant amounts of fresh water and are the conveyor belts for transporting snow that accumulates on land back into the oceans. The figure above shows a few of the ice-climate interactions. In the figure below (click on the figure for full resolution) we see the complete picture of the processes taking place between ice sheets, so ...[Read More]
Image of the Week: Atmospheric CO2 from ice cores
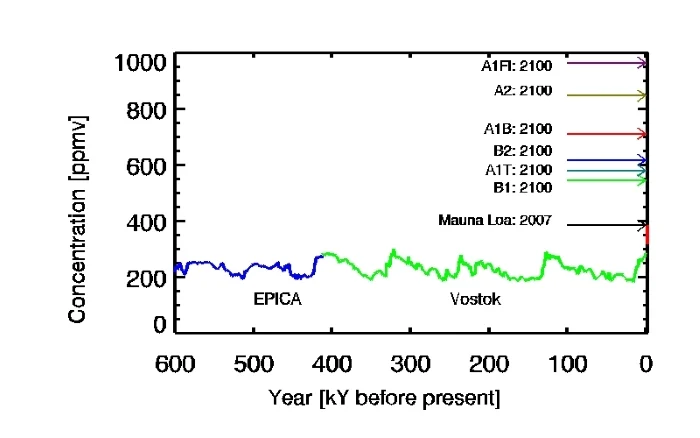
The measurements of atmospheric CO2 levels at Manu Loa, Hawaii read 401.01ppm on the 7th of December this year. To understand the significance of this number, you just need to look at the figure above from the 4th IPCC report. It shows the changes in CO2 concentrations during the past 800,000 years based on ice core measurements. Values have fluctuated between 190ppm and 280ppm. In other words, bo ...[Read More]