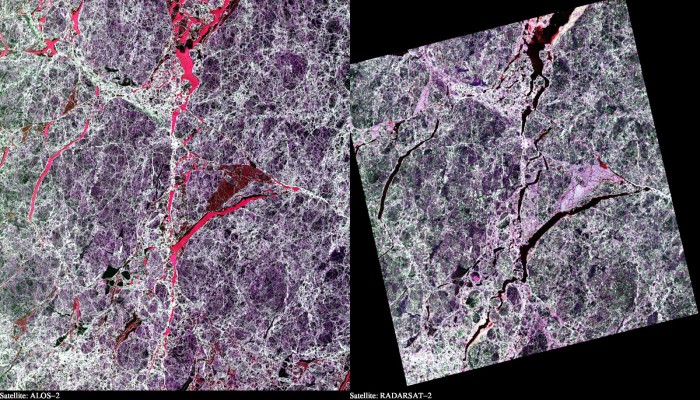
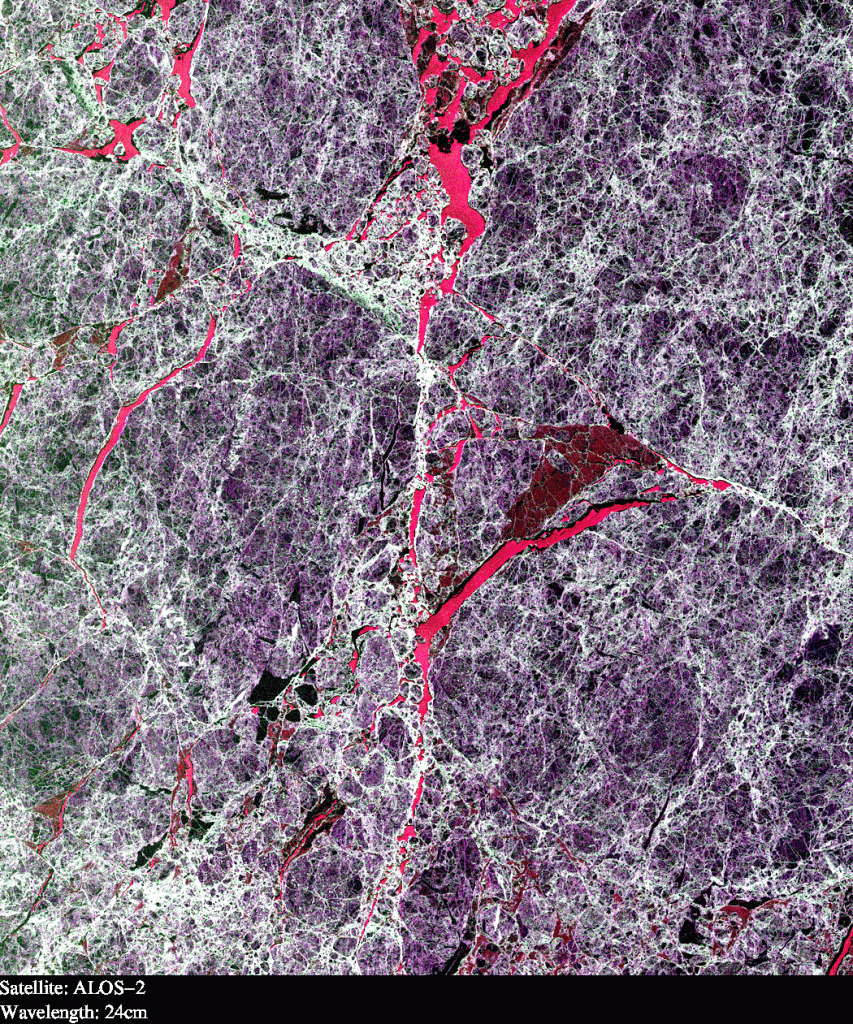
This illustration shows two Synthetic Aperture Radar (SAR) images taken over sea ice in the Arctic Ocean. Both images are polarimetric and the different colours reflect the different polarimetric channels of the SAR (red = VV, green = HV and blue = HH).
The two images are from the two satellites “ALOS-2” and “RADARSAT-2”. These are equipped with radars that operate at wavelengths around 24 cm and 6 cm, respectively. As can be seen, certain types of sea ice appear very different due to this difference in radar wavelength. In particular, leads in the ice, that is, open or refrozen cracks, appear very red for the longer wavelength, but dark for the shorter wavelength. A full understanding of what causes these differences is still not complete, but could help monitor ice properties, such as thickness and salinity, with satellites. These properties are in turn crucial for climate scientists.
Further information see : Grahn et al. 2015, Proceedings of “ESA PollinSAR 2015”
Credits:
– Processing: Jakob Grahn, Earth Observation Laboratory, University of Tromsø
– Includes material ©JAXA 2015, Included ©JAXA 2015, © PASCO, ©RESTEC
– RADARSAT-2 Data and Products © MacDonald, Dettwiler and Associated Ltd., 2015 – All rights reserved. Radarsat-2 data is provided by Norwegian Space Centre/Kongsberg Satellite Services under the Norwegian-Canadian Radarsat agreement 2015.


Pingback: Cryospheric Sciences | Image of the Week – Monitoring icy rivers from space!