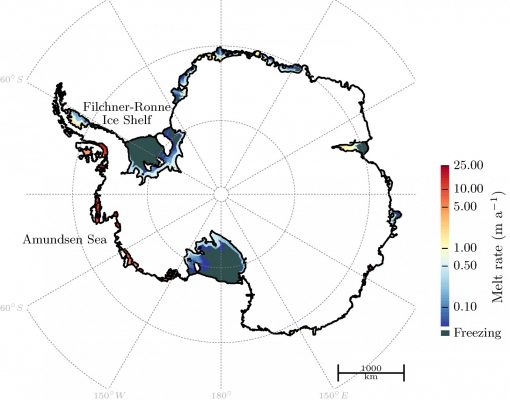
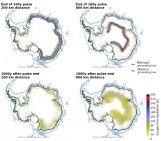
The Antarctic ice sheet stores a large amount of water that could potentially add to sea level rise in a warming world (see this post and this post). It is currently losing ice, and the ice loss has been accelerating in the past decades. All this is linked to the melting of ice – not at the surface but at the base, underneath the so-called ice shelves which form the continuation of the Antarctic ice sheet over the ocean. These floating ice shelves (represented in color in our Image of the Week) are melted by ocean water from underneath. How can this process called ‘sub-shelf melting’ be included in ice-sheet models? One simple way is to divide the ice-shelf cavity into a number of ocean boxes. Let’s briefly see how it works.
How to model sub-shelf melting in ice-sheet models?
There are three main ways to do so – which way is most suitable depends on the application:
-
The most elaborated approach is to use ocean models that resolve ocean dynamics underneath the ice shelves. However, they need a lot of computational power.
-
As an alternative, simple parameterizations in which melting is a function of the depth of the ice-shelf base can be used. However, such parameterizations are for many applications too simple…
-
Recently, intermediate approaches that include the basic ocean dynamics have been developed (e.g. Lazeroms et al., 2018; Pelle et al., in review). One such approach is the ocean box model (Olbers and Hellmer, 2010) that we extended for the use in an ice-sheet model. Our extension is called Potsdam Ice-shelf Cavity mOdel (PICO, Reese et al., 2018).
In the following, we take a closer look into the approach of PICO…
“Boxing” the cavity circulation
In Antarctic ice-shelf cavities (i.e. the water below the ice shelves), in general, an overturning circulation transports ocean water from the sea floor along the ice-shelf base towards the calving front (see Figure 2). It is driven by the “ice-pump” (Lewis and Perkin, 1986): ice melting near the grounding line (separation between the grounded ice sheet and the floating ice shelf) reduces the density of the ambient water. It becomes buoyant and rises along the shelf base towards the ocean. Through this process, new water from outside of the ice-shelf cavity is “pumped” along the continental shelf towards the grounding line. This leads to the typical pattern of highest melting near the deep grounding lines and lower melting towards the calving front.

Figure 2: Schematic showing the ocean boxes following the ice-shelf base, with the first box B1 near the grounding line, and the last box Bn at the calving front. The arrows indicate the overturning circulation. The ocean water enters the cavity from box B0 which is at depth of the continental shelf, in front of the ice shelf. [Credit: Fig. 1 of Reese et al. (2018)]
By dividing the ice-shelf cavity into 2 to 5 ocean boxes, the transport of the overturning circulation is simplified while the sub-shelf melt pattern is captured. The open ocean conditions are simply represented by the ocean reservoir box B0 (Figure 2). And the circulation is driven by the differences in water density between the ocean reservoir (B0 in Figure 2) and the first box near the grounding line (B1 in Figure 2). The model computes sub-shelf melting successively over the ocean boxes, starting near the grounding line.
Sub-shelf melting with PICO
Sub-shelf melting can vary a lot in-between ice shelves (Figure 1). Antarctic ice-shelf cavities can roughly be sorted into two types (Joughin et al., 2012). The first category are the cold cavities in which the ocean water is close to the freezing point and in which sub-shelf melting is generally low, about 0.1 meter per year. The second category are warm cavities which have a temperature of about 1 degree – that does not sound like much, but for an ice shelf, this feels like being in a sauna – and sub-shelf melting can easily exceed 10 meters per year. Small changes in ocean temperatures can hence have large effects on sub-shelf melting. An increase in sub-shelf melting thins the ice shelf, as for example observed in the Amundsen Sea region in West Antarctica (see this post). The ice shelves there are examples for warm cavities, and a cold cavity is, for instance, underneath the Filchner-Ronne Ice Shelf (see Figure 1 for the specific locations).
In reality, of course, things are much more complicated than simulated by our PICO model. For example, the Coriolis effect can influence ocean circulation in the cavities, sills in the bed can block access of warm water to the grounding line and so on…
Applications of PICO
To summarize, PICO is a simple and efficient modeling tool that can capture the general pattern of sub-shelf melting observed in Antarctica today. Being implemented in the Parallel Ice Sheet Model, it is openly available, so if you got excited about what it can do and want to use it yourself, you’re welcome to download it!
Further reading
-
Olbers, D. and H Hellmer (2010). A box model of circulation and melting in ice shelf caverns. Ocean Dynam., 60.
-
Reese, R, T Albrecht, M Mengel, X Asay-Davis, and R Winkelmann (2018). Antarctic sub-shelf melt rates via PICO. The Cryosphere 12.
-
Joughin, I., R B Alley, and D M Holland (2012). Ice-Sheet Response to Oceanic Forcing. Science, 338, 1172–1176.
-
Lewis, E L and R G Perkin. 1986. Ice pumps and their rates. J. Geophys. Res., 91, 11756–11762.
-
Asay-Davis, X S, N, N Jourdain, and Y Nakayama (2017). Developments in Simulating and Parameterizing Interactions Between the Southern Ocean and the Antarctic Ice Sheet. Curr Clim Change Rep 3: 316.
-
Image of the Week – Antarctica: A decade of dynamic change
-
Image of the Week – Quantifying Antarctica’s ice loss
- Image of the Week – Oh Sheet!
Edited by David Docquier
 Ronja Reese is a postdoctoral researcher at the Potsdam Institute for Climate Impact Research, Germany, in the group of Prof. Dr. Ricarda Winkelmann. She investigates ice dynamics in Antarctic with a focus on ice-ocean interactions and ice-shelf buttressing. She developed and implemented PICO together with Ricarda Winkelmann, Torsten Albrecht, Matthias Mengel and Xylar Asay-Davis. Contact Email: ronja.reese@pik-potsdam.de
Teng Li
Well done! Ronja
Chris Byers
Loved this piece. Can’t wait to read your next blog 🙂