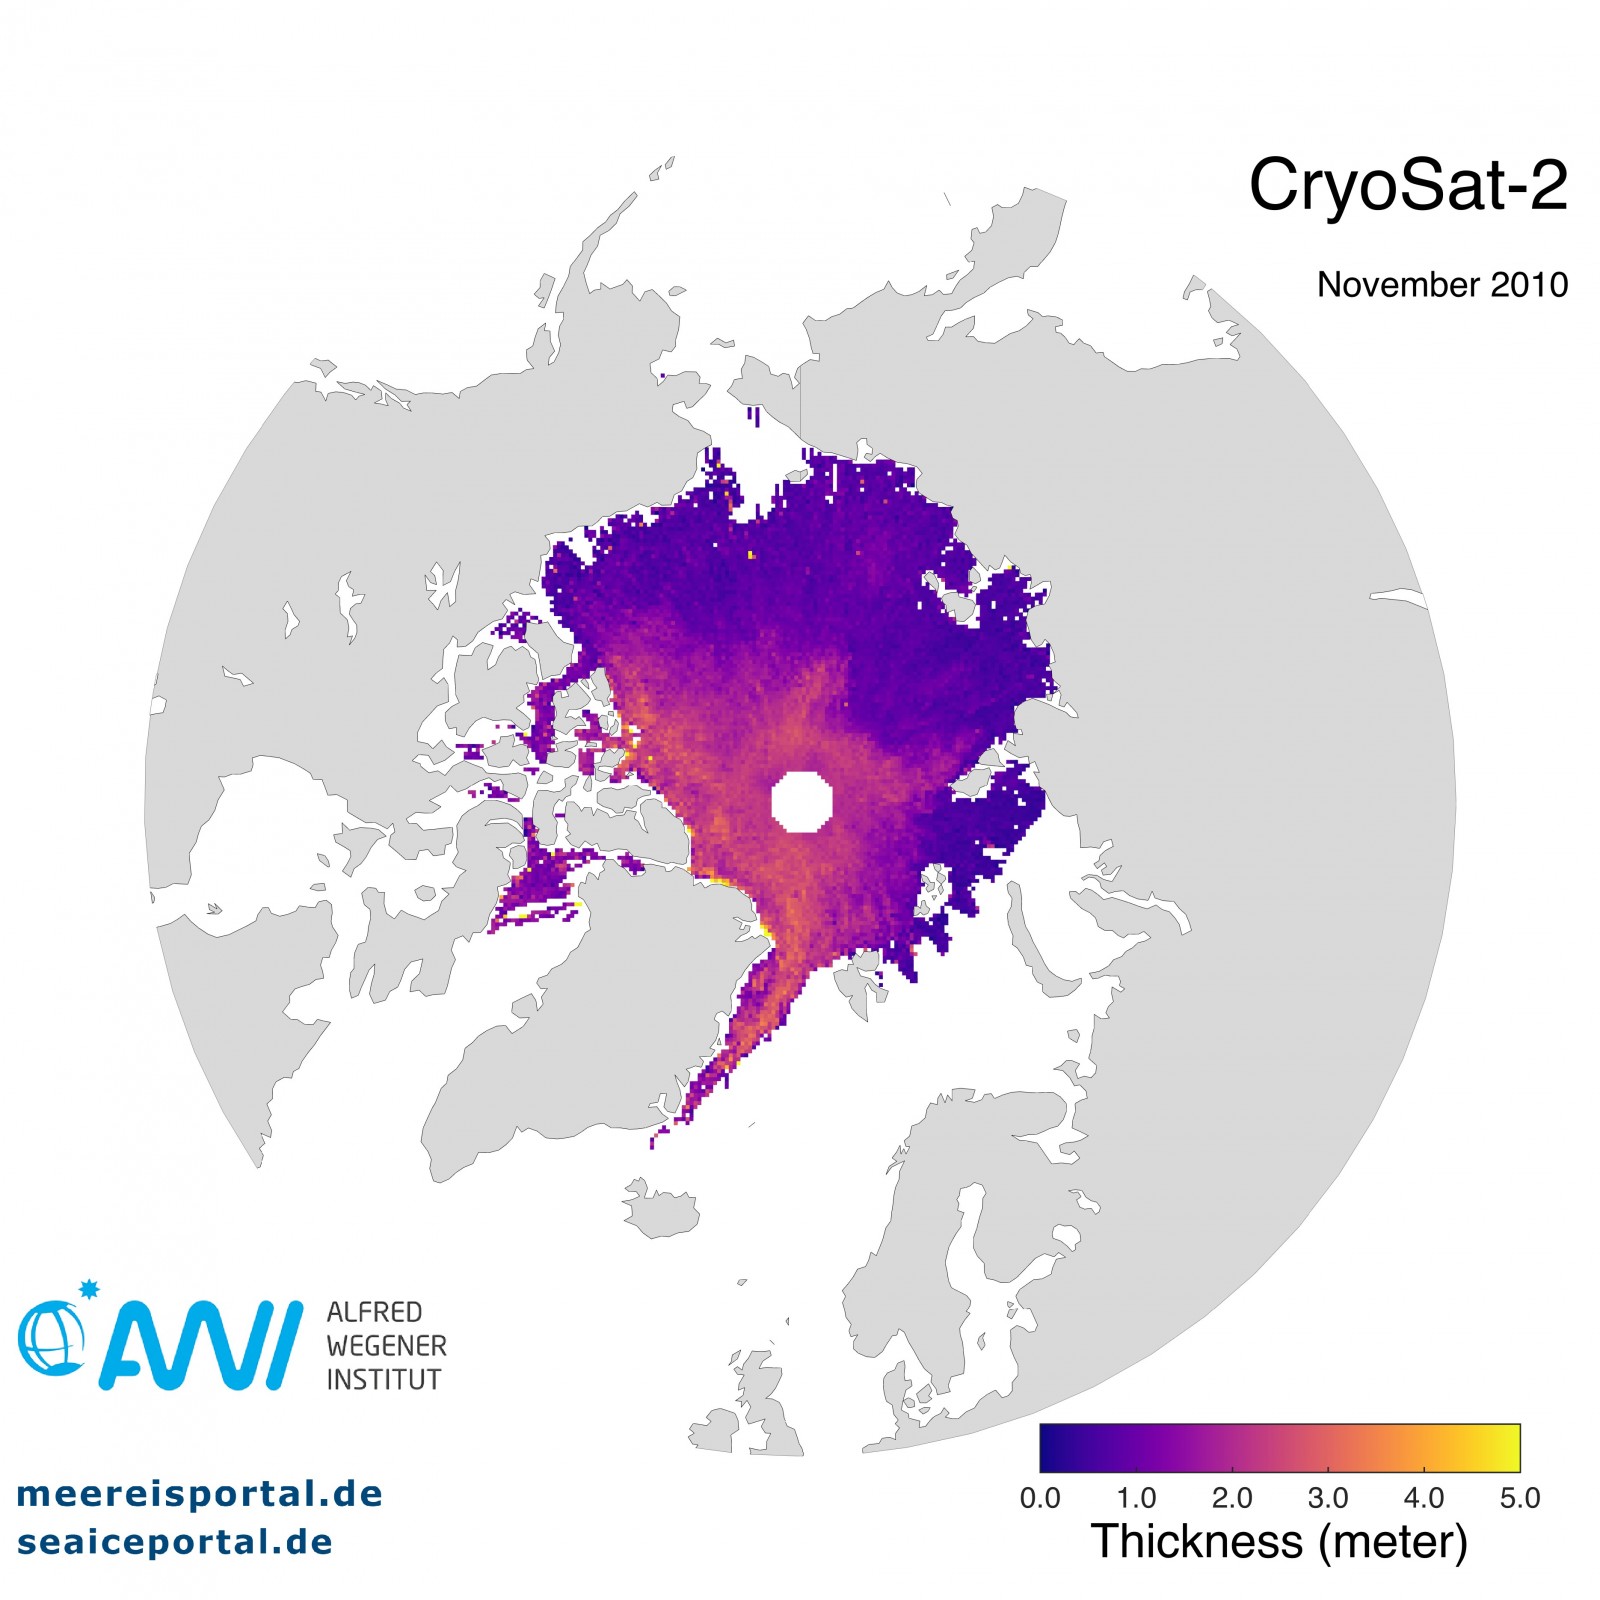
Have you ever stumbled upon a satellite picture showing observations of the Arctic or Antarctic? You often see a circle where there is no data around the exact location of the geographic pole – as you can see in our Image of the Week. A few days ago, I wanted to explain this to one of my friends and turned to my favourite search engine for help. My search turned up a tremendous amount of stories and “scientific” studies about the Earth being hollow, with access to the centre of our hollow planet through these holes at the pole.
Obviously this is not the case. So here at the EGU Cryosphere blog we thought we’d better to set the record straight and explain the real reason for the “polar hole”.
Why do we need satellites?
Let’s start at the very beginning with how Earth observation data (e.g. temperature, ice cover, cloud cover, etc…) is collected. In the early days, measurements could only be collected pointwise, e.g. at weather stations (see Fig. 2) or by scientists traveling over land and by ship to specific locations. As a consequence, data coverage was very sparse and often clustered in places that were easily accessible, such as North America or Europe (Fig. 2). Additionally, measurements were even more sparse in hostile environments like the polar regions. It was therefore difficult to monitor these areas and study, for example, the evolution of polar ice sheets and sea-ice cover.
Since the 1970s, the use of satellites has greatly improved our ability to make remote observations around the world with a high spatial and temporal resolution, leading to much better monitoring of, for example, global weather and temperature. It has also allowed us to collect a vast amount of data in the difficult to access polar regions.
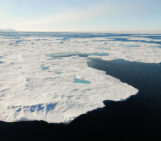
![Figure 2: Map of the land-based long-term monitoring stations included in the Global Historical Climatology Network. Colours indicate the length of the temperature record available at each site. [ Credit : created by Robert A. Rohde from published data and is incorporated into the Global Warming Art project ]](https://blogs.egu.eu/divisions/cr/files/2016/10/800px-GHCN_Temperature_Stations.jpg)
Figure 2: Map of the land-based long-term monitoring stations included in the Global Historical Climatology Network. Colours indicate the length of the temperature record available at each site. [Credit: created by Robert A. Rohde from published data and is incorporated into the Global Warming Art project]
Earth Observation Satellites
Satellites orbiting the Earth allow is to make remote observations and measurements of what is happening in the atmosphere and on the surface of the Earth. Earth observation satellites are divided in two categories according to the way in which they circle (orbit) the planet:
- Geostationary satellites: orbit around the Earth’s Equator at an altitude of about 36000 km. They orbit in sync with the Earth (taking around 24h to complete a rotation) and therefore are always pointing at the same region (see video below). They provide observations of a given region on a high temporal resolution. However, given their location at the Equator, they do not cover the polar regions well.
- Polar orbiting satellites: circle the Earth at a lower altitude around 850 km and their orbit is nearly perpendicular to the Equator. They are not in sync with the Earth’s orbit, circling the the Earth around once every 100 minutes. They therefore cross polar regions several times a day. Have a look at the video below to see how this works!
So…we have polar orbiting Satellites – why can can’t we “see” the poles?
The answer: sun-synchronous orbits!
Sun-synchronous Orbit
To understand the data “hole” at the poles, we need to a little more detail about the path of polar orbiting satellites. To follow the evolution of a given point on Earth, it is useful for polar orbiting satellites to always cross that point at the same time of day – this way the angle of sunlight on the surface of the Earth is as constant as possible, resulting in a consistent series of images and observations over time . This is called a sun-sychronous orbit. To follow a sun-synchronous orbit, the orbit of the satellite has to be tilted at an angle from the geographic poles, thereby preserving the observed solar angle at the Earth’s surface .
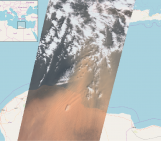
![Figure 3: These illustrations show 3 consecutive orbits of a sun-synchronous satellite with an equatorial crossing time of 1:30 pm. The satellite’s most recent orbit is indicated by the dark red line, while older orbits are lighter red. [Credit: NASA , illustration by Robert Simmon ]](https://blogs.egu.eu/divisions/cr/files/2016/10/sun-synchronous.jpg)
Figure 3: These illustrations show 3 consecutive orbits of a sun-synchronous satellite with an equatorial crossing time of 1:30 pm. The satellite’s most recent orbit is indicated by the dark red line, while older orbits are lighter red. [Credit: NASA , illustration by Robert Simmon]
If you get a picture of all the trajectories of a sun-synchronous satellite, they will overlap (see video below), providing a seemingly closed picture. The only region that is not covered by the satellite is a circle (the size of the circle depends on the orbit tilt) around the geographic pole. This is the explanation for the data “hole” at the pole.
Sorry to debunk the myth but there is there is no hollow Earth that can be accessed through holes at the poles. The “Polar Hole” is a purely technical matter!
Further reading:
- Catalog of Earth Orbits, NASA
- Satellites and orbits, Sciencelearn Hub
- Or for some other theories….. just type “polar hole” into your favourite search engine!
Edited by Emma Smith
