When it comes to global warming, greenhouse gases – and more specifically CO2 – are the most often pointed out. Fewer people know however that tiny atmospheric particles called ‘black carbon’ also contribute to the current warming. This post presents a paper my colleague and I recently published in nature communications. Our study sheds more light into the chemical make-up of black carbon, passing through the Arctic.
Black Carbon warms the climate
![Figure 1: Global radiative forcing of CO2 (green) compared to black carbon (blue). The colored bars show the mean change in radiative forcing due to the concentration of CO2 and BC in the atmosphere. The estimated range for the expected radiative forcing is everything between the white lines, which show the 90% confidence interval. (Data according to Boucher et al. 2013 (IPCC 5th AR) and Bond et al. 2013). [Credit: Patrik Winiger]](https://blogs.egu.eu/divisions/cr/files/2016/11/fig1v2.jpg)
Figure 1: Global radiative forcing of CO2 (green) compared to black carbon (blue). The colored bars show the mean change in radiative forcing due to the concentration of CO2 and BC in the atmosphere. The estimated range for the expected radiative forcing is everything between the white lines, which show the 90% confidence interval. (Data according to Boucher et al. 2013 (IPCC 5th AR) and Bond et al. 2013). [Credit: Patrik Winiger]
Black Carbon (BC) originates from incomplete combustion caused by either natural (e.g., wild fires) or human (e.g., diesel car emissions) activities. As the name suggests, BC is a dark particle which absorbs sunlight very efficiently. In scientific terms we call this a strong positive radiative forcing, which means that the presence of BC in the atmosphere is helping to heat the planet. Some estimates put its radiative forcing in second place, only after CO2 (Figure 1). The significant thing about BC is that it has a short atmospheric lifetime (days to weeks), meaning we could quickly avoid some climate warming by getting rid of its emissions. Currently global emissions are increasing year by year and on snow and ice, the dark particles have a longer lasting effect due to the freeze and thaw cycle, where BC can re-surface, before it is washed away. It is important however to note, that our main focus on emission reduction should target (fossil-fuel) CO2 emissions, because they will affect the climate long after (several centuries) they have been emitted.
Arctic amplification: strongest warming in the North Pole
The Arctic is warming faster than the rest of our planet. Back in 1896, the Swede Arrhenius, (better known for his works: in chemistry), calculated, that a change in atmospheric CO2 – which at that time was a good 100 ppm lower than today – would change the temperature at higher latitudes (towards the poles) more than at lower latitudes.
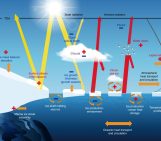
![Figure 2: Observation based global surface temperature anomalies for Jan-Mar (2016) in °C with respect to a 1961-1990 base year. Credit: GISTEMP Team, 2016: GISS Surface Temperature Analysis (GISTEMP). NASA Goddard Institute for Space Studies. Dataset accessed 2016-10-15 at http://data.giss.nasa.gov/gistemp/ [Hansen et al., 2010].](https://blogs.egu.eu/divisions/cr/files/2016/11/fig2.jpg)
Figure 2: Surface temperature anomalies (in °C) for Jan-Mar (2016) with respect to a 1961-1990 baseline. [ Credit: NASA — GISTEMP (accessed 2016-10-15) and Hansen et al., 2010].
The problem with his calculations – as accurate and impressive they might have been – was, that he ignored the earth’s geography and seemed unaware of the big heat capacity of the oceans. On the southern half of our planet there is a lot more water, which can take up more heat, as compared to the northern half with more land surface. Thus, in reality the latitudes on the southern hemisphere have not heated as much as their northern counterparts and this effect came to be known as Arctic amplification.
Dark particles on bright snow and ice
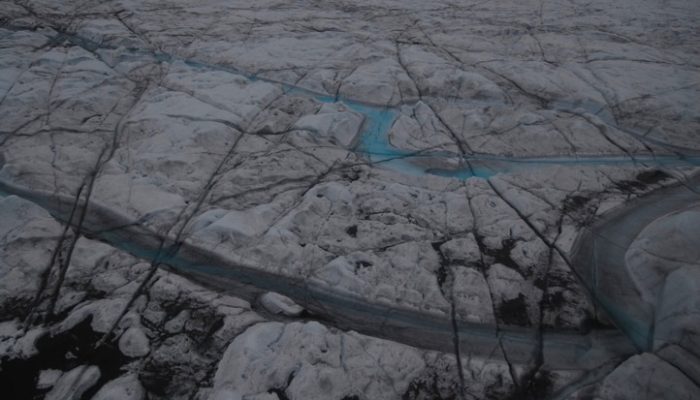
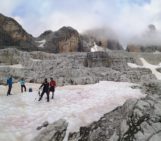
![Figure 3: Welcome to the Greenland Ice Sheet everybody. Probably an extreme case of ice covered in cryoconite, captured in August 2014 [Credit: Jason Box, (LINK: http://darksnow.org/)].](https://blogs.egu.eu/divisions/cr/files/2016/11/fig3.jpg)
Figure 3: Ice covered in cryoconite, Greenland Ice Sheet, in August 2014 [Credit: Jason Box — Dark Snow project].
Greenhouse gases and BC are not the only reasons for the increase in temperature change and earlier onset of the melting season in the Arctic. Besides BC, there are other ‘light absorbing impurities’ such as dust, microorganisms, or a mixture of all of the above, better known as cryoconite. They all absorb solar radiation and thus decrease the albedo – the amount of solar energy reflected back to space – of the underlying white surface. This starts a vicious cycle by which these impurities melt the snow or ice and eventually uncover the usually much darker surface (e.g., rock or open sea water), leading to more solar absorption and the cycle continues. The effect and composition of these impurities are currently intensively studied on the Greenland ice sheet (check out the Black and Bloom, as well as the Dark Snow projects).
Black Carbon effect on climate is highly uncertain
One of the reasons for the high uncertainty of BC’s climate effects is the big range in effects it has (see white line on Figure 1), when it interacts with snow and ice (or clouds and the atmosphere).
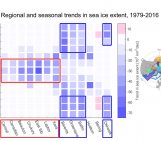
Another source of uncertainty is probably the big estimated range in the global, and especially in the regional emissions of BC in the Arctic. For example, the emission inventory we work with (ECLIPSE), is based on international and national statistics that indicate how much of a certain fuel (diesel, coal, gas, wood, etc.) is used, and in which way it is used (vehicle sizes, machine type and age, operating conditions, etc.). These numbers can vary a lot. If we, for example, line up different emission inventories of man-made emissions (Figure 4), by comparing the two different fractions of BC (fossil fuels vs. biomass burning) at different latitudes, then we see that the closer we get to the North pole, the more these emission inventories disagree. And this is still ignoring atmospheric transport or emissions of natural sources, such as wildfires.
Computer models, necessary to calculate global climate change, are partly based on input from these emission inventories. Models used for the calculation of the transport of these tiny particles have vastly improved in recent years, but still struggle at accurately mimicking the seasonality or extent of the observed BC concentrations. To some extent this is also due to the range of parametrization in the model, mainly the lifetime of BC, including its removal from the atmosphere by wet scavenging (e.g., rain). So to better understand black carbon effects on climate, more model calculations are necessary, for which the emission inventory estimates need to be verified by observations.
![Figure 4: Fraction biomass burning of BC (fbb) at different latitudes North, estimated by three different emission inventories. The green line shows the GAINS emission inventory, which was the precursor to the ECLIPSE inventory (Klimont et al. 2016) [Credit: Patrik Winiger]](https://blogs.egu.eu/divisions/cr/files/2016/11/fig4.jpg)
Figure 4: Fraction biomass burning of BC (fbb) at different latitudes North, from three different emission inventories. The green line shows the GAINS emission inventory, which was the precursor to the ECLIPSE inventory (Klimont et al. 2016) [Credit: Patrik Winiger]
How do we trace the origin of black carbon?
This is where the science of my colleagues and me comes in. By looking at BC’s isotopic ratio of stable-carbon (12C/13C) and its radiocarbon (14C) content we were able to deduce information about the combustion sources (Figure 5).
Plants (trees) take up contemporary radiocarbon, naturally present in the atmosphere, by photosynthesis of atmospheric CO2. All living organisms have thus more or less the same relative amount of radiocarbon atoms, we talk of a similar isotopic fingerprint. BC from biomass (wood) burning thereby has a contemporary radiocarbon fingerprint.
When they die, organisms stop incorporating contemporary carbon and the radiocarbon atoms are left to decay. Radiocarbon atoms have a relative short (at least on geological time-scales) half-life of 5730 years, which means that fossils and consequentially BC from fossil fuels are completely depleted of radiocarbon. This is how the measured radiocarbon content of a BC sample gives us information on the relative contributions of fossil fuels vs. biomass burning.
The stable carbon isotopic ratio gives information on the type of combustion sources (liquid fossil fuels, coal, gas flaring or biomass burning). Depending on how a certain material is formed (e.g., geological formation of coal), it has a specific isotopic ratio (of 12C/13C), like a fingerprint. Sometimes isotopic fingerprints can be altered during transport (because of chemical reactions or physical processes like condensation and evaporation). However, BC particles are very resistant to reactions and change only very little. Hence, we expect to see the same fingerprints at the observation site and at the source, only that the isotopic signal at the observation site will be a mixture of different source fingerprints.
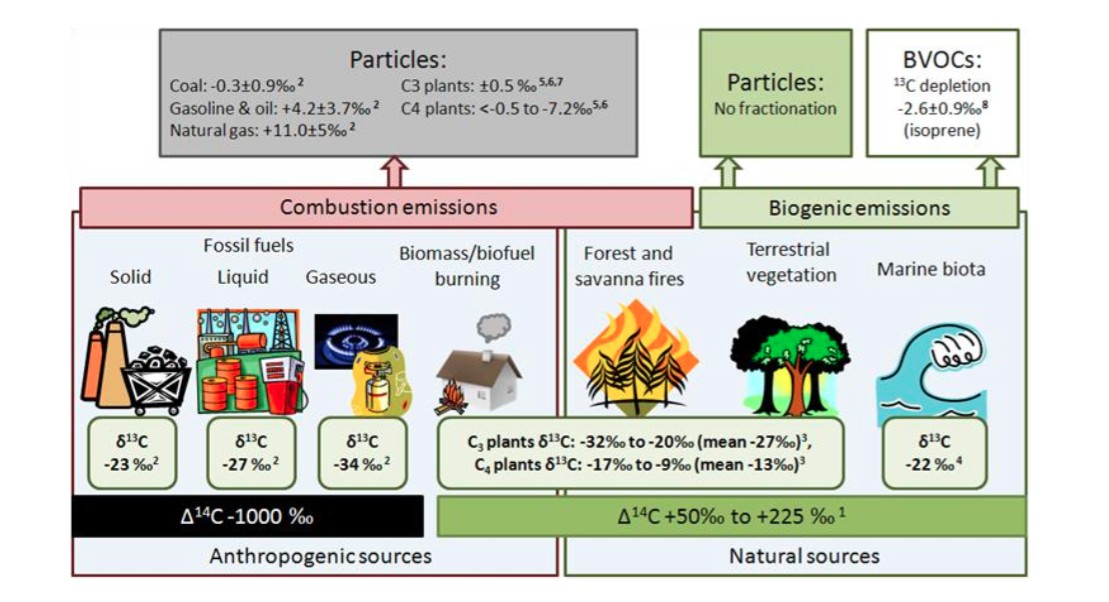
Figure 5: Carbon isotopic signatures of different BC sources, summarized by E.N. Kirillova (2013). To give information about the isotopic fingerprint, the delta-notation is used (small delta for 12C/13C, and big delta for 12C/14C). The isotopic values show how much a certain sample is different, on a per mil scale, from an international agreed isotopic standard value (or ratio) for carbon isotopes. [Credit: fig 1 from Kirillova (2013)]
Where does the black carbon in European Arctic come from?
In our study (Winiger et al, 2016), we observed the concentrations and isotopic sources of tiny particles in airborne BC for over a year, in the European Arctic (Abisko, Sweden), and eventually compared these observations to model results, using the freely available atmospheric transport model FLEXPART and emission inventories for natural and man-made BC emissions.
Seeing our results we were first of all surprised at how well the model agreed with our observations. We saw a clear seasonality of the BC concentrations, like it has been reported in the literature before, and the model was able to reproduce this. Elevated concentrations were found in the winter, which is sometimes referred to as Arctic haze. The combustion sources showed a strong seasonality as well. The radiocarbon data showed, that fossil fuel combustion dominated in the winter and (wood) biomass burning during the low BC-burden periods in the summer. With a combination of the stable isotope fingerprints and Bayesian statistics we further concluded, that the major fossil fuel emissions came from liquid fossil fuels (most likely diesel). The model predicted a vast majority of all these BC emissions to be of European origin. Hence, we concluded, that the European emissions in the model had to be well constrained and the model parametrization of BC lifetime and wet-scavenging had to be fairly accurate for the observed region and period. Our hope is now that our work will be implemented in future models of BC effects and taken into account for future BC mitigation scenarios.
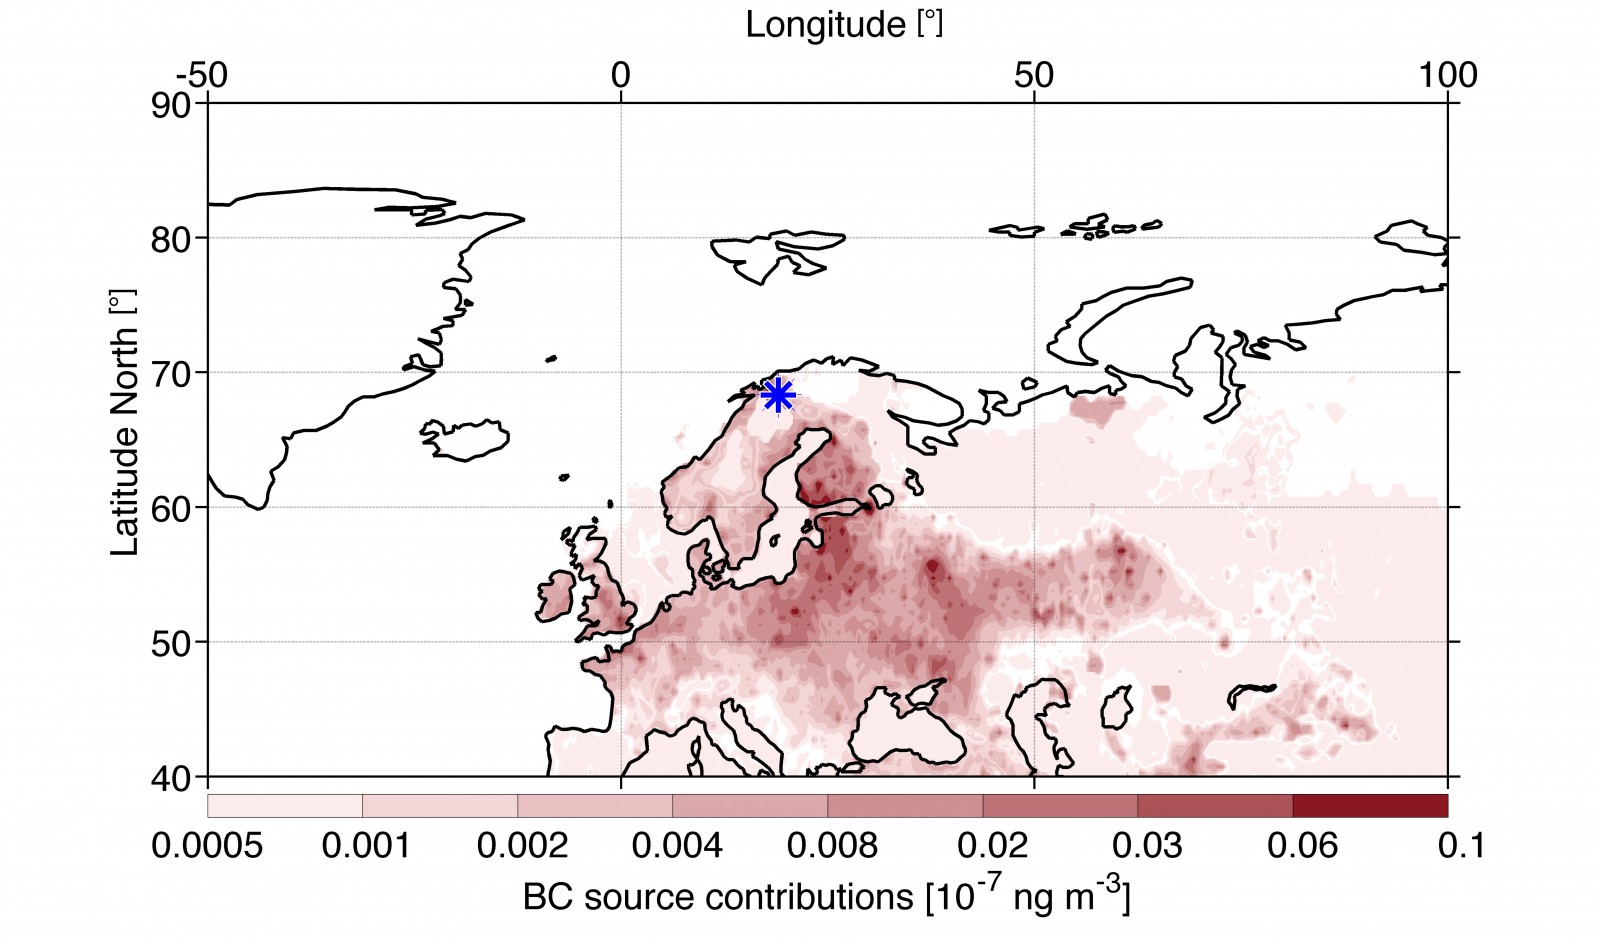
Figure 6: Example from the model calculations, showing where the (man-made) BC came from in January 2012. Abisko’s position is marked as a blue star. The darker (red) spots show sources of higher BC contribution. This winter example was among the three highest observed (in terms of BC concentration) and the sources were ~50% wood burning, ~20% liquid fossil fuels (diesel) and ~30% coal. Some of the darkest spots can clearly be attributed to European cities. [Credit: fig4b from Winiger et al (2016)]
References
- Anderson, T. R., E. Hawkins, and P. D. Jones (2016), CO2, the greenhouse effect and global warming: from the pioneering work of Arrhenius and Callendar to today’s Earth System Models, Endeavour, in press, doi:10.1016/j.endeavour.2016.07.002.
- Arrhenius, S. (1896), On the influence of carbonic acid in the air upon the temperature of the ground., Philos. Mag. J. Sci., 41(August), 239–276, doi:10.1080/14786449608620846.
- Hansen, J., R. Ruedy, M. Sato, and K. Lo (2010), Global surface temperature change, Rev. Geophys., 48(4), RG4004, doi:10.1029/2010RG000345.
- Klimont, Z., Kupiainen, K., Heyes, C., Purohit, P., Cofala, J., Rafaj, P., Borken-Kleefeld, J., and Schöpp, W.: Global anthropogenic emissions of particulate matter including black carbon, Atmos. Chem. Phys. Discuss., doi:10.5194/acp-2016-880, in review, 2016.
- Kirillova, Elena N. “Dual isotope (13C-14C) Studies of Water-Soluble Organic Carbon (WSOC) Aerosols in South and East Asia.” (2013). ISBN 978-91-7447-696-5 pp. 1-37
- Winiger, P., Andersson, A., Eckhardt, S., Stohl, A., & Gustafsson, Ö. (2016). The sources of atmospheric black carbon at a European gateway to the Arctic. Nature Communications, 7.
Edited by Sophie Berger, Dasaraden Mauree and Emma Smith
This is joint post with the Atmospheric Division , given the interdisciplinarity of the topic featured.
 Patrik Winiger is a PhD student at the Department of Environmental Science and Analytical Chemistry and the Bolin Centre for Climate Research, at Stockholm University. His research interest focuses on impact and mitigation of Short Lived Climate Pollutants and anthropogenic CO2 emissions. Currently he investigates the sources of black carbon aerosols in the Arctic. He tweets as @PatrikWiniger
Pingback: Atmospheric Sciences | Black Carbon: the dark side of warming in the Arctic
Pingback: Cryospheric Sciences | Image of the Week – Climate feedbacks demystified in polar regions
Pingback: Cryospheric Sciences | Climate Change & Cryosphere – Summer 2019: The year that the Arctic was sunburned