The Anthropocene Working Group (AWG) is the body tasked to propose a formal definition for the Anthropocene as a geological time unit. Join us at the EGU2021 General Assembly on Wednesday 28th April at 14:15-15:00 CEST for a series of presentations on the Anthropocene in session SSP2.6.
The Anthropocene concept
Geologists cope with the enormity of 4.5 billion years of Earth history by dividing it into named geological time units which have globally specific starts and ends. Each unit’s characteristics result from the nature of Earth’s evolution during that interval. The Geological Time Scale contains a hierarchy of units, the shorter ones grouped together into larger ones. We currently live in the Meghalayan Age, of the Holocene Epoch, of the Quaternary Period (Fig. 1).
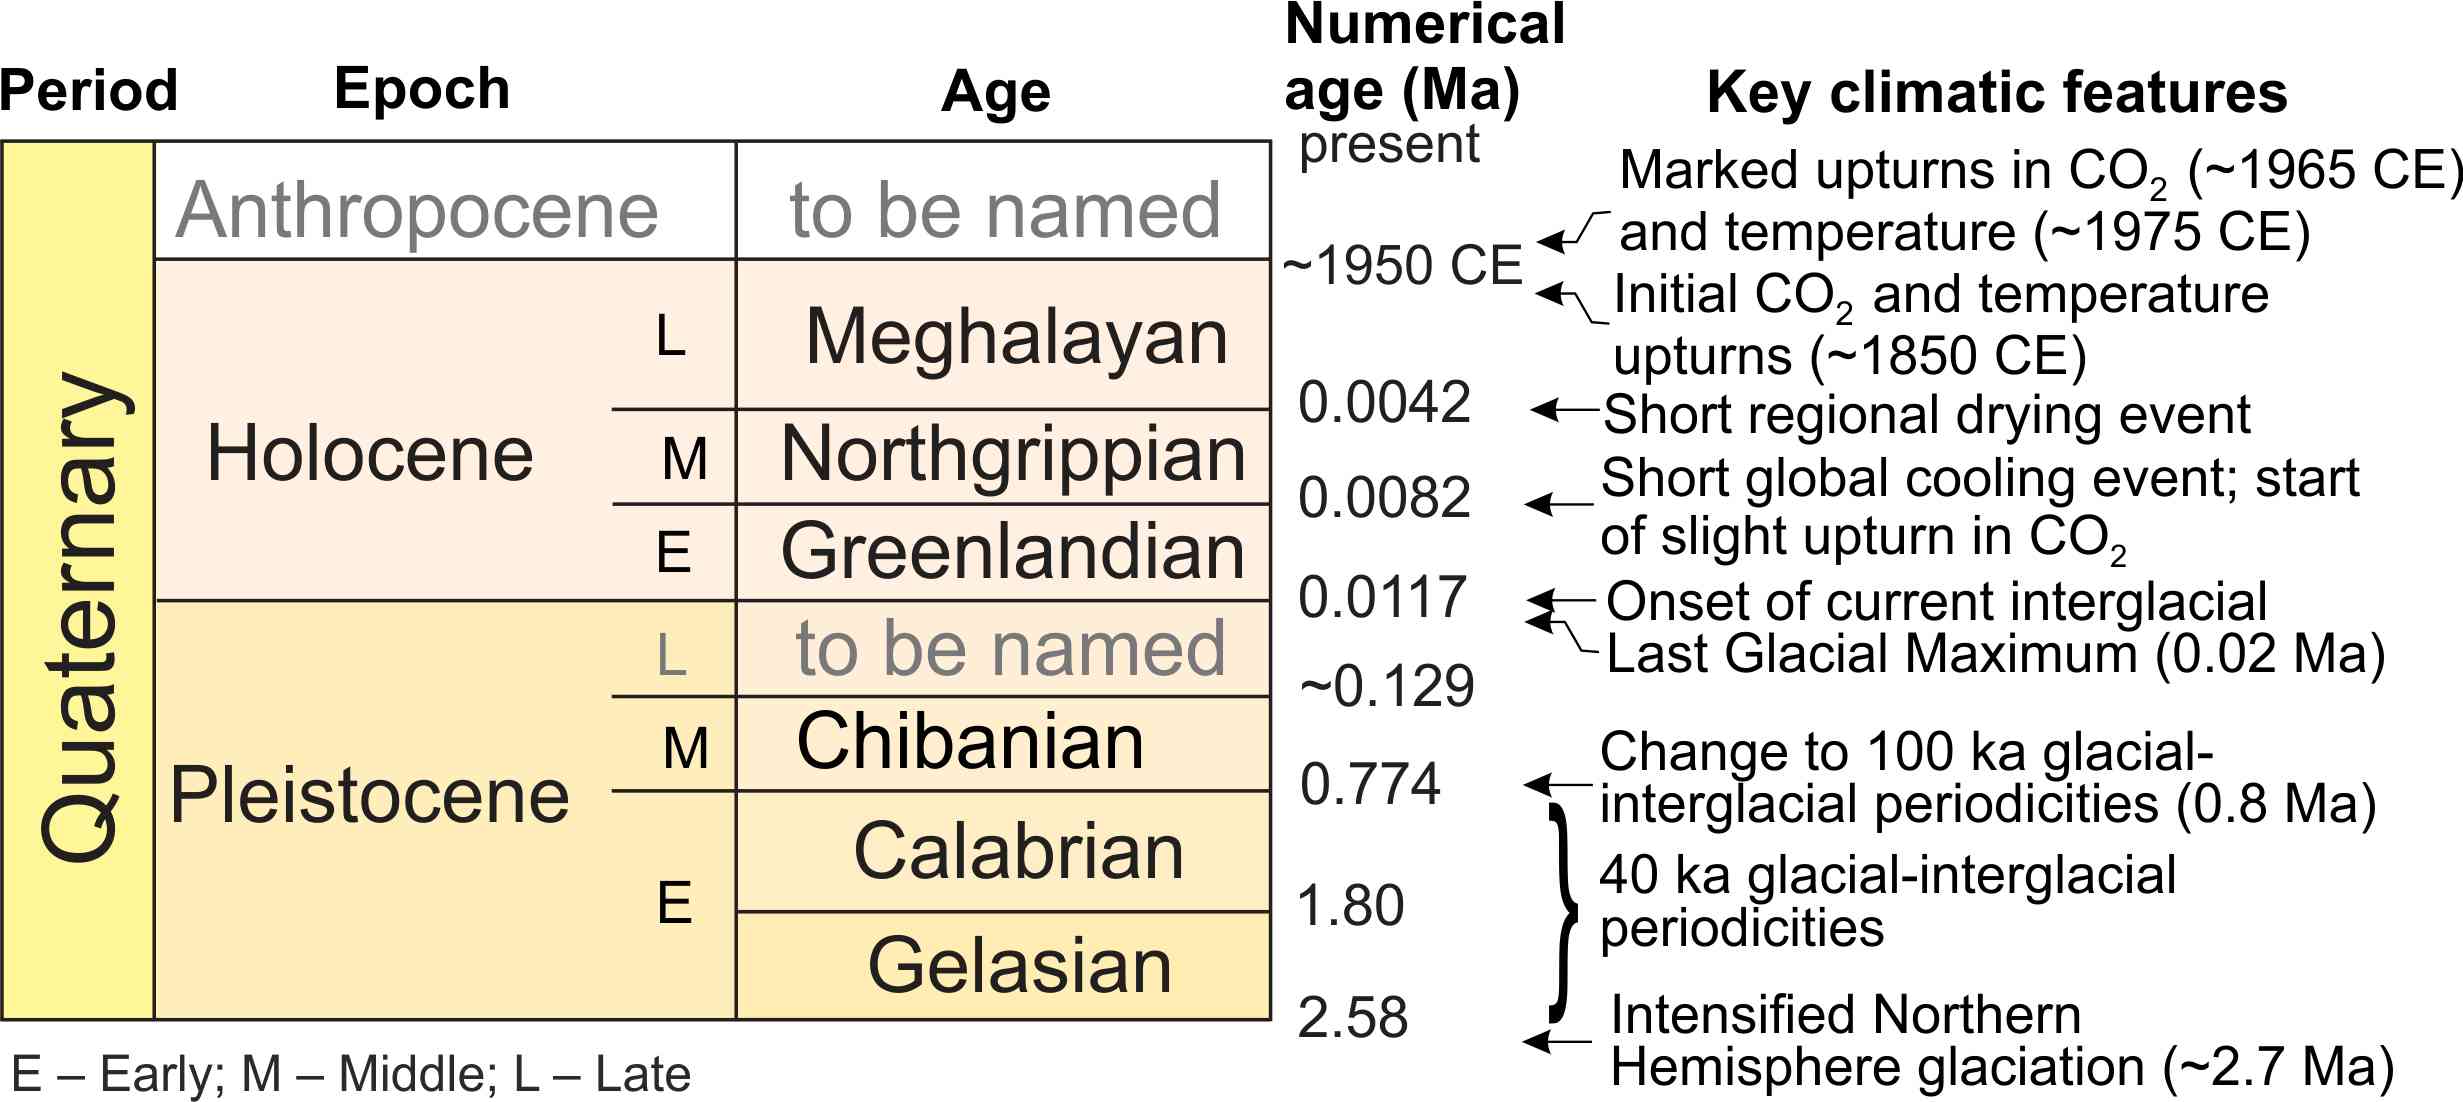
Fig. 1. The Quaternary time scale as preferred by the AWG. Black type – officially approved and ratified; grey type – yet to be sanctioned officially. Modified from the International Chronostratigraphic Chart (https://stratigraphy.org/chart).
This picture is now being reviewed, recognizing that human impacts on our planetary environment have become so large that in effect we now live in a new epoch of geological time, the Anthropocene. An international group of experts (the Anthropocene Working Group – AWG – of the Subcommission on Quaternary Stratigraphy) is gathering data to support this proposal. The AWG argues that a mid-20th century Great Acceleration of our human population and activities caused substantial modifications to the natural geological background record. We see these changes for example in dramatic increases in such novel materials and compounds as plastics and concrete, the chemical signals of nuclear fallout, and profound changes to the biosphere (especially losses in biodiversity, along with the mixing of plants and animals between regions) [1, 2].
In this article, we show that many of the changes between recent geological time units are due to climate change. We use proxies for temperature and other properties of the climate system to measure those changes. It has become clear that the change in climate since 1950 is far larger than would be expected. Climate change is thus proving to be an important factor in differentiating between the Anthropocene and the Holocene.
Quaternary climate change
During the last 2.6 million years the amount of solar energy (insolation) received at the Earth’s surface has varied in parallel with regular changes in the Earth’s orbit and the tilt of the Earth’s axis in cycles lasting 20,000, 40,000 and 100,000 years [3]. These variations led to periodic cold periods known as ‘glacials’, alternating with much shorter warm periods known as ‘interglacials’.
Ice cores from polar regions, dated by annual layers of snow accumulation and known volcanic ash markers, provide vital evidence for climate change over the past 800,000 years. Geochemists measure the concentrations of the different isotopes of oxygen and hydrogen down the ice cores to determine the likely temperature changes with time. The ice has further value in that as it forms it traps bubbles of air, which geochemists can extract to measure how much of the greenhouse gas carbon dioxide (CO2) the air contained at any one time.
The temperature and CO2 records down ice cores (Fig. 2) closely follow the calculated pattern of changing insolation with time, but with a complex relationship. It is clear that when insolation increased, so did global temperature. At the same time CO2 increased because the warming ocean released CO2 to the atmosphere. The main driver for the temperature change was the insolation, with the CO2 acting as a reinforcing agent. When insolation began to decline, so too did the temperature, but the decline in CO2 lagged behind. That lag is explained as follows: (1) as the climate cooled, water that had evaporated from the ocean became trapped in growing ice sheets and permafrost on land. This caused sea level to fall by up to 130 m, reducing the area of the ocean available to absorb CO2 from the air; (2) Sea ice grew over the cooling polar ocean, further reducing the area of ocean in contact with the air, thus further inhibiting the absorption of CO2 by the ocean. Gradually, as the ice sheets and sea ice stabilized, so too did the ocean, allowing the absorption of CO2 from the air to ‘catch up’ with the lowered temperature.

Fig. 2. Composite CO2 records [4] and palaeotemperature (using the deuterium isotope proxy and with respect to mean temperature of the last millennium) [5] from Antarctic ice cores for the past 800,000 years. Marine isotope stages (MIS) at ~100,000-year periodicity: odd numbers relating to warm stages (interglacials), even to cold stages (glacials).
The peak of the last glacial interval, 20,000 years ago, was followed by warming (Fig. 3) that was forced by natural orbital and axial change. Warming water holds less gas, so the warming ocean emitted CO2 to the atmosphere, increasing its concentration there by 75 ppm between 17,000 – 11,000 years ago (average rise: 0.01 ppm per year). Over the same time interval, global mean temperatures rose by about 2.7°C (0.0004°C per year) and in response, sea level rose by ~75 m (average 12.5 mm per year). However, the sea level continued to rise rapidly even after insolation had peaked 11,700 years ago, because the great ice sheets took such a long time to melt. Indeed, sea level rose ~45 m between then and ~7,500 years ago, by when ice sheets in the Arctic had almost completely disappeared, with only the Greenland ice sheet remaining.
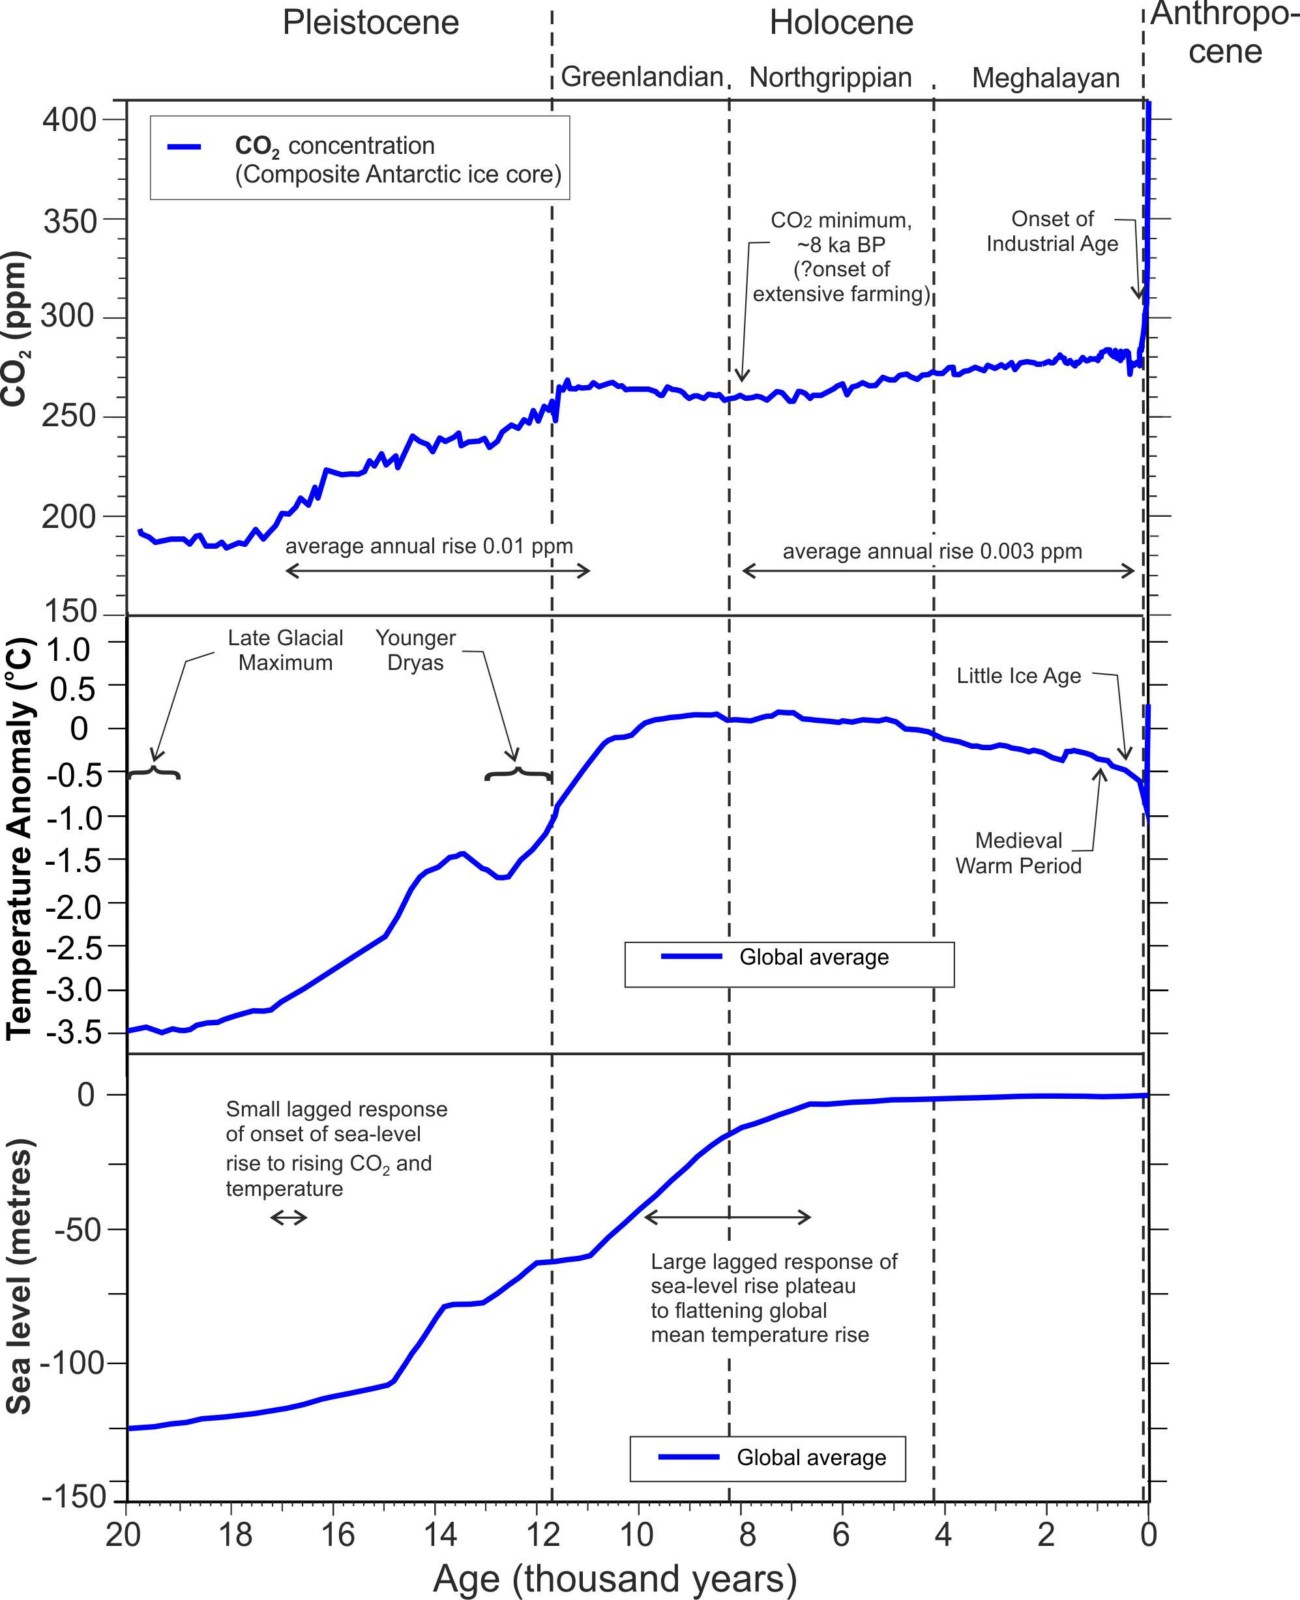
Fig. 3. Atmospheric CO2 from composite Antarctic ice cores [4], global mean temperature anomaly reconstructed from palaeoclimate archives relative to 1980 – 2004 mean adapted from [6] and global mean sea-level change relative to present day [7].
Holocene climate stability
The Holocene Epoch, which began 11,700 years ago, is the most recent interglacial warm interval (MIS 1, Fig. 2). Holocene climate has been relatively stable, which has enabled the development of agriculture, cities and civilization. The warmest conditions prevailed in both hemispheres between roughly 11,000 – 6,000 years ago (Fig. 3, [6]). Global cooling, driven by declining insolation, has characterized the temperate and polar regions over the last 7,000 years. This led our climate towards a ‘neoglacial’ one in which glaciers advanced over the past 4000 years, with this neoglacial cooling becoming most pronounced during the Little Ice Age between 1250 – 1800 CE (Fig. 3). The intense cooling of the peak of the Little Ice Age is attributed to a temporary disappearance of sunspots known as the Maunder Minimum, indicating a period of weak solar output, which lasted from 1645-1715 CE. Despite this neoglacial cooling, CO2 increased slightly, by 25 ppm starting 8,000 years ago. Here we have another disconnection between CO2 and temperature. Evidently, decreased insolation was a more important driver of climate than the slight rise in CO2, but the latter may have prevented the cooling from becoming even stronger. Arguments have been presented for this small rise in CO2 being the result of either deforestation during agricultural expansion, or to natural exhalation from the ocean.
Sea level rise had been rapid up to 7,500 years ago, by which time ice melt had largely ceased and sea level had largely stabilized (Fig. 3). It then slowed dramatically to about 3 m in 3000 years, a rate of 1 mm/year (i.e., 10 cm/100 years).
Superimposed upon the relative Holocene climate stability, geologists used two short-lived climatic events to help to subdivide the epoch into distinct geological ages (Fig. 1). A short global cooling event 8,200 year ago [8], divides the Greenlandian from the Northgrippian Age (Fig. 1), while a decrease in monsoonal rainfall 4,200 year ago divides the Meghalayan Age from the Northgrippian [8].
Anthropocene human drivers of climate change
By the mid-19th century, global temperatures started to increase slowly and glaciers started to retreat in both hemispheres. Careful examination of sunspot records suggest that this warming was not due to changes in the Sun’s output, which peaked at the same levels in the 1780s, 1860s and 1980-1990 CE. Similarly, this warming cannot be blamed on orbital insolation or axial tilt, as the decline in insolation has flattened over the past 2000 years and is no longer driving major climate change. Instead, the evidence suggests that this recent warming was caused by increased burning of fossil fuel along with deforestation.
More than 90% of all fossil fuels ever burned have been burnt since 1950. Deforestation rates also increased sharply after 1950, removing trees that would otherwise have absorbed CO2 from the air. Also, the increasingly rapid advance of agriculture began to strip CO2 from soils, which act as huge natural carbon stores. These processes led to an increase in atmospheric CO2 exceeding the magnitude of concentrations seen in Antarctic ice over the past 800,000 years (a maximum of 300 ppm) by ~1910 (Figs 2 & 4). Of the ~120 ppm rise in CO2 since 1850, >80% has occurred since 1950. A marked upturn of fossil fuel burning ~1965 (Fig. 4) caused an average annual increase of 2 ppm in atmospheric CO2, ~200 times the rate at the onset of the Holocene (Fig. 3). Similarly, the global temperature rise from 1975 – 2020, of 1.0°C (Fig. 4), at 0.02°C per year, is almost an order of magnitude faster than occurred at the Holocene onset. The 1940 – 1970s stall in temperature rise is likely to have been a response to two influences: (1) this interval saw increased aerosol production from rapidly growing polluting industries, reflecting solar energy; and (2) natural variability in the Atlantic Meridional Ocean Circulation led to enhanced transfer of heat into the deep Atlantic at that time [9].
Average global sea levels are currently higher than at any point in the past ~115,000 years (Fig. 3). There is now much less ice on the planet, but even so about 25% of the planetary surface is still covered by ice and permafrost in winter. It has begun to melt with global warming at a rate that has increased the rate of rise of sea level to 4 mm/year (i.e., 40cm/100years). This is faster than the rate of sea level rise between 7000-3000 years ago. Sea level has risen 0.3 m since 1860, when the recent rising trend commenced [10].

Figure 4. Trends across the proposed Holocene – Anthropocene boundary (~1950). Annual global mean atmospheric CO2 data, annual global mean temperature anomalies relative to 1951 – 1980 average (data sources indicated in boxes) and sea-level curve [10, fig.13.3e].
Could changes in solar output be causing the rise in temperature since 1975? This is highly unlikely, since as pointed out earlier the 20th century sunspot numbers peaked in 1980 and 1990 and were no different than from those of 1780 and 1860 [11], when temperatures were much cooler. Since 1990, sunspot numbers have declined slowly, not rising as they should if the Sun caused this temperature rise.
Rates of increasing CO2 concentrations and global warming at the Holocene – Anthropocene boundary are greater than at the Pleistocene – Holocene boundary 11,700 years ago, significantly so compared with the short-duration climatic events marking the component Holocene ages (Fig. 3). This provides one argument for the Anthropocene to be defined as sufficiently different from the Holocene to be named as a new epoch [1].
As an aside, we should point out that the common focus on CO2 emissions from human activities in this text, as in many others, masks the fact that CO2 is shorthand for a basket of greenhouse gases including methane and nitrous oxide. These greenhouse gases followed CO2 during the Pleistocene and continue to do so today, but are now produced mainly by industrial and agricultural activities. Water vapour is another important greenhouse gas; it increases in the air with warming, but does not make it into the stratosphere and therefore is regarded as a feedback factor, rather than a primary driver of change.
Forward look
Although the climatic effects of carbon emissions to date could be largely dissipated naturally in ~50,000 years [6], just a moderate atmospheric CO2 increase may well postpone the next glaciation for ~100,000 years [12]. In the short to medium term it is clear that even if human efforts lead in future to a decline in CO2 emissions, the CO2 concentration in the air will remain high on the thousand year timescale, because it must remain in equilibrium with the CO2 concentration in the surface ocean [13]. Similarly, about 90% of the heat from global warming is stored in the oceans. As in the case of CO2, the heat in the ocean must be in equilibrium with that in the atmosphere. Hence, any tendency for the atmosphere to cool with a decrease in its CO2 content would tend to be offset by heat emerging from the ocean to balance heat lost from the atmosphere. This means that cooling the atmosphere to pre-industrial levels will take many hundreds of years.
Assuming that human efforts manage to keep global warming at close to the same level as it is now, we should not expect sea level to follow that pattern. Earlier, we described the existence of the lag between maximum insolation (heating) 11,700 years ago and peak sea level rise around 7,500 years ago, at a time when insolation was falling. This suggests that ice will continue to melt even if future warming stabilizes at a global average temperature of close to 2°C above the pre-Industrial level. The pattern of sea level rise from the Holocene suggests that we may not see peak sea level for up to 4,000 years from now.
That begs the question of what peak sea level might look like. The level of CO2 in the atmosphere is now similar to what it was in the Pliocene, roughly 3.5 million years ago, and the Middle Miocene, about 17-14 million years ago, when temperatures were 2-3°C warmer than they are today. At those times sea level was higher by at least 10 m than it is today, and possibly as much as 20 m [14]. If humans fail to cut CO2 emissions, the trajectory of climate change is likely to lead to temperatures like those of the Pliocene or Middle Miocene – hence the urgent calls for dramatic reductions in emissions, net negative CO2 targets and application of CO2 capture technologies to limit future warming.
For more details on the work of the AWG, see http://quaternary.stratigraphy.org/working-groups/anthropocene/ or contact cw398@leicester.ac.uk
This post has been edited by the editorial board.
References
[1] Waters, C. N., Zalasiewicz, J., Summerhayes, C., et al. 2016. The Anthropocene is functionally and stratigraphically distinct from the Holocene. Science 351(6269), 137.
[2] Zalasiewicz, J., Waters, C. N., Williams, M., & Summerhayes, C. (Eds.) 2019. The Anthropocene as a Geological Time Unit: A Guide to the Scientific Evidence and Current Debate. Cambridge, UK: Cambridge University Press, 361 pp.
[3] see https://climate.nasa.gov/blog/2949/why-milankovitch-orbital-cycles-cant-explain-earths-current-warming/ for an explanation of orbital cycles.
[4] Bereiter, B. et al. Antarctic Ice Cores Revised 800KYr CO2 Data. Online resource http://ncdc.noaa.gov/paleo/study/17975 accessed 13th March 2021.
[5] Jouzel, J., et al.  2007. EPICA Dome C Ice Core 800KYr Deuterium Data and Temperature Estimates. IGBP PAGES/World Data Center for Paleoclimatology Data Contribution Series # 2007-091. NOAA/NCDC Paleoclimatology Program, Boulder CO, USA.
[6] Clark, P.U., Shakun, J.D., Marcott, S.A., et al. 2016. Consequences of twenty-first-century policy for multi-millennial climate and sea-level change. Nature Climate Change 6, 360–369.
[7] Derived from Robert A. Rohde. GNU Free Documentation License, Version 1.2. https://commons.wikimedia.org/wiki/File:Post-Glacial_Sea_Level.png
[8] Walker, M., Head, M.J., Berkelhammer, M., et al. 2018, Formal ratification of the subdivision of the Holocene Series/Epoch (Quaternary System/Period): two new Global Boundary Stratotype Sections and Points (GSSPs) and three new stages/subseries. Episodes 41(4), 213–223.
[9] Cheng, X., and Tung, K-K. 2018. Global surface warming enhanced by weak Atlantic overturning circulation. Nature 559, 387–391.
[10] Church, J.A., Clark, P.U., Cazenave, A., et al. 2013. Sea Level Change. In: Climate Change 2013: The Physical Science Basis. Contribution of Working Group I to the Fifth Assessment Report of the Intergovernmental Panel on Climate Change [Stocker, T.F., et al. (eds.)]. Cambridge University Press, Cambridge, UK, New York, USA.
[11] Clette, F., Svalgaard, L., Vaquero, J.M., and Cliver, E.W. 2014. Revisiting the sunspot number. Space Science Review 186, 35–103.
[12] Ganopolski, A.,Winkelmann, R., and Schellnhuber, H.J. 2016. Critical insolation–CO2 relation for diagnosing past and future glacial inception. Nature 529, 200–203.
[13] Archer, D., Eby, M., Brovkin, V., et al., 2009. Atmospheric Lifetime of Fossil Fuel Carbon Dioxide. Annual Review in Earth and Planetary Science 37,117–134.
[14] Summerhayes, C.P. 2020. Paleoclimatology: from Snowball Earth to the Anthropocene. Chichester: Wiley, 543pp.