You’re standing on a mountain peak, with a fabulous field site before you. Wanting to capture the moment, you take out your iPhone, snap a dozen pictures and your mobile stitches them together beautifully – a nice record to show your colleagues back in the office. Unfortunately, not all field sites are so easy to capture – especially when you need to do a little science with the images.
Seafloor photo-mosaics are particularly useful when looking at how extreme habitats, such as cold seeps and hydrothermal vents, are distributed. And – if they’re good enough – can be used to look at macrofaunal diversity too!
For this though, you need very high resolution images, and making a photo mosaic of the seafloor is plagued with difficulties, from limited visibility to currents carrying your camera out of place. The need to be close to the seafloor (less than 10 m) in order to see it only makes matters worse – the field of view is small so you need to take a lot of pictures in order to cover a large area.
There are tools out there that can overcome these problems, but many require sophisticated programing skills that the scientist conducting the survey might not have. To make mosaics easier for deep-sea scientists, a team from the Centre for Marine and Environmental Sciences (MARUM) at the University of Bremen have developed a user-friendly tool that combines navigation data with seafloor features to produce detailed photo mosaics. Their findings are published in the open access journal Geoscientific Instrumentation, Methods and Data Systems.
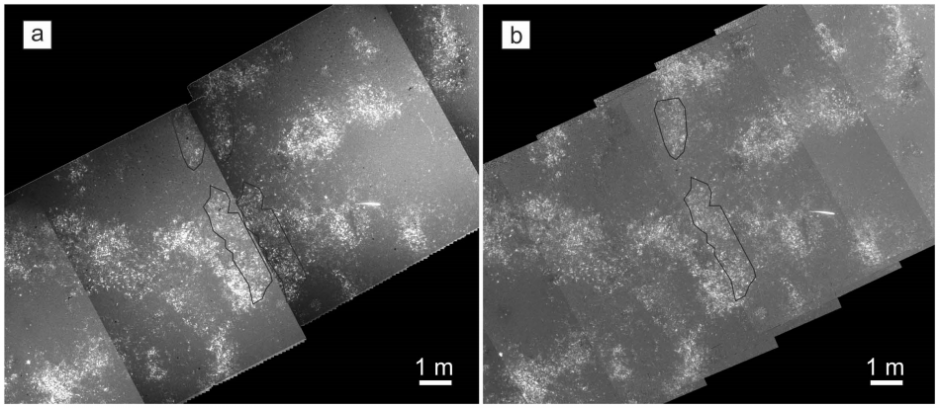
Photo-mosaics of clam aggregations on soft sediment. The left mosaic was made using navigation data and the right mosaic is feature-based (click for larger). (Credit: Marcon et al., 2013)
GPS data can be used to determine which images are adjacent to each other and pick out where they should be stitched together. The downside though, is that the location of the photographs needs to be highly accurate to produce a good mosaic – if anything is amiss, the mosaic won’t be very effective and features can be repeated (see the example above). To get around this, you can use feature tracking. This process uses distinctive features that appear in multiple photographs to see where they overlap. Feature tracking is pretty heavy on computing power though and you need a lot of overlap between successive photos to get a good match. To combat the limitations of each method, the MARUM team have combined them to create the large-area photo-mosaicking (LAPM) tool.
Here’s how it works:
- The first step is to find the features. Pairs of consecutive photos are compared to find any features that are found in both of them and linked together.
- Next, the program takes a look at overlap in photos that were not taken consecutively. These pints of overlap are called crossover points
- Then there’s a ‘bundle adjustment’. This finds the simplest arrangement of the images that allows all the features and crossover points to overlap in the mosaic.
- Finally, the overlapping images are clipped and blended to produce a smooth photo mosaic like this:
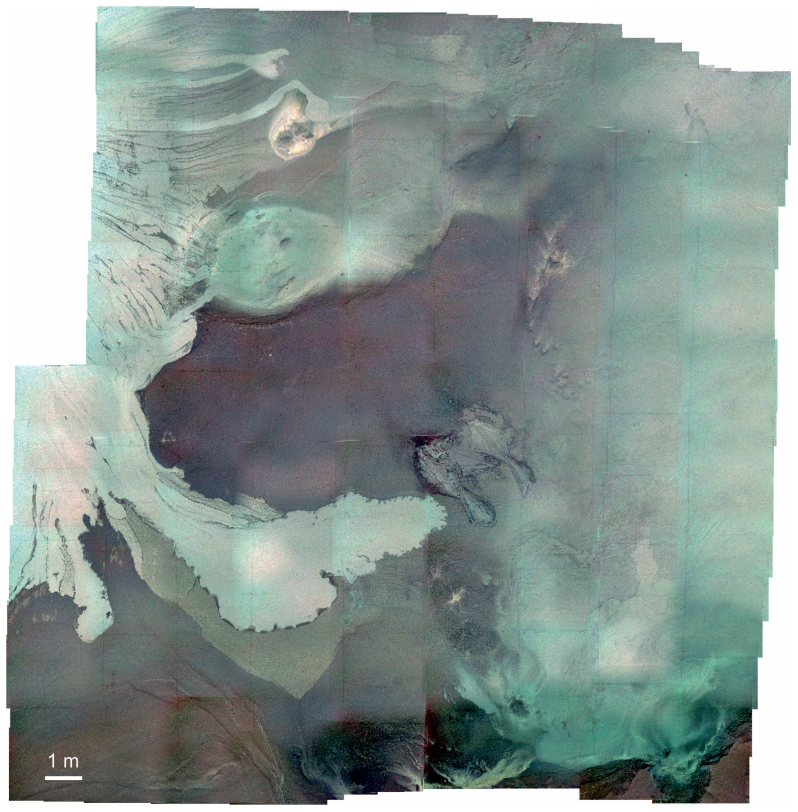
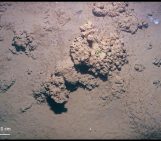
The final result! 218 images stitched to show the mud pools and flows at the Helgoland mud volcano in the Black Sea. (Credit: Marcon et al., 2013)
Because all the images have a location associated with them, they can be imported into a geographic information system (GIS). GIS is a fantastic way of compiling data from different sources to get a more holistic understanding of an area. In the mud volcano above, for example, you could combine the visual data with information on bathymetry (sea floor topography) to see how the distribution of mud flows varies with slope – brilliant!
The large-area photo-mosaicking (LAPM) tool requires relatively little computing power to do its job (it can be run on most modern computers), is easy to use (without any complicated programming for the user) and best of all, it’s free! Check out the tool here.
By Sara Mynott, EGU Communications Officer
Reference:
Marcon, Y., Sahling, H., and Bohrmann, G.: LAPM: a tool for underwater large-area photo-mosaicking, Geosci. Instrum. Method. Data Syst., 2, 189-198, 2013.