Subduction zones are areas where one tectonic plate dives beneath another one and sinks into the Earth’s mantle, creating powerful earthquakes and volcanic eruptions. Understanding the intricate details of subduction zones can be a daunting task, and retrieving the necessary data often feels like an uphill battle. But fear not! The Geosciences Montpellier Laboratory in France has come to the rescue with the latest update of Submap, the web-based tool that simplifies the generation of maps, cross-sections, and datasets related to subduction zones. In this blog post, we put this new version to the test, exploring its interesting updates and evaluating the user experience, features, and intuitive interface.
What is Submap?
The Submap database traces its origins to a compilation of published data and parameters measured and estimated in Arnauld Heuret’s doctoral thesis in 2005. Since then, the database has evolved, incorporating new parameters from subsequent studies and being regularly updated with the latest data and literature. The Submap website harnesses this comprehensive database, allowing users to explore, visualize, and analyze a wide range of data related to subduction zones.
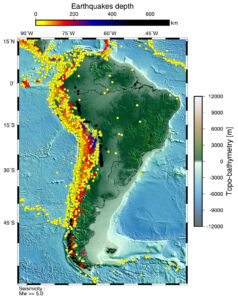
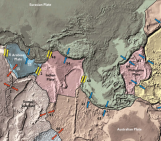
Figure 1. An example map created using MAP-Geodyn, displaying the topography and bathymetry of the South-American subduction zone, along with the locations of earthquakes (represented by circles) and volcanoes (indicated by red triangles). The depth of earthquakes is represented by different colors.
Submap offers a suite of modules, including MAP-Geodyn, SECTION-Geodyn MAP-Subquake, and Sub-DATA. MAP-Geodyn enables users to generate detailed maps showcasing important geological information such as sediment thickness, seafloor age, location of volcanoes, location of earthquakes and focal mechanisms (i.e., the way they release seismic energy), as well as the direction and velocity of the plates (Figure 1). With the recent additions of MAP-Subquake in the new version, the mapping capabilities of Submap are further enhanced, allowing users to visualize and compare the smoothness (or roughness) of the seafloor with the areas where large subduction related earthquakes have occurred (Figure 2). Additionally, Submap allows users to plot various data sets, including topography and bathymetry (topography being the shape and relief of an area above water, and bathymetry being the same, but underwater), sediment thickness, and seismicity, in cross-section along transects through the SECTION-Geodyn module (Figure 3). Finally, the Submap website goes beyond visualisation, providing the Sub-DATA tool, which allows users to download structural, geodynamic, and kinematic data from transects spanning subduction zones worldwide.
What is new?
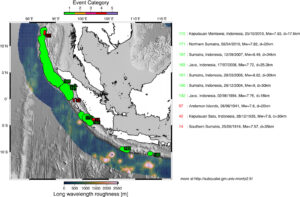
Figure 2. An example map generated using MAP-Subquake, showcasing the variations in roughness of the ocean floor in the Sumatra-Andaman subduction zone through different color shades. The bluer the color, the smoother the ocean floor. Furthermore, the map highlights regions of past earthquakes denoted by colored polygons, with green representing earthquakes occurring after 1990 and red indicating earthquakes prior to 1990.
The latest Submap update introduces several exciting features. Alongside the addition of the MAP-Subquake module, the website has undergone a complete revamp, offering a seamless and user-friendly interface for easy navigation. Users can now interactively select their study area and choose to plot data using scientific colormaps by F. Crameri, specifically designed for individuals with color-vision deficiencies. But that’s not all! Submap now grants access to new global dataset such as Slab 2.0, Crust 1.0, and Globsed and the Submap database has been updated and expanded. Lastly, users can download .eps versions of the maps and sections created using the Generic Mapping Tool, as well as .csv files of the transect parameters.
Embark on Your Submap Journey
We hope this post has piqued your interest in the Submap tools! There is a lot more we couldn’t fit here that you will find on the website. Researchers, educators, and enthusiasts are invited to embark on their own Submap tour, exploring its powerful tools, providing valuable feedback to the Submap team, and uncovering the secrets of subduction zones. Happy exploring!
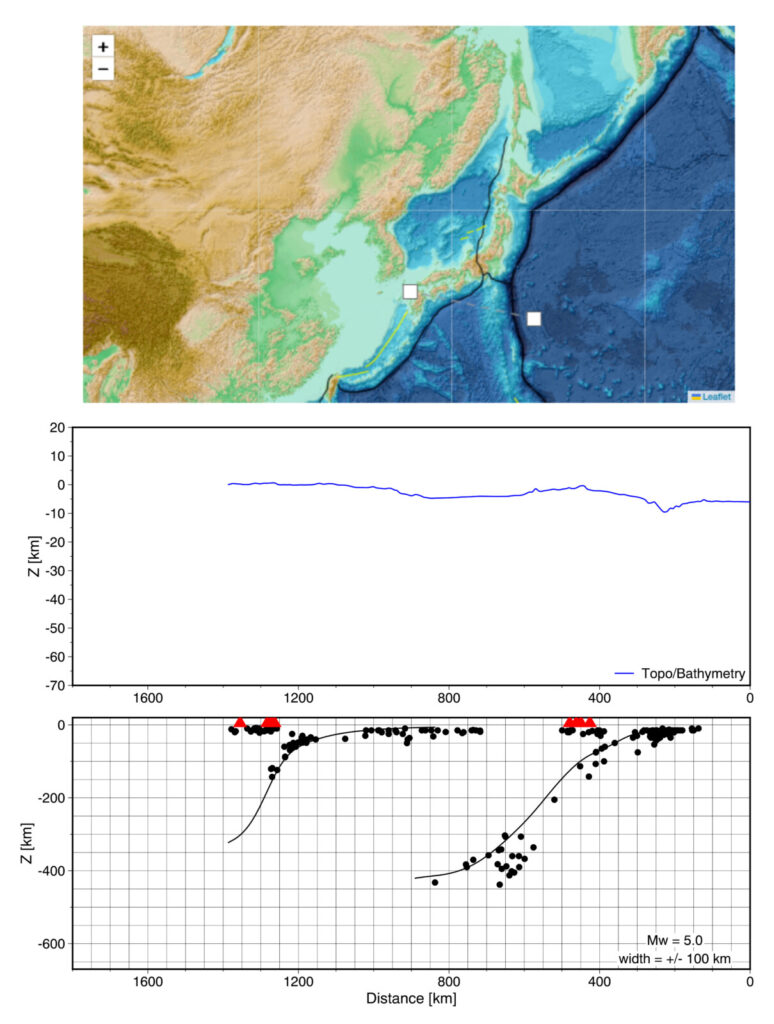
Figure 3. An example of the SECTION-Geodyn tool. The top panel depicts the positioning of a cross-section spanning the Izu-Bonin and Nankai subduction zones. The middle panel displays the topography and bathymetry (y-axis), while the bottom panel showcases the upper surface of the subducting plates into the mantle, along with the locations of earthquakes (represented by black circles) and volcanoes (indicated by red triangles).
Edited by Samuele Papeschi & Hannah Davis