This guest post was contributed by Afroz Shah who is an Assistant Professor of Structural Geology at the Department of Geosciences, Universiti of Brunei Darussalam (UBD). He has completed Ph.D at James Cook University, Australia in 2010, post-doctorate at Earth Observatory of Singapore in 2013 and joined the first academic job as a Senior Lecture of Structural Geology at Curtin Sarawak, Miri, Malaysia before joining UBD. His research mainly involves brittle deformation of lithospheric plates with a main focus on earthquake-causing faults in South and Southeast Asia. He is enthusiastically involved in earthquake science education and outreach and writes frequently in newspapers, magazines, and blogs.
Earthquakes originate on faults; therefore, it is essential to map the surface and sub-surface expression of faults to understand the process of faulting and how faults maintain characteristics of previous earthquake episodes. The faults come in different shapes and sizes, but broadly, there are three basic types: normal, strike-slip, and reverse (Fig. 1). Normal faults are inclined fractures where the rock mass above the fault plane, known as hanging wall, has downward movement (Fig. 1A), whereas the reverse faults have the hanging wall riding upwards on the fault plane (Fig. 1B). Strike-slip faults are different because their movement is sideways (Fig. 1C), and as such, there is no hanging wall or footwall. Some faults rupture the surface and can be observed on aerial photographs, satellite imagery, and the field, while others are harder to locate as they are blind and run underground. Earthquake geologists can detect faults by observing evidence in topography, deflection of rivers, geology, geomorphology, etc. Hunting for faults is entertaining because it necessitates searching for a variety of expressions that differ from place to place, and scientists have created a variety of strategies to do this [1,2,3,4,5].
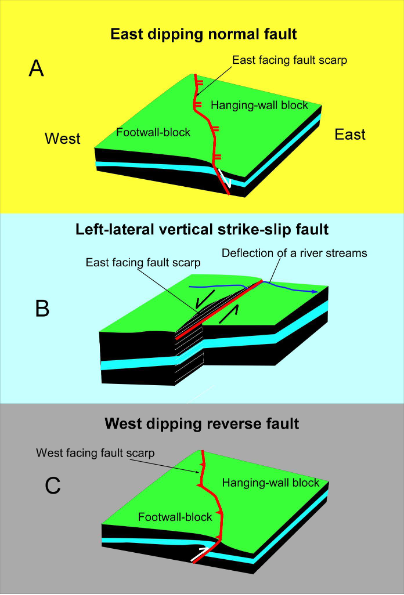
Figure 1: 3D sketches illustrate the three basic fault types; normal (A), strike-slip (B), and reverse (C). (Image credit: Afroz Shah).
Historically, the investigators usually focused on the “low hanging fruit”, which meant faults with a clear geomorphic expression. Therefore, the mapping was done using photo-mosaics, aerial photographs, and field methods [1,2]. The subsurface extension of the active faults was hard to investigate because of the lack of both apparent geomorphic expression, and geophysical technologies. The advent of more sophisticated mapping tools and geophysical methods now enables the mapping and probing of the surface and subsurface expressions of active and inactive faults [3,4,5,6,7,8]. The ruptured portions of faults leave a variety of geomorphic features that have been extensively used in the mapping, and a large amount of literature has been accumulated over the years on this subject (some citations are provided above). However, to the best of my knowledge, snow has never been used as an indicator to map fault zones, and here I will convince you that snow is an efficient guide to hunt for faults and, in particular, the active faults.
Usually, snow is akin to a sediment blanket that is expected to cover the fault, and often it does that. But my experience over the years suggests that snow can be an excellent guide to locating fault zones. It is the amount of snow that makes a difference. For example, if the snow cover is relatively thin, and therefore cannot hide the fault zone completely, then there are more chances that the fault zone will be highlighted by snow. Also, the geomorphic expression of the fault plays a critical role. The distinctive scarps with a significant vertical displacement will be easy to spot because more snow will accumulate within the fault zone and on the hanging wall than the footwall portions in normal faults. Reverse faults will be the opposite of that. It will take more time to melt the large quantity of accumulated snow in the fault zone, thereby increasing the chances of seeing the fault scarp clearly. The fault example below shows a fault zone in the northern part of the Kashmir basin, India (Fig. 2). The Google satellite image shows the snow-covered scene of the fault zone, where a blanket of snow has covered the entire extent of the fault zone. However, the fault zone is traceable and illuminates a clear fault scarp (Fig. 2B). The fault has been mapped as an oblique fault where a strike-slip component is associated with a dip-slip [9]. A subsequent image was captured when the snow had melted but left evidence of the snow along the fault’s strike because the vertical displacement on the fault plane has created a well-developed fault scarp (Figs. 2C and 2D). The scarp’s shadow protected a portion of snow from melting. This remaining trace of the snow highlights the fault zone and demonstrates an example where snow can act as a guide to locate the fault zone. The fault zone can be interpreted either as an oblique normal fault or oblique reverse fault. The fault scarp faces north, and several streams are forced to deflect, creating a dextral strike-slip movement along the fault’s strike.
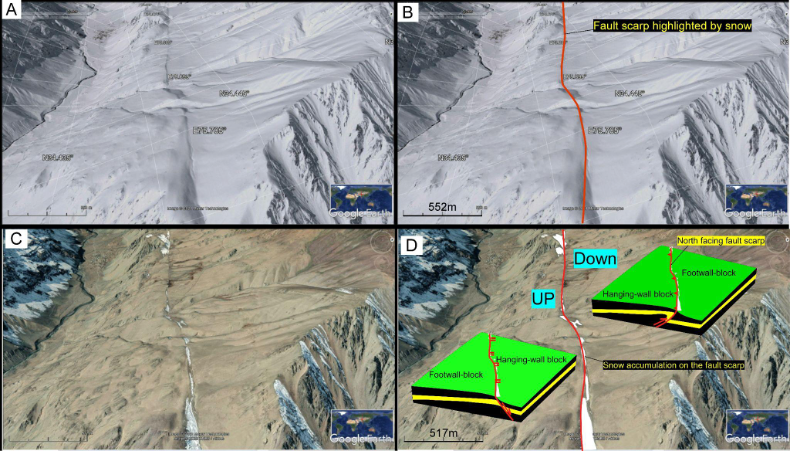
Figure 2: The Google satellite images show the Dras fault zone in the Kashmir Himalaya. The uninterpreted images are on the right (A and C), and the interpreted images are on the left (B and D). The snow has made it easy to locate the strike length of the fault zone. The Google satellite images were screen-captured on 29th January 2022. (Image credit: Afroz Shah).
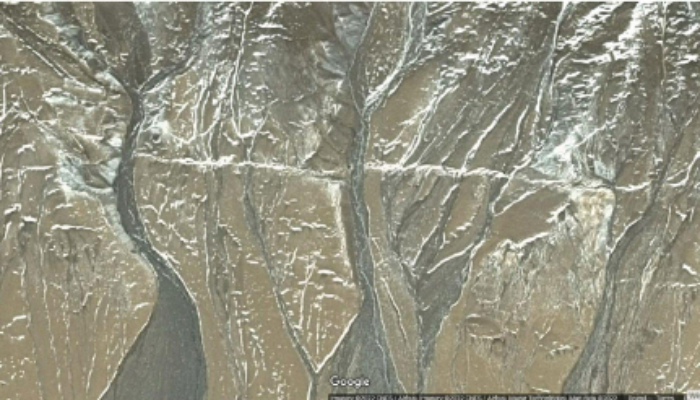
Another excellent example shows ~east-west trending fault zone pierces through a Quaternary landform made of fluvial terraces and fans. The fault is active, and the rupture zone is mappable for more than 3km. The topographic expression of the fault zone is exposed through a series of discontinuous fault scarps that are highlighted by the thin snow cover. The snow accumulation beautifully illuminates the details of the rupture zone with a bright and linear pattern (Fig. 3) that extends east-west, indicating that the fault is east-west trending. The details of the snow pattern mimic the strike of the fault zone, and the accumulated snow highlights horizontal and vertical displacement and a sense of slip. The fault zone is steeply dipping, which is indicated by the narrow width of the fault zone and is typical of strike-slip faulting. It is generally easy to identify strike-slip fault zones from the aerial views because of the lateral displacement, which is usually captured by the deflected stream patterns; reflective of slip.
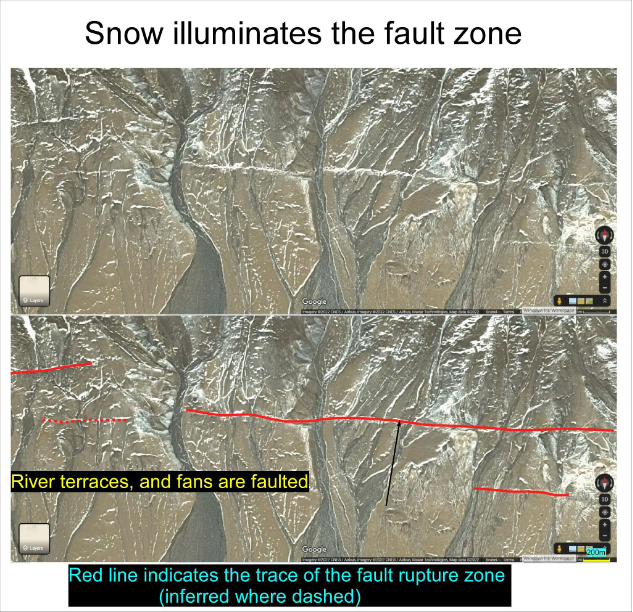
Figure 3: The Google satellite image shown above is the uninterpreted fault zone, interpreted below. The snow has nicely sketched the details of the active fault zone. The Google satellite images were screen-captured on 27th January 2022. (Image credit: Afroz Shah).
The above examples demonstrate that snow can be used as a guide to locate fault zones. The snow is beneficial to hunt for fault zones that have formed some topographically evident expressions by faulting. Therefore, the usability of snow to search for fault zones could be a good choice in regions that are seasonally covered in snow. Traditionally, geologists have avoided mapping fault zones using the snow-covered images because it was assumed that faults would be concealed. However, the above examples show that sometimes snow can reveal the trace of fault zones and aid in mapping.
References
[1] Willis, B. (1921). Aerial observation of earthquake rifts. Science, 54(1395), 266-268.
[2] Willis, Bailey, and H. O. Wood. “A Fault Map of California.” Science 59, no. 1527 (1924): 310-311.
[3] Allen, C.R., 1975. Geological Criteria for Evaluating Seismicity. Geo-Marine Letters, 86(8), 1041–1057
[4] Keller, E.A. & Pinter, N., 1996. Active tectonics. Prentice-Hall, Upper Saddle River, N.J, 19, 2.
[5] Trifonov, V.G. & Kozhurin, A.I., 2010. Study of active faults: Theoretical and applied implications. Geotectonics, 44(6), 510-528.
[6] Burbank, D.W. & Anderson, R.S., 2011. Tectonic Geomorphology. Wiley. 474 p
[7] Shah, A. A. (2013). Earthquake geology of Kashmir Basin and its implications for future large earthquakes. International Journal of Earth Sciences, 102(7), 1957-1966.
[8] Ren, Z., Zielke, O. & Yu, J., 2018. Active tectonics in 4D highresolution. Journal of Structural Geology, 117, 264-271
[9] Shah, A. A., A. Rajasekharan, N. Batmanathan, Zainul Farhan, Qibah Reduan, and J. N. Malik. “Detailed tectonic geomorphology of the Dras fault zone, NW Himalaya.” AIMS Geosciences 7, no. 3 (2021): 390-414.

Xin Xianwu
There is another way that rock layers move that also cause earthquakes: positive fractures in rock layers. This fracture is accompanied by the formation of high mountains and deep valleys on the surface.