This blog post about drone photogrammetry for seismology research is written by Lars Gebraad, with contributions from Isamu Naets and Patrick Marty. Lars Gebraad and Patrick Marty are doing their doctorates at the Seismology and Wave Physics group and Isamu Naets did his PhD at the Geothermal Energy and Geofluids group, both at the Dept. of Earth Sciences, ETH Zürich.
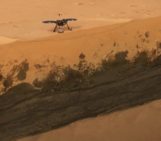
Like many techy outdoor youngsters, I fell for the temptation of drones. Although I promised myself a few years ago to never buy one of those annoying, obnoxious aircraft, at the end of 2021 I caved and got a DJI Mavic Air 2, a pretty standard enthusiast level drone.
At the time, I got this drone for landscape photography and sports videography, purely for leisure. It turns out, in our seismological field campaigns, these are useful (and fun). In this blog post I want to share our experiences in using the footage from typical consumer drones, to make geometrical reconstructions of field sites, and what we use these reconstructions for. In our experience, making these scans is relatively low-effort and low cost; based on free and open-source software that require no programming knowledge. If interested, please feel free to email us to have some guidance in setting up our suggested workflow.
Photogrammetry
The idea to do photogrammetry for seismology fieldwork was not born out of necessities of the fieldwork, or even a research proposal. We started simply because we as doctoral candidates must take mandatory classes outside our field of research, and thus Isamu (working on volumetric fluid flow imaging) and I (working on seismic inverse problems) ended up in the course 3D Vision. This is a course at our university discussing algorithms to make 3D reconstruction from imagery and using those reconstructions for e.g., AI tasks. As we’re enthusiastic about this kind of tech, us taking the course and doing the mandatory projects on photogrammetry developed into “I bet we could do this with our own drone”.
To be a bit more precise, photogrammetry is the process of reconstructing objects or one’s environment from imagery. This is typically done in the following steps:
- Start with at least 2 images of the same object, all taken from a different location.
- Knowing the camera location and orientation, project a line out from the camera to the object.
- Intersect the (at least) 2 lines to find the coordinates of your object.
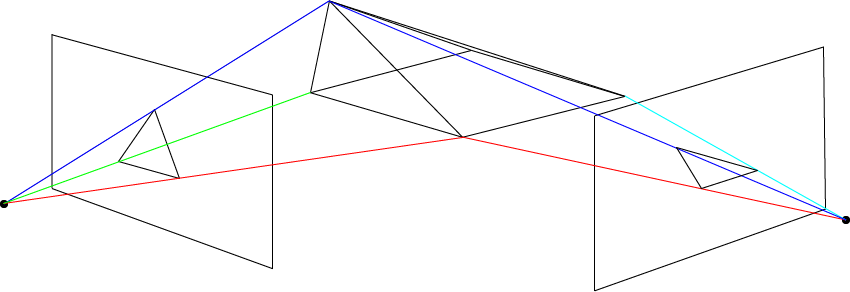
Figure 1: This figure schematically shows how an oblique pyramid maps differently to images taken from different angles. Inversely, it also shows how the images can be reprojected to obtain 3D shapes, by intersecting the projections of common points, i.e., in this case all lines of similar color. Image credits: Lars Gebraad
Because one can take a photo of multiple objects at once (it’s neat, try it), you can place a lot of objects in one go using only a few photos! What’s more is, if you keep track of the entire surface of the object, you can reconstruct that accurately, and so model the object in addition to knowing where it is. This in total creates an inverse problem: given some photos taken at some coordinates, reconstruct the location of all visible points in these photos to surfaces in a 3D space, triangulation much like event location in seismology, except with arrival directions instead of time-of-flight.
Structure-from-Motion
Away from the lab setting, things get harder. One wouldn’t want to label all the surfaces of all objects (that sounds like a lot of work), so you need an automated way to recognise patterns (or common points) in photos. Also, changing lighting from the sun and other noise sources might introduce some noise to our triangulation, so we need more than simply 2 images of every single common point. But what maybe the hardest thing of all: we don’t typically know the orientation and location of the cameras of any given photo! To get around all this, the inverse problem that Structure-from-Motion (SfM) algorithms solve is actually a “joint” problem: solve for all the surface, and camera locations, in an iterative fashion. These algorithms randomly throw all cameras somewhere in a 3D space (with some smart rules), and in an alternating way update the seen surface and the camera geometry using gradient descent methods.
For this, we use WebODM, a version of OpenDroneMap (ODM). This software comes entirely set up in a so-called Docker container. Docker is a program that allows you to pack up software and run it on a different machine without setup. You can find the Docker for WebODM here. and accessed easily through your web-browser. You upload your photos, your computer thinks for a bit, and out comes a shiny 3D model of your field site! This is cool, and above all, free.
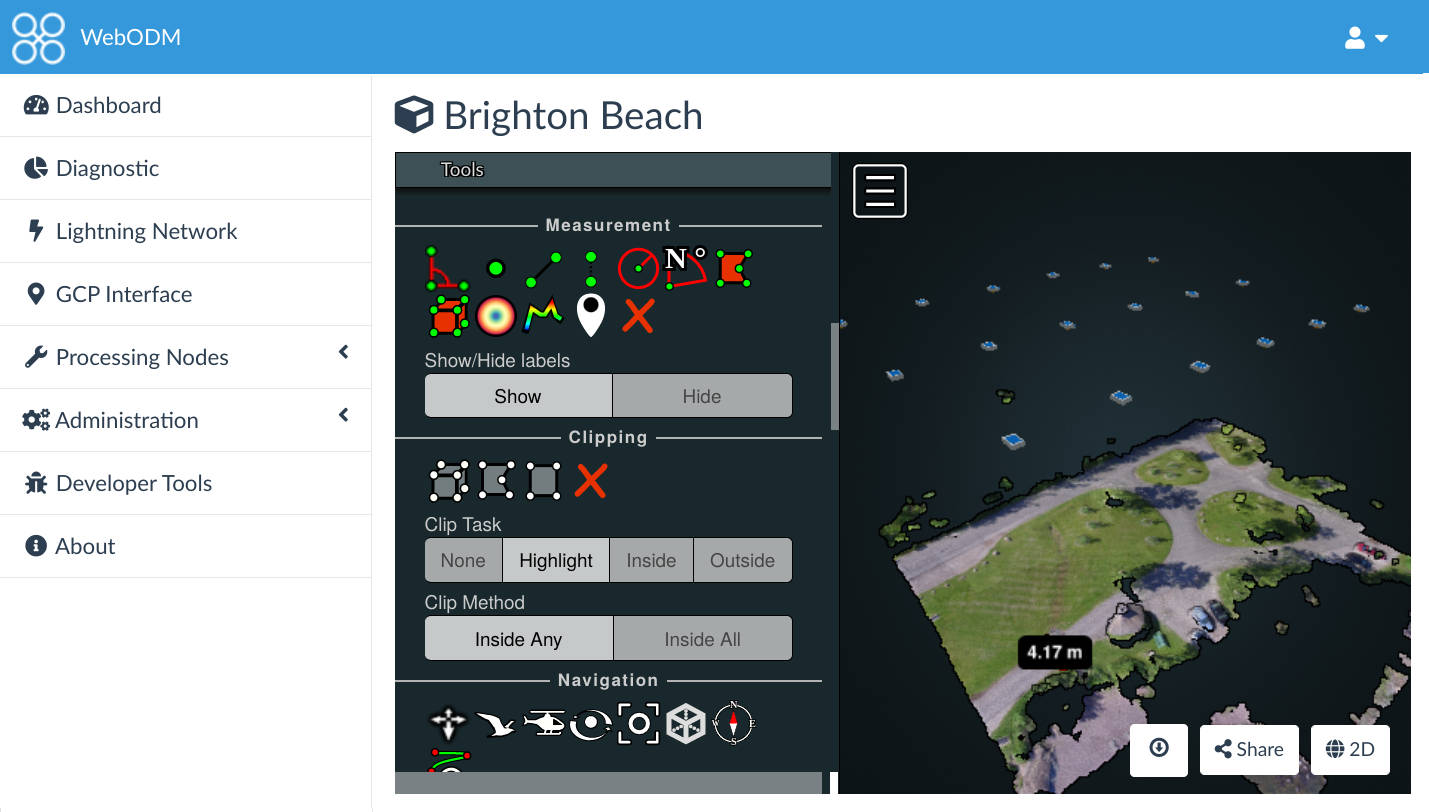
Figure 2: The WebODM interface. It’s simply drag and drop your pictures into it, and after processing (which can last a bit) gives you the visualization in your browser without extra software. The outputs are in all kinds of formats.
Seismic simulations from drone images
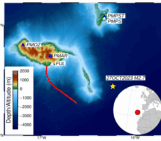
To give purpose to our Structure-from-Motion reconstruction, we wanted to plan a fieldwork to a location that was of interest to us as seismologists (and pizza-lovers). We ended up in southern Switzerland, on the movie-famous Verzasca Dam. You might remember this dam from the opening of James Bond GoldenEye from 1995.
Our plan was relatively simple: try to digitise the dam and surrounding topography and somehow get it into a format that is accepted by our wave equation simulation software. The idea was that if one can do this, it is relatively straightforward to simulate any existing geometry by simply scanning it with a drone or camera and pushing it through our pipeline.
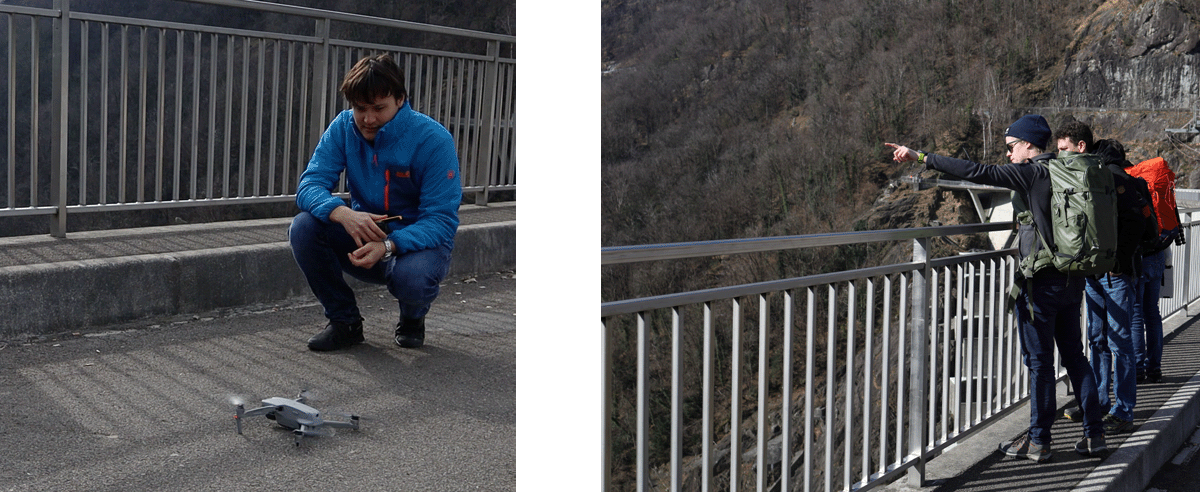
Figure 3: We almost looked like we knew what we were doing. Photos: Lars Gebraad.
However, to set up drone flights on the Verzasca Dam is bureaucratically involved. So as a disclaimer, always make sure you have the proper insurance flying a drone anywhere (this is legally required in Switzerland). Because it is also a power station, we had close contact with the operators beforehand. Lastly, it is relatively close to an airfield down the valley, so we also had to apply to Air Traffic Control with our flight. Green light!
Figure 4: multiple images from an orbit using DJI’s hyperlapse function, which we found ideal for consistent flight patterns that have good sampling. (Image not moving? Click for GIF!). GIF by Lars Gebraad.
Doing the reconstruction was smooth and very quick. We flew for 2-3 hours over the dam, trying all kinds of patterns. The drawback of using off-the-shelf consumer hardware is that it does not come with auto-flying or survey design, so we were doing most of our flight patterns by eye, guesstimating what the final resolution would be (but there are better ways and guidelines). The result of that approach are the following beautiful flight patterns, along with the point cloud of the reconstruction.
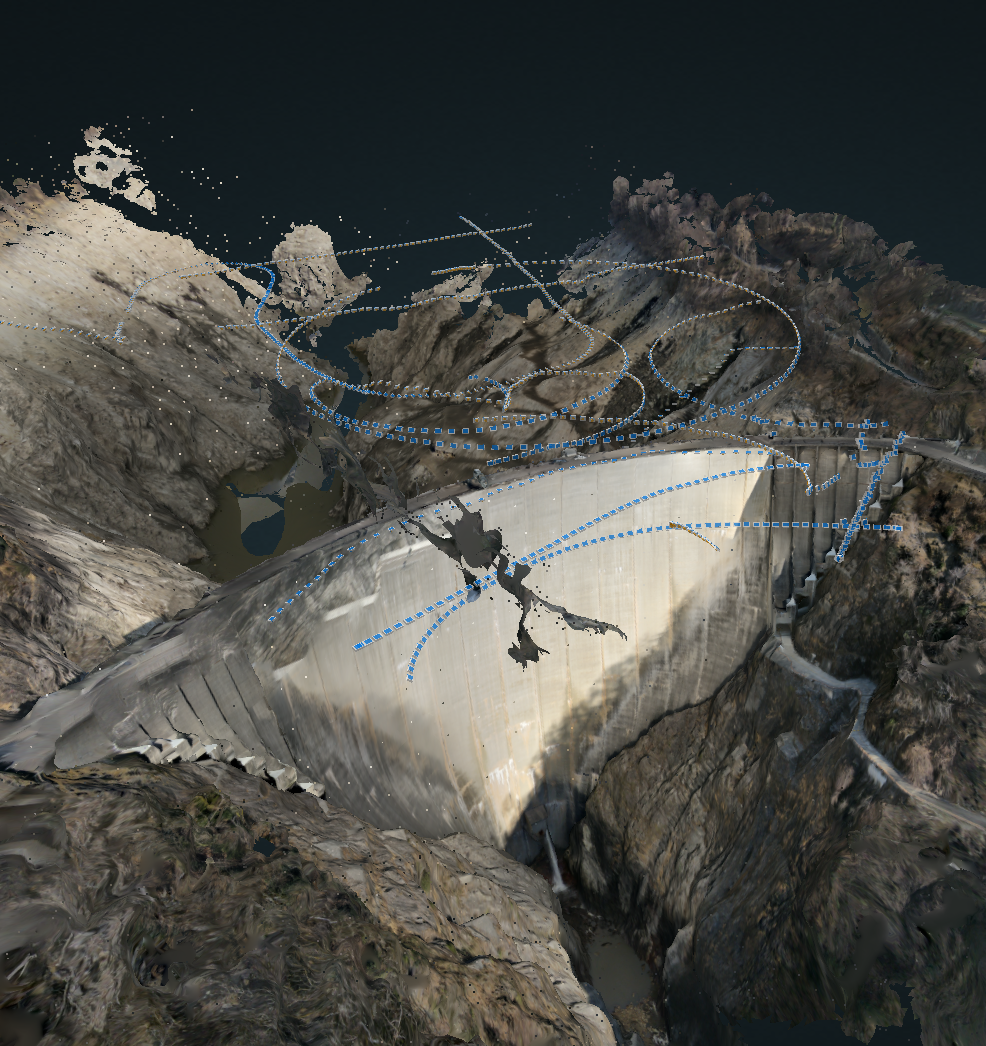
Figure 5: images used in the reconstruction and generated point cloud, visualized in browser using WebODM. Image credits: Lars Gebraad.
We were, however, amazed at the level of detail this provided. Not only were we able to map a relatively large area surrounding the dam (easier, because this just happened: Italian, German), but we were able to digitise all complex geometry between the dam and the topography. There are some limitations regarding water (reflective surfaces are NOT fun for projections), moving objects and the fine details of the dam, but we assessed that these things don’t strongly impact what’s to come.
The produced point cloud looks good, and in the online viewer of WebODM even comes with colors. However, we are interested in science, and as such, Patrick worked his magic to turn this point cloud into a hexahedral mesh that is accepted by our wavefield simulator, as seen below.
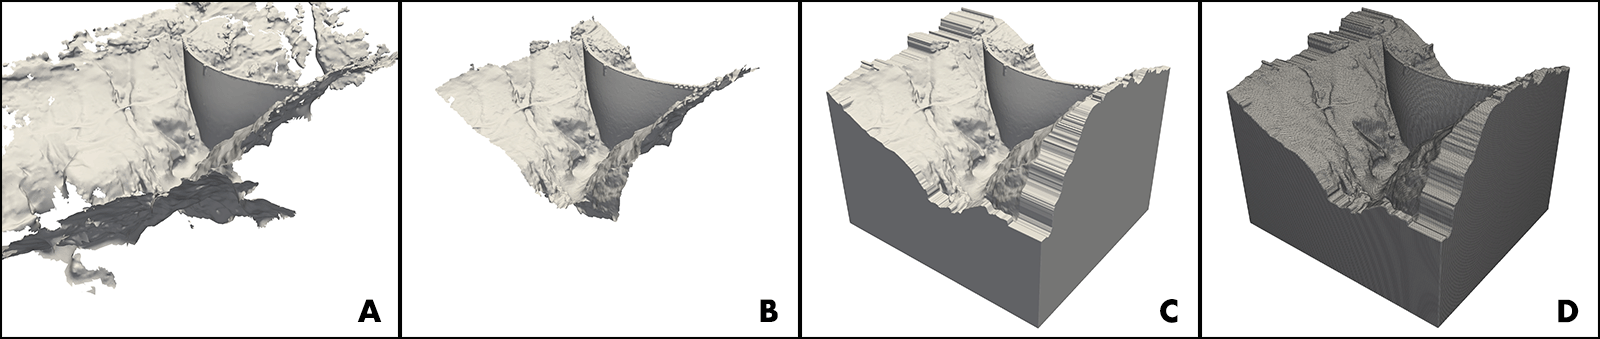
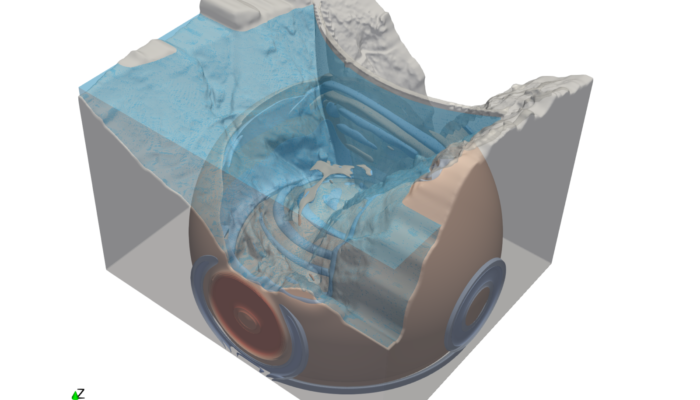
Figure 6: The process from a surface point cloud to a hexahedral mesh. In step A, the point cloud is already converted to a surface mesh. Step B is the sculpting of the mesh, including the removal of superfluous areas, as well as plugging some holes, done in Blender. Step C is the horizontal and vertical extrusion, to go from a surface to a volume. Step D is the generation of a hexahedral mesh from a volume using Cubit. Image credits: Lars Gebraad.
Then, all that remains is to press the button in the software to simulate some waves! We used Salvus (Afanasiev et al., 2018) for this simulation. For your reference, here we simply tried a point source at the bottom of the volume, used a medium composed of either bedrock or water, and simulated the elastic wave equation (acoustic wave equation in the water).
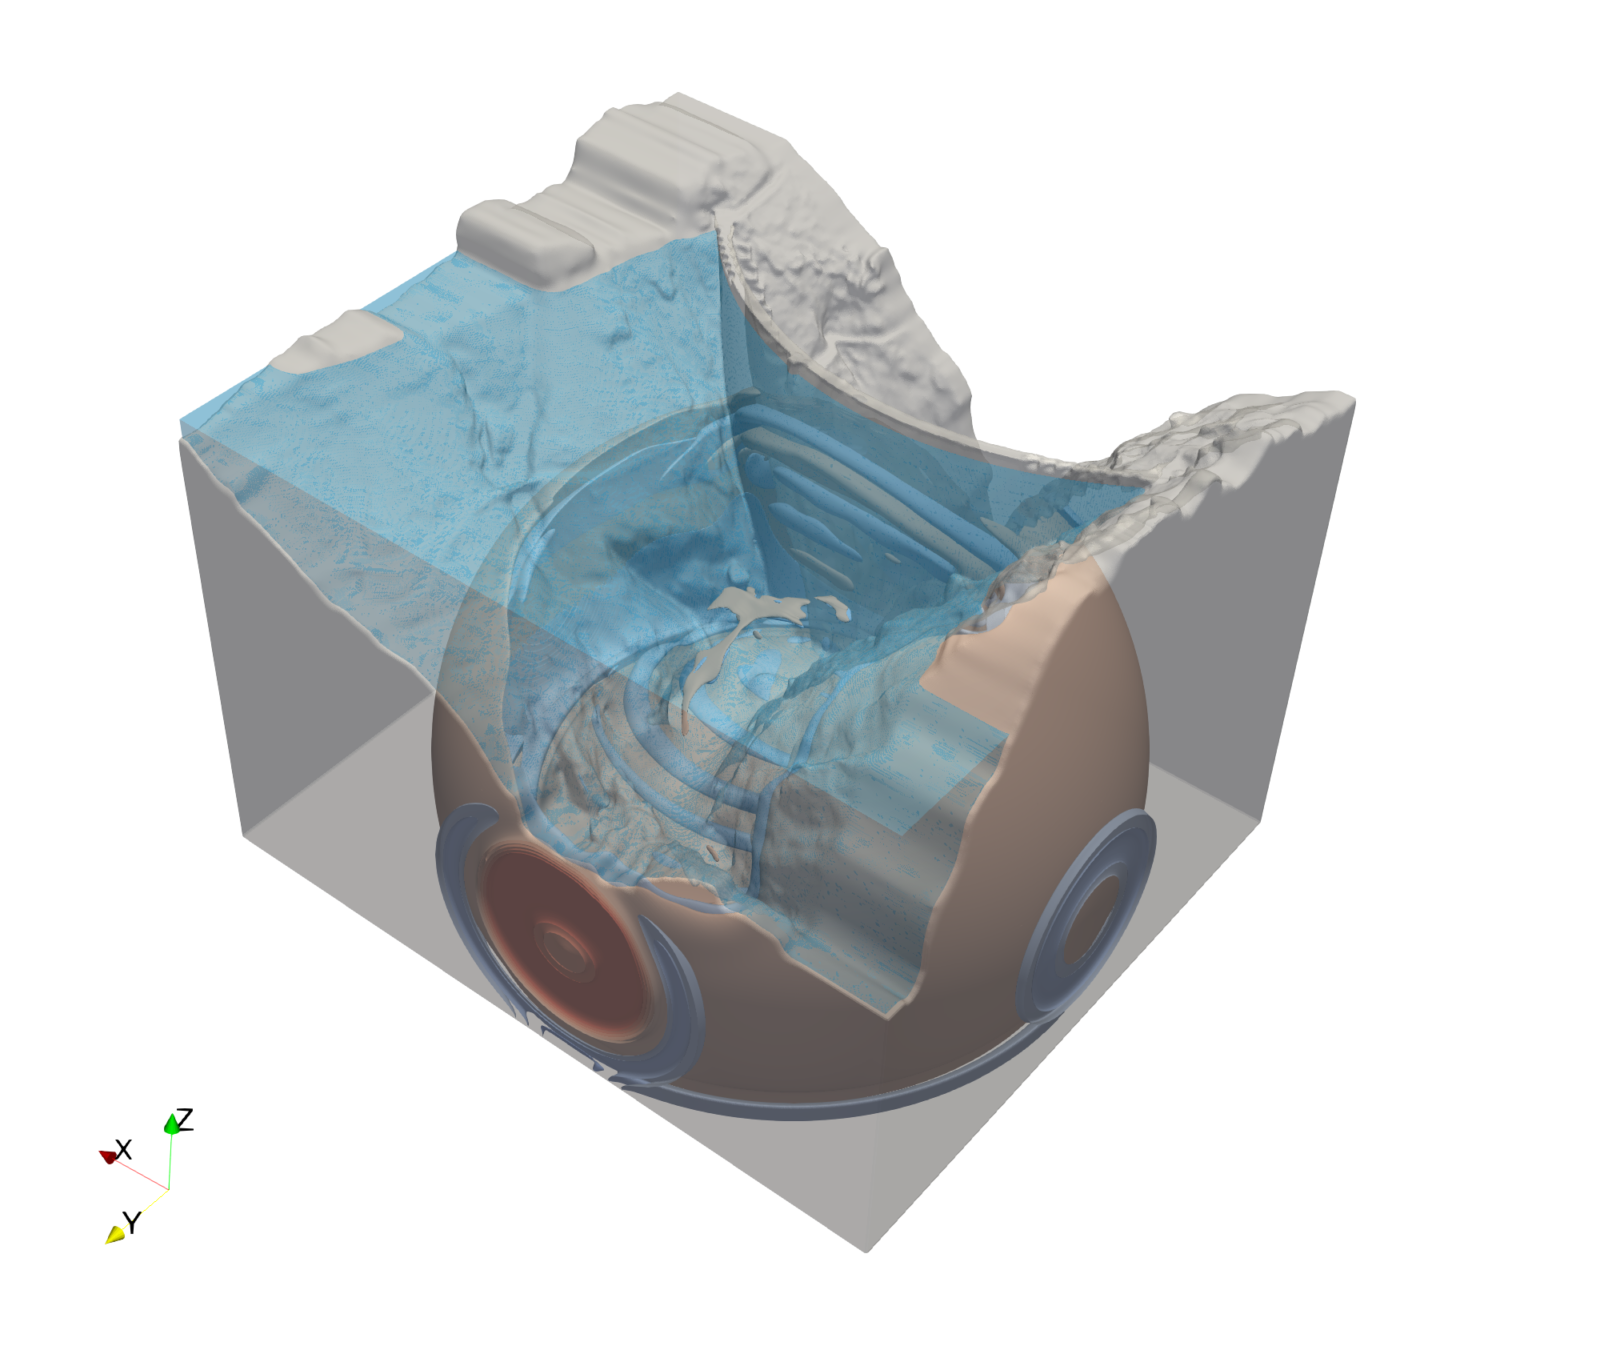
Figure 7: A wavefield simulation in our coupled media. Image credits: Lars Gebraad.
Avalanche monitoring
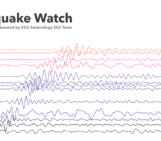
The first thing we tried, before our wavefield simulations of the Verzasca Dam, was to do a reconstruction of a field site that was recently altered by natural processes. On the Fluelapass in Switzerland, a dark fiber is present which Pascal Edme et al., 2023, used to monitor and localise mass movements. In winter, this high altitude pass is closed to traffic, as the heavy snowfall make it too dangerous to keep clean and opened.
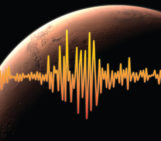
In the early spring of 2022, several tremor signals were detected using this dark fiber, strongly suggesting that a(n) event(s) had occurred. However, with the pass closed, it is impossible for us to verify whether an avalanche had occurred. Using touring skis, we ascended from Davos under guidance of some local researchers from the Institute for Snow and Avalanche Research (SLF). We were able to overfly the area of suspected mass movements and verify that these were mass movements! See the video below for a short report.
Video: ETH SWP / Lars Gebraad
Final thoughts
This seems to work well. We will leave the detailed seismological analysis of all these products for a later publication, so if you are interested, keep an eye out! We are excited to try it in a few more scenarios that would require wavefield simulations, and we think this kind of reconstruction is not only useful for simulations, but in many support roles for fieldwork. Spatial analyses like the avalanche monitoring fieldwork benefit strongly from highly detailed surveying that is accessible to all scientists.
Want to see more work from Lars? Find out what he’s up to on his Twitter account @larsgebraad
References
This blog post was written by Lars Gebraad, PhD student at the Seismology and Wave Physics group, Dept. of Earth Sciences, ETH Zürich. It was edited by ECS member Katinka Tuinstra.