Extreme heatwaves of unprecedented magnitude are expected to become increasingly frequent in coming decades. These heatwaves come with severe consequences for human health, infrastructure planning, and economic prospects – particularly during events lasting multiple weeks [10]. In recent decades, Western Europe has become a hot-spot for record-breaking and long-lasting heatwaves [9], raising a critical question: How extreme could future heatwaves in this region plausibly get?
One way to answer this question is to use ‘storylines’, for example, climate model simulations of hypothetical future heatwaves [8]. These storylines offer tangible ‘what-if’ scenarios that characterize the intensity of possible future events that society should prepare for. However, there lies another fundamental question: Just because an event appears in a model, does that mean it could actually happen in the real world? This question is difficult to answer, given the fact that unprecedented events by definition are more extreme than all previous extreme events. In a recent study [6], we addressed this question from a physical perspective by analysing the processes that can lead to an unprecedented heatwave, and how these compare with historical events.
How we assess plausibility
Using CESM2, a widely-used global climate model [5], we simulate a large number of Western European heatwaves, the most extreme of which are expected to occur just once in 1,000 years in the present climate [2,4]. We compare these simulated heatwaves to historical heatwaves using the ERA5 reanalysis, which combines meteorological observations with an atmospheric model to provide a comprehensive and consistent estimate of past weather [3]. To account for global climate change, we calculate how extreme these heatwaves are relative to the climate in which they occur. For example, the famous heatwave of 1976 in Western Europe was unprecedented and record-shattering at the time, but would be considered much less extreme in the present, much warmer climate. This is done by calculating standardized anomalies relative to the respective dataset’s climatology, which accounts for differences in the mean and standard deviation. To obtain a robust climatology, this calculation is performed for 30-year windows centered around each heatwave, yielding standardized anomalies of historical heatwaves for the period 1965–2010 (first column in Fig. 1).
In addition to the historical heatwaves, we also analyze three different sets of simulated heatwaves in CESM2, using the same analysis. We analyse simulated heatwaves in the same historical period as above (1965–2010, second column in Fig. 1), and for a period representing the present climate (2005–2035, third column in Fig. 1). Both of these sets of heatwaves are selected to have the same temperature anomalies as the historical heatwaves. Lastly, we perform the same analysis for simulated heatwaves of unprecedented magnitude, with much larger temperature anomalies (fourth column in Fig. 1).
Through this lens, we can compare a number of atmospheric and soil variables (so-called “heatwave drivers”) during historical and simulated heatwaves (Fig. 1). This helps us to assess whether the simulated heatwaves occur due to similar physical processes as historical heatwaves, a strong indicator for their plausibility. Our analysis shows that very similar heatwave drivers are present in all four sets of heatwaves, with the unprecedented heatwaves featuring stronger anomalies in the most important drivers (those with the largest positive/negative anomalies in Fig. 1). This demonstrates that even these very extreme heatwaves are caused by familiar and well-understood physical processes, and become particularly extreme due to a combination of particularly strong high-pressure systems and low soil moisture. In other words, these unprecedented heatwaves occur due to “extreme anomalies in common drivers” [1].
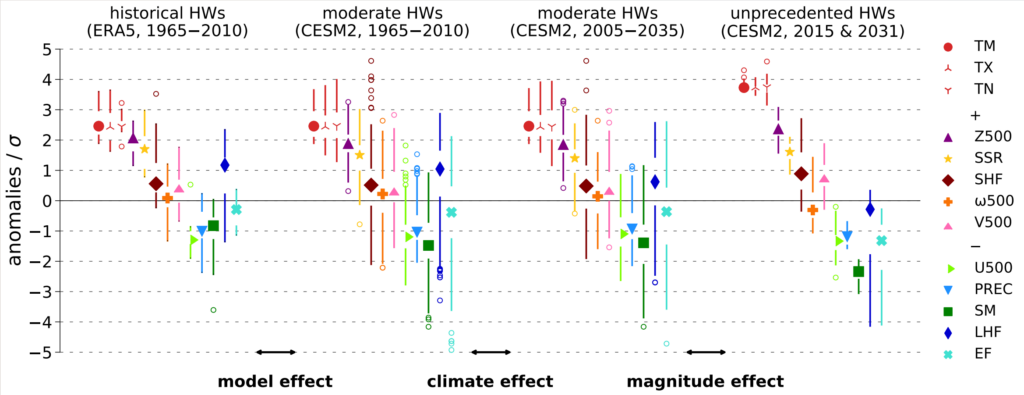
Figure 1: Standardised anomalies (relative to the respective dataset climatology) of important processes during historical heatwaves (first column), simulated heatwaves of similar magnitude in historical climate (second column) and present climate (third column), and unprecedented heatwaves from simulations in present climate (fourth column). The most important variables are temperature (red circle), the strength of the high-pressure system (purple triangle), the intensity of solar radiation (yellow star), and the moisture in the soil (dark green square).
However, we also find differences between the unprecedented simulated heatwaves and historical heatwaves. This for example concerns the temporal persistence of high-pressure systems and low soil moisture. We quantify this by looking at the number of consecutive days where the anomalies in these two variables exceed a given threshold (here we use one standard deviation, but other thresholds give similar results). We then count how often we observe periods with a given duration, for example, how many times a year we find a period of ten consecutive days above the threshold (Fig. 2). Comparing this between reanalysis and climate model, we find that the climate model simulates less persistent high-pressure systems (Fig. 2a,b), but more persistent periods of low soil moisture (Fig. 2c). These two effects partly compensate, causing the model to simulate the temporal persistence in temperature much more accurately, but it still underestimates the persistence relative to reanalysis. This indicates that the model is right for “partly the wrong reasons” [7], and that even longer-lasting heatwaves are plausible to occur in the real world.
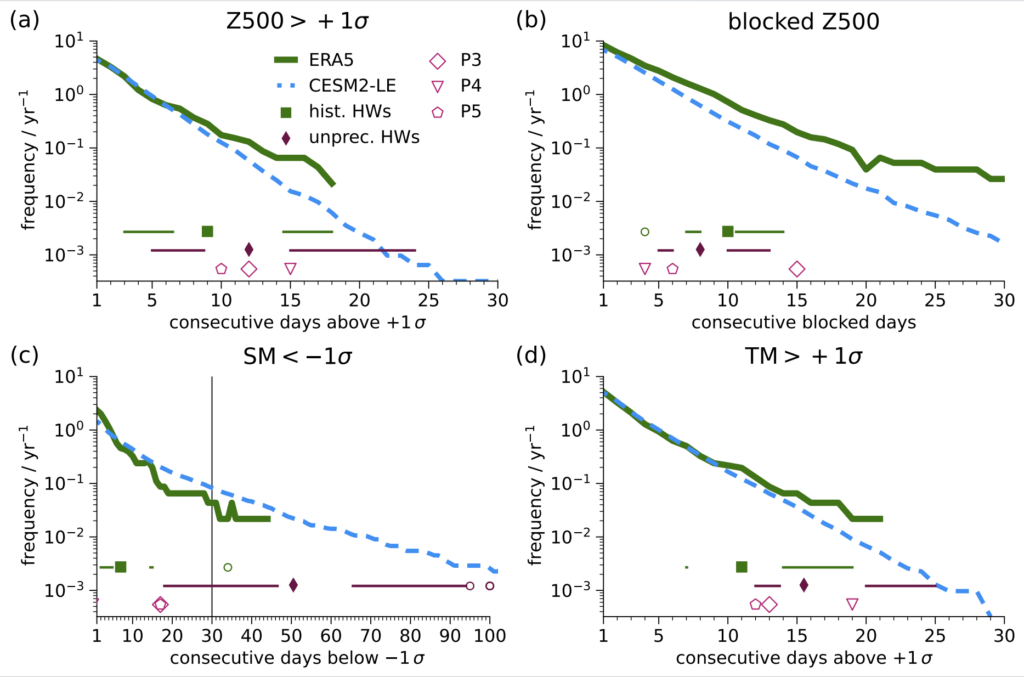
Figure 2: Temporal persistence, quantified by the number of consecutive days with anomalies larger than one standard deviation. Shown are the frequencies of different durations of such periods for anomalies in high-pressure systems (a, b), soil moisture (c), and temperature (d). We compare these between historical reanalysis (solid dark green line), and the CESM2 climate model used in this study (dashed light blue line).
Conclusions
So what does this mean? Our analysis suggests that the CESM2 climate model generally can realistically simulate month-long heatwaves in Western Europe of unprecedented intensity, but tends to underestimate their persistence. Thus, these heatwave storylines should not be dismissed as implausible — if anything, they represent a conservative estimate of future heatwaves. Therefore, these heatwaves warrant inclusion in risk assessments to guide disaster preparedness. Such assessments could, for example, be used to inform adaptation measures by cities to reduce the health impact of unprecedented heatwaves.
Beyond heatwaves, our process-based approach offers a promising framework for future work of assessing extreme event storylines more broadly. While the specific mechanisms differ for heavy precipitation, droughts, or wind storms, our method provides a valuable complement to traditional statistical approaches. Ultimately, this can help communities to make better-informed decisions about which simulated extremes deserve attention in planning for the future.
References
[1] Fischer, E. M. et al. (2021): Increasing probability of record-shattering climate extremes, Nat. Clim. Change, 11, 689–695, https://doi.org/10.1038/s41558-021-01092-9.
[2] Fischer, E. M. et al. (2023): Storylines for unprecedented heatwaves based on ensemble boosting, Nat. Commun., 14, 4643, https://doi.org/10.1038/s41467-023-40112-4.
[3] Hersbach, H. et al. (2020): The ERA5 global reanalysis, Q. J. Roy. Meteor. Soc., 146, 1999–2049, https://doi.org/10.1002/qj.3803.
[4] Lüthi, S. el al. (2024): Storylines for month-long heatwaves and associated heat-related mortality impacts over Western Europe, https://doi.org/10.21203/rs.3.rs-5356341/v1.
[5] Rodgers, K. B. et al. (2021): Ubiquity of human-induced changes in climate variability, Earth Syst. Dynam., 12, 1393–1411, https://doi.org/10.5194/esd-12-1393-2021.
[6] Roemer, F.E. et al. (2026): Assessing the plausibility of unprecedented events: a process-based approach applied to month-long heatwaves in Western Europe. Weather Clim. Dynam., 7, 1919-1949, https://doi.org/10.5194/wcd-7-1919-2026.
[7] Röthlisberger, M. et al. (2026): Advective, adiabatic and diabatic contributions to heat extremes simulated with the Community Earth System Model version 2, Weather Clim. Dynam., 7, 1363–1384,https://doi.org/10.5194/wcd-7-1363-2026.
[8] Shepherd, T. G. et al. (2018): Storylines: an alternative approach to representing uncertainty in physical aspects of climate change, Climatic Change, 151, 555–571, https://doi.org/10.1007/s10584-018-2317-9.
[9] Vautard, R. et al. (2019): Evaluation of the HadGEM3-A simulations in view of detection and attribution of human influence on extreme events in Europe, Clim. Dynam., 52, 1187–1210, 10.1007/s00382-018-4183-6.
[10] Zuo, J. et al. (2015).: Impacts of heat waves and corresponding measures: a review, J. Clean. Prod., 92, 1–12, 10.1016/j.jclepro.2014.12.078.
Blog post edited by: Navakanesh M Batmanathan and Hedieh Soltanpour