reading time: 10 minutes
The Tambora 1815 eruption: a brief introduction
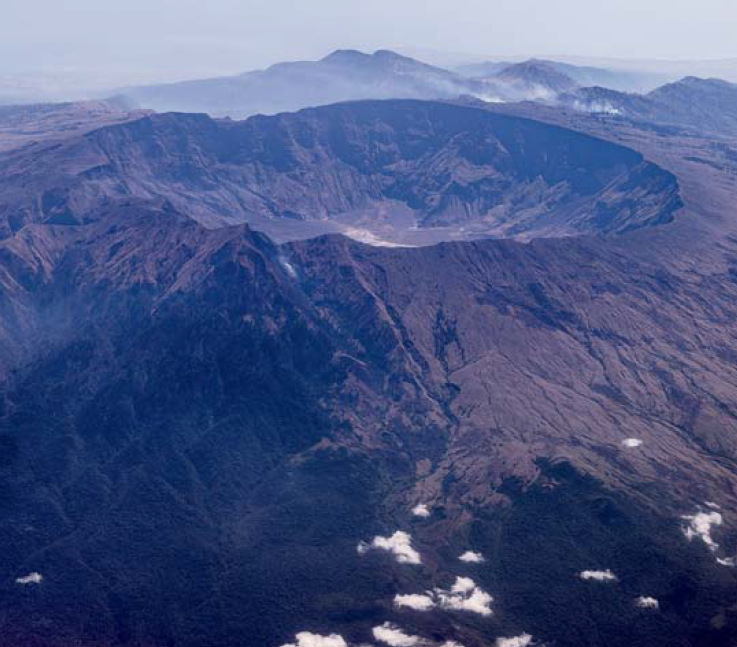
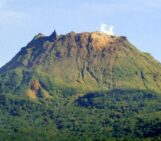
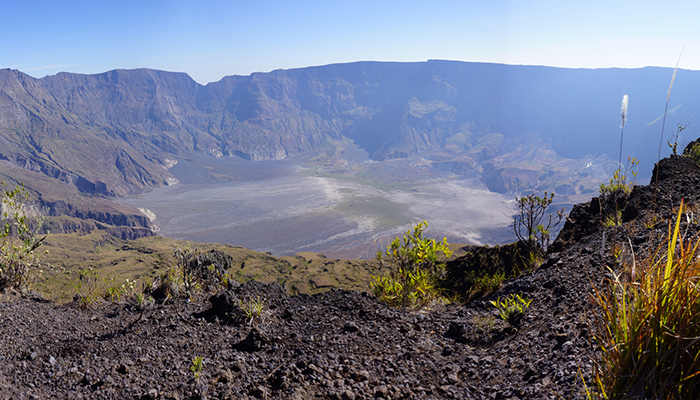
Figure 1 – Aerial view of the caldera of Tambora as seen today. (Photo by Manuel Marty in Brönnimann and Krämer, 2016).
On April 10th, 1815, the Tambora volcano, located on the island of Sumbawa in Indonesia, was responsible for one of the largest eruptions in the last millennium (Stothers, 1984; Sigurdsson and Carey, 1989; Oppenheimer, 2003; Self et al., 2004; Kandlbauer et al., 2013a; Kandlbauer and Sparks, 2014).
The eruption had a devastating impact both in the surrounding areas but also in much more distant areas. It is in fact believed to be responsible for major climatic imbalances. The year following the eruption, 1816, is also known by many as “the year without summer” (Oppenheimer, 2003; Kandlbauer and Sparks, 2014; Luterbacher and Pfister, 2015; Brönnimann and Krämer, 2016).
What do we know about this eruption? What impact did this event had on climate, agriculture, and global society? And what impact would an eruption of this magnitude have today?
Today we talk about all this and much more with Dr. Jessica Kandlbauer.
At the heart of events: from the eruption to its global impact
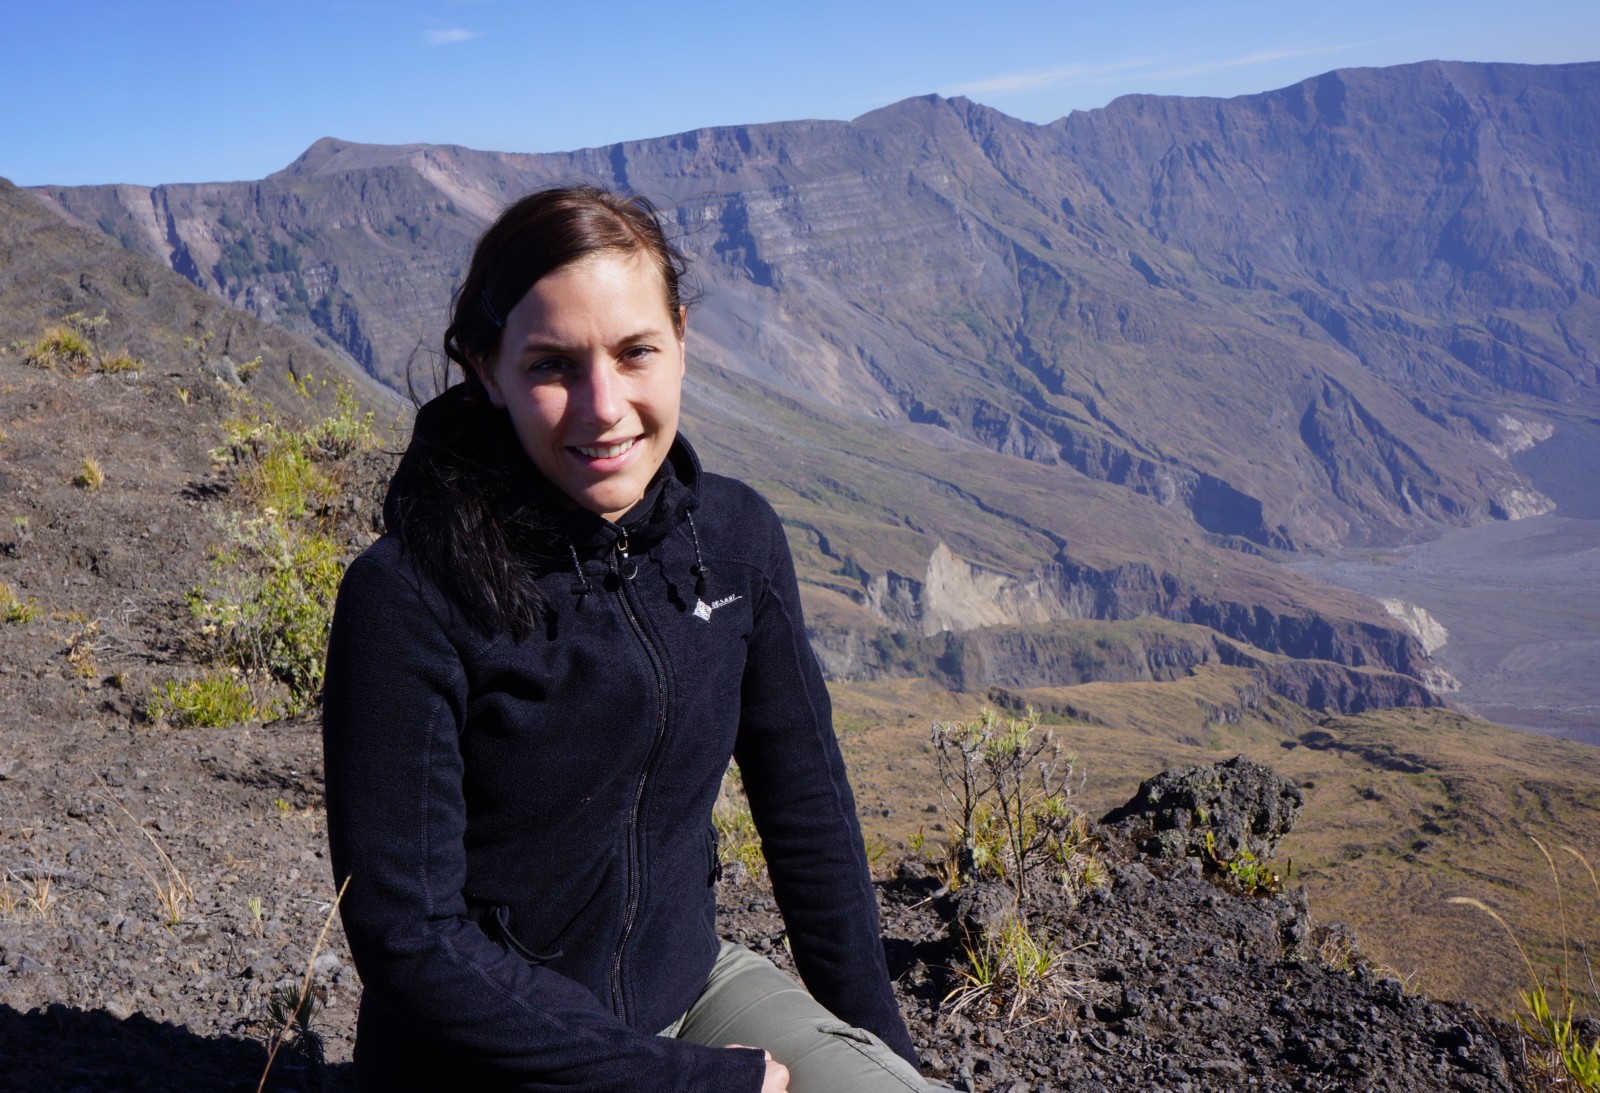
Figure 2 – A picture of Jessica Kandlbauer on the field.
Dr. Jessica Kandlbauer earned her bachelor’s degree in Geography from University of Zurich and her master’s degree in Geosciences from ETH Zurich. She holds her PhD in Volcanology and Earth sciences from the University of Bristol in the UK. During her PhD she worked on the 1815 Tambora eruption, specifically on the impact that such eruptions can have on climate, the environment, and the global community. She has been also Journal Manager for Frontiers in Earth Science and Frontiers in Environmental Science for 5 years. Additionally, she is the creator of an open access e-learning teaching platform, eVolcano, hosted by the International Association of Volcanology and Chemistry of the Earth Interior (IAVCEI) and she is currently the Project Manager of the platform.
So, Hi Jessica thank you for joining us today! I am very happy to have the opportunity to chat with you about one of the largest eruptions of the last millennium. Before we get into what are the consequences of an eruption of this magnitude, can you introduce us a little bit to what happened in 1815? What kind of eruption are we looking at?
Hi Alessandro, thanks for giving me the opportunity to speak about Tambora!
Tambora produced a first explosive eruption on the 5th of April 1815, after 3 years of minor activity of rumbling and dark clouds around the summit (Stothers, 1984). Explosions were reported as far as 1500km away on the Maluku Islands and the sound was almost unanimously attributed to cannon fire and military troops were sent out to find the cause (Hubbard, 1815). The next morning slight ash falls made the people realize that the source of noise was indeed a volcano (Ross 1816). While this first explosion counts ‘only’ as a pre-eruptive phase of the actual Tambora eruption, the eruption column height of about 33km (Sigurdsson and Carey, 1989) was still higher than the 79AD Vesuvius eruption!
After several minor explosions over the following days, the catastrophic explosive eruption started in the evening of the 10th of April 1815 around 7 p.m. – a Plinian eruption reaching an altitude of about 40 km, far higher than commercial planes fly. The volcanic ash cloud travelled as far as 1000 km (Self et al., 2004). Approximately 41 +- 4 km3 DRE of magma was erupted (Kandlbauer & Sparks 2014) and the whole mountain appeared like a ‘liquid fire’ (Raffles, 1835). After 3 hours of continuous pumice and ash fall, pyroclastic flows started to run down the volcano slopes after the column collapsed around 10 p.m. (Sigurdsson and Carey, 1989; Stothers, 1984). These pyroclastic flows ran into (and travelled over) the sea and triggered a destructive 4 m high Tsunami (Self et al., 1984; Stothers 1984), Heavy ash falls covered the islands Sumbawa, Lombok, Bali and the western part of Java with 20 to 50 cm of ashes, and a 1-2cm ash layer was found even in 1000 km distance from the volcano (Self et al., 2004; Stothers 1984). In Martapura people thought that ‘gold’ was falling from the sky and were collecting the ash to sell it as medicine (Zimmer, 1874). Mount Tambora lost more than 1400m of its height, and today’s caldera is about 6-7km wide (imagine having to run almost 10 km to cross the crater!) and is about 600-700m deep (Self et al., 1984; Stothers 1984).
The Tambora eruption in 1815 caused enormous devastation and famine on a global scale. In the immediate surroundings people were homeless and suffered of prevailing famine and epidemics as ash fall and pyroclastic flows destroyed villages and towns, nature and agricultural land. On a global scale, the sulphur emitted by Tambora dispersed around the globe rapidly and caused a drop in global temperatures, which consequently influenced agricultural productivity, leading to high food prices and famine in NE America and Europe.
Earlier this year, we all witnessed one of the most violent eruptions in recent years, the eruption that occurred at Hunga Tonga-Hunga Ha’apai. This eruption was classified with a volcanic explosivity index (VEI) of 5 or 6, while the Tambora eruption was classified with a VEI 7. What is the volcanic explosivity index and how much does it change between a VEI 5, 6 and 7?
The VEI is a logarithmic scale, thus, stepping up one level in the index means the volcanic eruption is actually 10 times bigger than the previous one. The index is based on the volume of material the volcano produced, as well as the column height and timescale of the eruption. I think it is a great tool to compare eruptions with each other at a first glance and being able to initially assess their potential impact. However, as every volcano erupt products with specific size distributions, and is located on a different geographical and socio-economical context, it is not so easy to simply compare the impact of volcanic eruptions based on 1-3 indicators. What if the volcano is very powerful but is located on a small, uninhabited island in the middle of an Ocean instead of central Europe? What if the eruption is very intense, ejecting large volume of material in the stratosphere, which contain very small amounts of sulphur?
There is much more to a volcanic event than just a number, but as said, I still think it is a very important tool to be able to compare and get a first idea of an eruption.
In one of your papers on the Tambora eruption, you focused on estimating the erupted volume. How can we calculate the amount of material erupted by a volcano and why is this important for assessing the volcanic hazard?
There are different ways of estimating the erupted volume, depending on the dataset you have some do make more sense than others. In the case of Tambora we have a limited dataset as Tambora is quite a golden ager, most of the ash went into the ocean, and for the rest of the deposit the tropical environment and growing vegetation did a beautiful job to hide/reuse the ash.
The most common way is using the volcanic ash fall deposit measurements and apply a thinning trend to calculate the total erupted volume. Another ‘crude’ way is to simply calculate the current caldera volume and previous (and now missing) mountain top to get an idea of the volume of the volcano obliterated by the eruption. We also used the estimated mass flux at the eruption vent and the eruption duration to get an idea on how much material was ejected by the volcano during the paroxysmal eruption.
All calculations have pros and cons and combined with the dataset you have available it might be best to compare the results of as many techniques as possible.
The erupted volume gives you an idea of the size of eruption and what you could expect comparing it to other similar ones (e.g. comparing the VEI). However, to assess the direct and indirect impact of an eruption on people, infrastructure etc. the most relevant parameters are the thickness and size distribution of the deposit at different distances from the vent.
As you just said a lot of material ended up in the ocean. How much does this affect the estimate of the erupted material? And how much confidence do we have in the volume estimates we make?
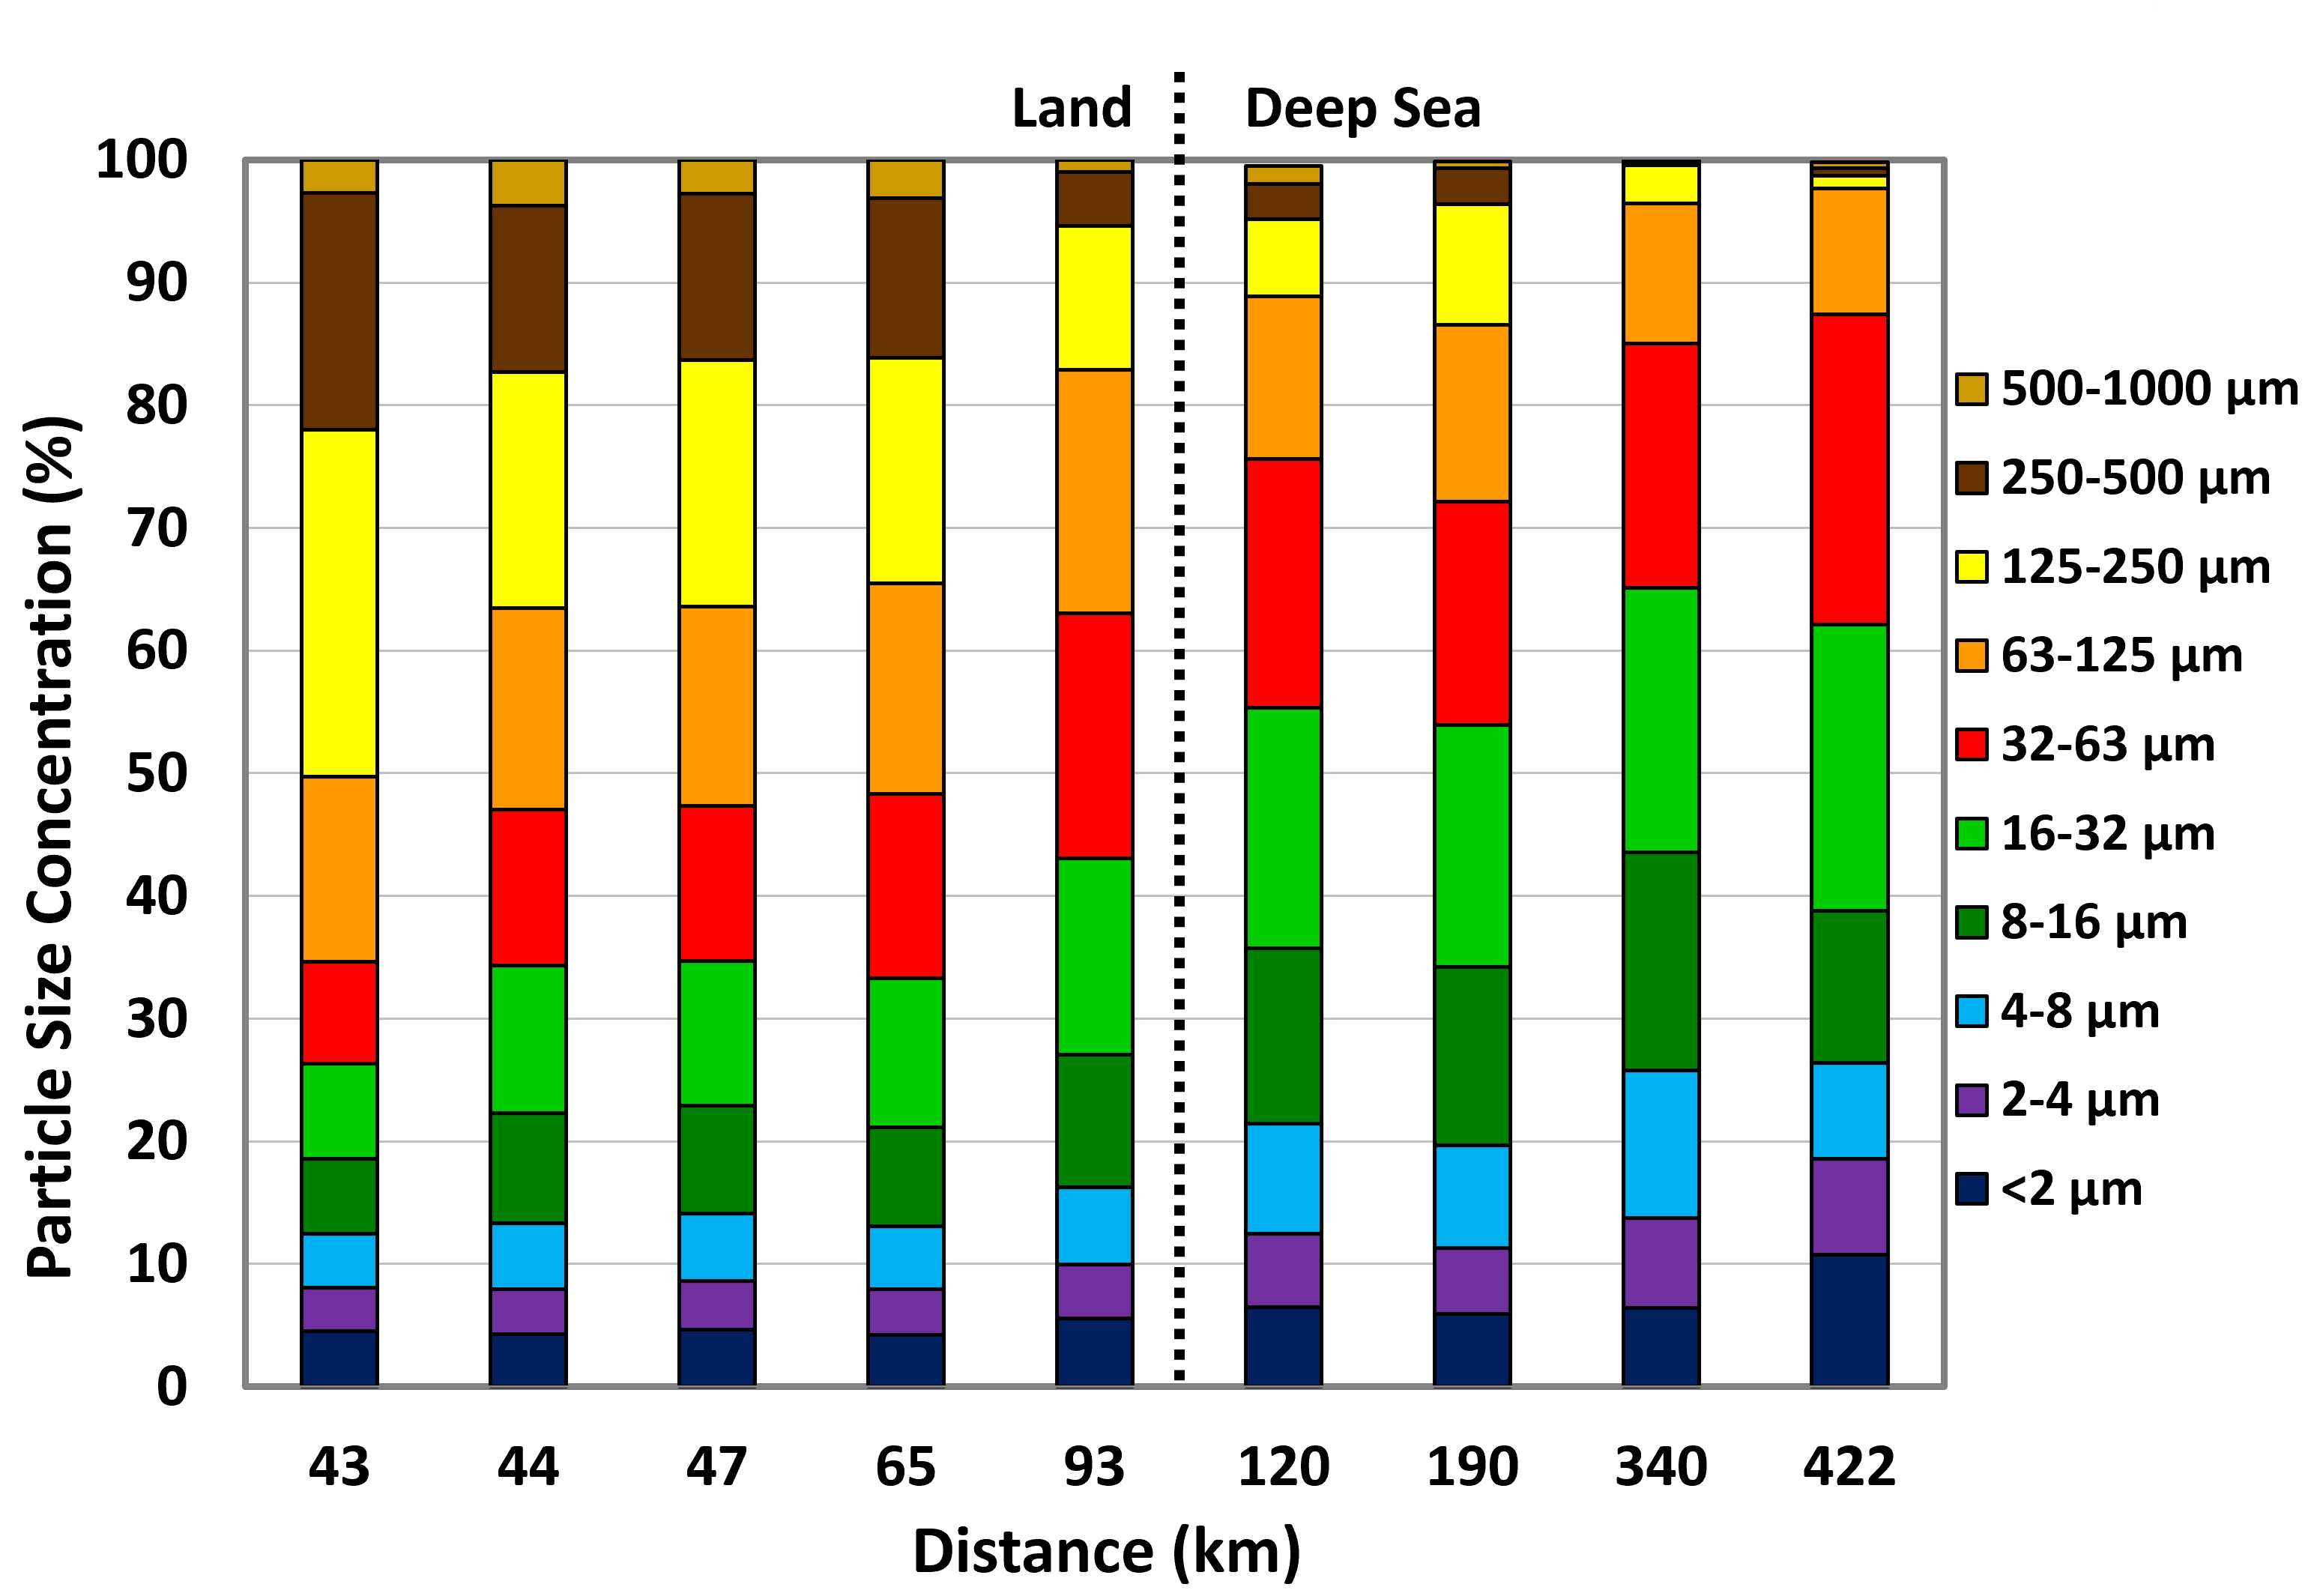
Figure 3 – Particle size concentration, as cumulative volumes percentage, with distance. The coarse-size fractions decrease, and the fine fraction increase with distance. The change from land to deep-sea samples lies between 93 and 120 km (modified from Kandlbauer et al., 2013b).
Yes, a lot of material has been falling into the ocean. We were lucky to recover fine ash from deep sea cores that have been brought up from the ocean floor by the Snellius 2 expedition in 1984. We compared the grain size distribution from very fine ash (0.02 µm – 2 mm) from land and ocean deposits and found that the deep sea core deposits do contain even the finest grain sizes that are smaller than 10 µm (you cannot even see this size by eye). We then used an ash dispersal model to see if the deep sea samples fitted the expected ash distribution with distance that we know from the land samples, and it worked beautifully! This means that the size distribution of the ash has not been modified by passing through the water column (some cores have been recovered from 3 km depth!) and have been likely transported down to the sea floor by fast vertical density currents to preserve all the details we have observed. If you imagine ash just settling though the water column without these currents, it would take several months for very fine ash to reach the ocean floor. I would argue that it is simply not reasonable to believe that this mechanism would provide such a good match between the measurements performed on land and in the deep sea cores.
I guess a difficulty of using deep sea cores is that we did not find ash layers in all cores around Tambora. Maybe there are places where you do not have the right setting to produce a vertical density current so the ash would simply disaggregate and float away on the ocean surface. However, this issue is also known from sampling ash on land terrain, depending on the relief and vegetation you might not find deposits. It is just easier to move 10m by foot than drilling another core 10m from the previous one.
Ultimately, the deep sea core samples were helping to improve significantly the volume estimate – the more high quality data the better the estimate, right?
What impact did the Tambora eruption have on surrounding and distant areas? And by what mechanisms can eruptions of this magnitude impact climate, agriculture and global society?
The column of ash and gases that has risen from the volcano had a devastating effect. Falls of grey volcanic ash covered an area four times the size of UK and even people living at 300 km distance from the volcano died below collapsing buildings covered by ash. The ash also destroyed most of the crop harvest and contaminated drinking water, leaving people in desperate conditions with famine and epidemics threatening their life. Even four years later, in 1819, there were no signs of life in the district immediately surrounding the volcano. On the whole Island it was still difficult to grow rice 5 years after the eruption, which resulted in mass migration toward less affected regions. Some even sold themselves as slaves to survive.
The Tambora eruption claimed at least 11,000 deaths by direct volcanic effects (ash fall and pyroclastic flows), and about 49,000 victims are estimated to have died due to famine and epidemic diseases in the aftermath.
And how has the eruption affected the World? Huge amounts of volcanic sulphur gases were converted into tiny droplets of sulphuric acid in the stratosphere and distributed around the world. The sulphuric acid reflected part of the solar radiation and consequently changed the global weather pattern, which brought North America and Europe to face an extreme summer with temperatures well below average, crop failures and food shortages in 1816. The Temperature dropped worldwide by 1±0.1ºC and global precipitation decreased by 4% in 1816. In New England summer frosts and snow in June led to mass migrations to the mid-West, in Switzerland only moss, sorrel and cat flesh was left to eat, and in Ireland a typhus epidemic killed thousands of people the following years. 1816 became known as the ‘year without summer’.
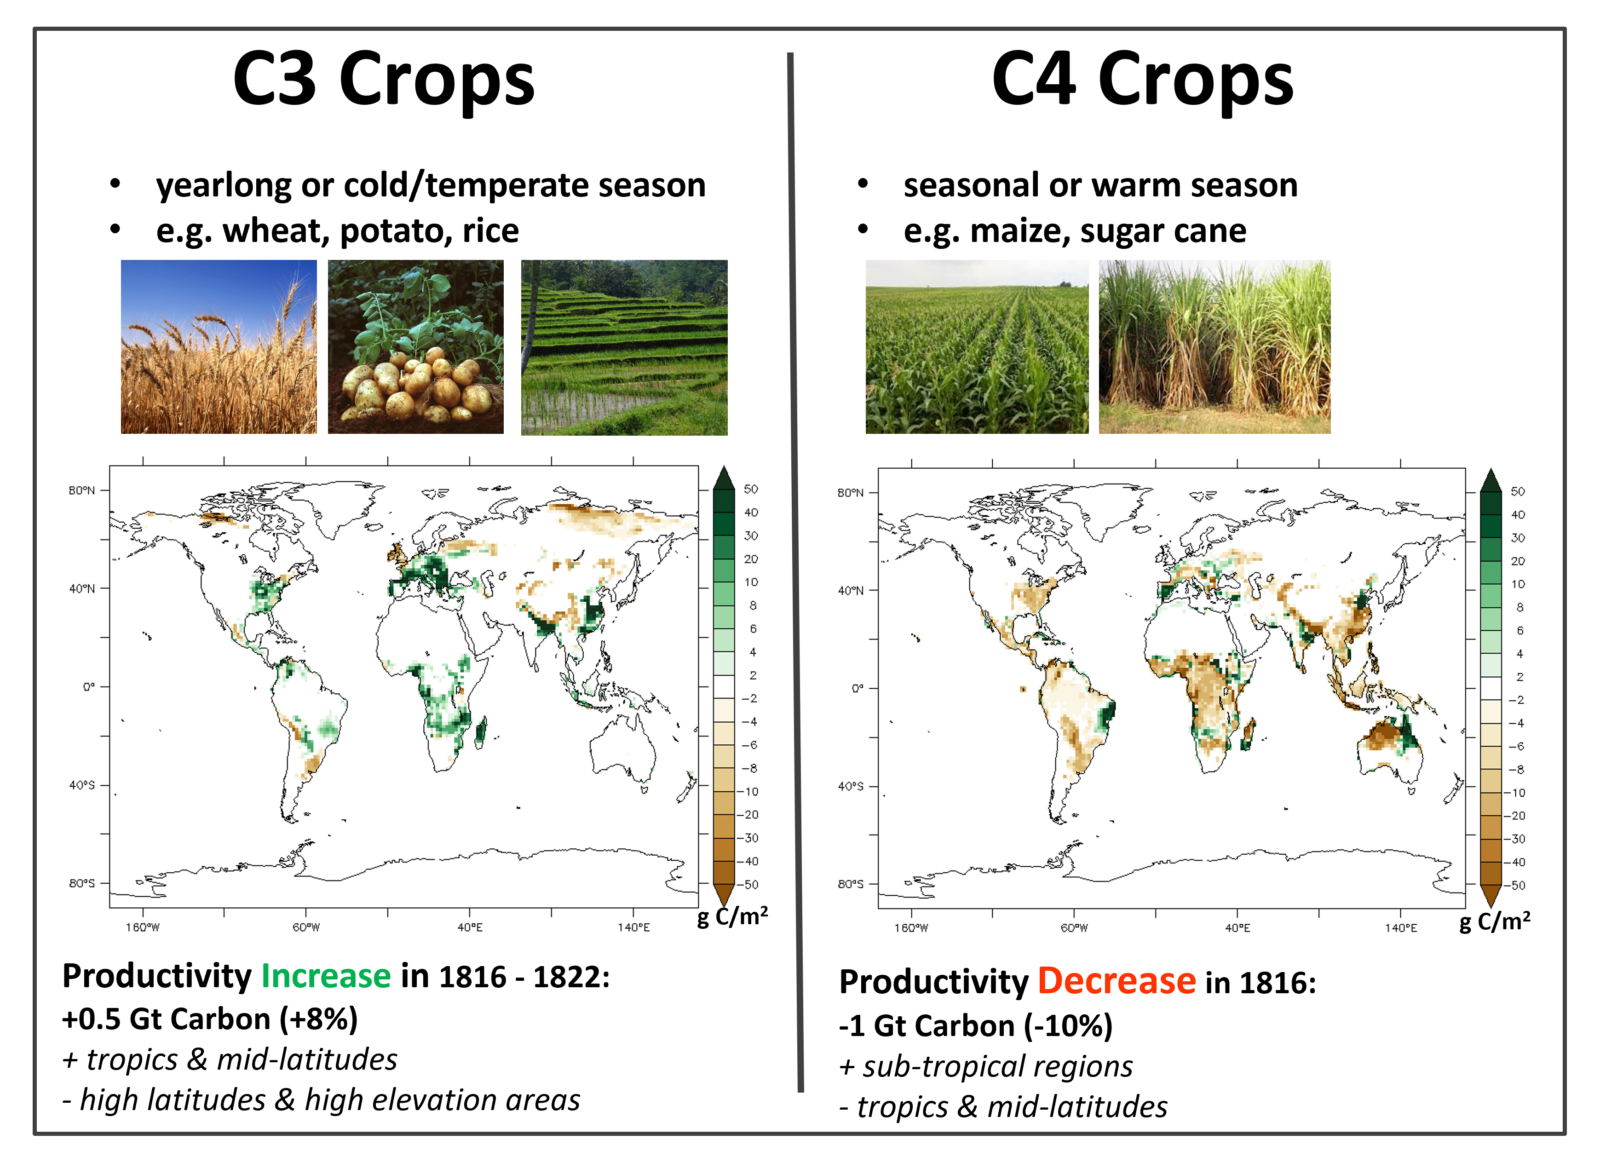
Figure 4 – Regional anomalies of the net primary productivity (NPP) of two different types of Crops: C3 (e.g. wheat and potatoes) and C4 (e.g. maize and sugar cane). modified from Kandlbauer et al., 2013a.
We ran a climate model to understand better the regional effects of such an eruption. We did not intend to reconstruct exactly the 1816 situation but rather run a series of models to find the most likely scenario we could face. The HadGEM2-ES climate model has a vegetation module built-in and thus we could compare different types of vegetation and their response to a volcanic eruption. We found that not all vegetation types and crops react just negatively to an eruption and in some regions some vegetation has been actually flourishing the year after the eruption. For example, staple food such as wheat and potatoes show an increased productivity by more than 8%, while maize and sugar cane decreased their productivity by over 12% globally. Of course, extreme and rather short-term weather events like the summer frosts we know happened in 1816, are not well captured in climate models and thus could lead to different outcomes.
One very last question, in case an eruption of a similar scale to the one produced by Tambora in 1815 were to occur now, or in the near future, what effect would it have on modern climate and society and what could be done globally to mitigate its effects?
The vulnerability of the modern society to extreme events has been repeatedly illustrated in recent years by the Asian tsunami 2004, Hurricane Katrina 2005, Earthquake in Haiti 2010 and the Earthquake and tsunami in Japan 2011. These sudden unexpected events are often called ‘black swans’, and expose the society to appalling casualties, destruction of infrastructure like airports, streets, electric systems and power supply, and catastrophic financial losses.
Indonesia’s population is now more than 13 times larger than in 1815 and the country is highly dependent on its agricultural production, which greatly increases the vulnerability of the society. For instance, Indonesia is basically self-sufficient in producing its primary staple food rice. Another Tambora-sized eruption would likely damage the rice harvest and cause a major food crisis. In addition, the decreasing temperatures would reduce even the worldwide agricultural production, resulting in a global food shortage that would deteriorate the already critical situation of food supplies.
A volcanic eruption of this size in Indonesia would also stress the global networking economy. Indonesia is one of the world leading countries in terms of palm oil, rubber, rice, sugar and coffee production and an eventual large eruption would have significant impact on the global trade activity. In 2010 we experienced first-hand the consequences of a volcanic eruption to aviation business, when Eyjafjallajökull erupted in Iceland and caused major disruption to aviation in Europe and a loss of 1.7 billion dollars. A Tambora-size eruption would release about 700 times the amount of ash produced by Eyjafjallajökull and could likely convert large parts of Southeast Asia into a no-fly zone. Apart from the economic losses, a no-fly zone would further complicate the transport of disaster relief goods to the affected areas.
The Japan Earthquake and tsunami disaster in 2011 may provide some information on what problems the refugees could face, including housing in shelters for several months, reduced food and water supplies, marginal sanitary facilities and first aid, all of which could help the spread of diseases. Living in refugee shelters for such a long time may leave people in great uncertainties and fears about possible financial difficulties, resettlement and job-seeking in the future, which can affect adversely the already difficult life in the shelters.
Humankind cannot stop such large-scale natural disasters and the vulnerability of our society rises as the population grows. Therefore, it is essential to understand natural ‘black swans’ and develop plans for disaster preparation, emergency response and recovery to the affected population; yet a large eruption would affect the whole world and collaboration at global scale is necessary to face the consequences.
References
- Brönnimann, S., & Krämer, D. (2016). Tambora and the” Year Without a Summer” of 1816. A perspective on earth and human systems science (Vol. 90). Geographica Bernensia.
- Hong, J., Kil, H., Lee, W. K., Kwak, Y. S., Choi, B. K., & Paxton, L. J. (2022). Detection of Different Properties of Ionospheric Perturbations in the Vicinity of the Korean Peninsula After the Hunga‐Tonga Volcanic Eruption on 15 January 2022. Geophysical Research Letters, 49(14), e2022GL099163.
- Hubbard AH (1815) Java Government Gazette No.169, May 20, 1815. Hubbard AH, Batavia
- Kandlbauer, J., Hopcroft, P. O., Valdes, P. J., & Sparks, R. S. J. (2013a). Climate and carbon cycle response to the 1815 Tambora volcanic eruption. Journal of Geophysical Research: Atmospheres, 118(22), 12-497.
- Kandlbauer, J., Carey, S. N., & Sparks, R. S. J. (2013b). The 1815 Tambora ash fall: implications for transport and deposition of distal ash on land and in the deep sea. Bulletin of volcanology, 75(4), 1-11.
- Kandlbauer, J., & Sparks, R. S. J. (2014). New estimates of the 1815 Tambora eruption volume. Journal of Volcanology and Geothermal Research, 286, 93-100.
- Luterbacher, J., & Pfister, C. (2015). The year without a summer. Nature Geoscience, 8(4), 246-248.
- Oppenheimer, C. (2003). Climatic, environmental and human consequences of the largest known historic eruption: Tambora volcano (Indonesia) 1815. Progress in physical geography, 27(2), 230-259.
- Raffles, L. S. (1835). Memoir of the life and public services of Sir Thomas Stamford Raffles. J. Duncan.
- Ross, J. T. (1816). Narrative of the effects of the eruption from the Tambora Mountain on the island of Sumbawa on the 11th and 12th of April 1815, communicated by the president of the Batavia Society. Verh. Bataviaasch Genoot. Kunst Wet, 8, 343-360.
- Self, S., Gertisser, R., Thordarson, T., Rampino, M. R., & Wolff, J. A. (2004). Magma volume, volatile emissions, and stratospheric aerosols from the 1815 eruption of Tambora. Geophysical Research Letters, 31(20).
- Sigurdsson, H., & Carey, S. (1989). Plinian and co-ignimbrite tephra fall from the. Bulletin of Volcanology, 51(4), 243-270.
- Stothers, R. B. (1984), The great Tambora eruption in 1815 and its aftermath, Science, 224, 1191–1198.
- Zimmer, G., 1874. Brief van Georg Zimmer aan den redacteur. De Rijnsche Zending, pp.140–151.