Welcome to the first of its kind, the Geotandem 01! A collaborative series between EGU divisions. Interdisciplinarity is intrinsic to Geosciences, so we want to showcase how researchers approach the same topics from different but also complementing perspectives. In each edition, we will bring you a high-interest topic for the community seen from the eyes of diverse disciplines. Today, the Tectonics & Structural, Geodesy and Geodynamics divisions come together to present one of our favorite planets of the solar system, Mars. How does a collaborative blog work? As simple as it sounds, after reading the first blog, you can access the blogs of the other two divisions by following these links:
(TS) Tectonics & Structural of MARS by Hannah Davies
(GD) Geodynamics of MARS by Scott King & Joshua Murphy
Other topics that you’d like to see featured in the series? Let us know in the comments!
A geodetic perspective of Mars is brought to you by Bart Root from Delft University of Technology
Variations in the gravity field of the Earth are frequently used to get more information about the deeper structure. But, it is not only the Earth that has a gravity field. Our neighboring planet Mars has a unique gravity field as well. Satellite missions like MRO (Mars Reconnaissance Orbiter), MGS (Mars Global Surveyor), and Odyssey measured the variations in the gravitational strength with a resolution up to around degree and order 100 in spherical harmonic coefficients (which is about 200 km) and an accuracy of a few mGal. This was later improved by various modelling efforts and resulted in, for example, the GMM-3 model by Genova et al. (2016), which is used for the figures in this post.
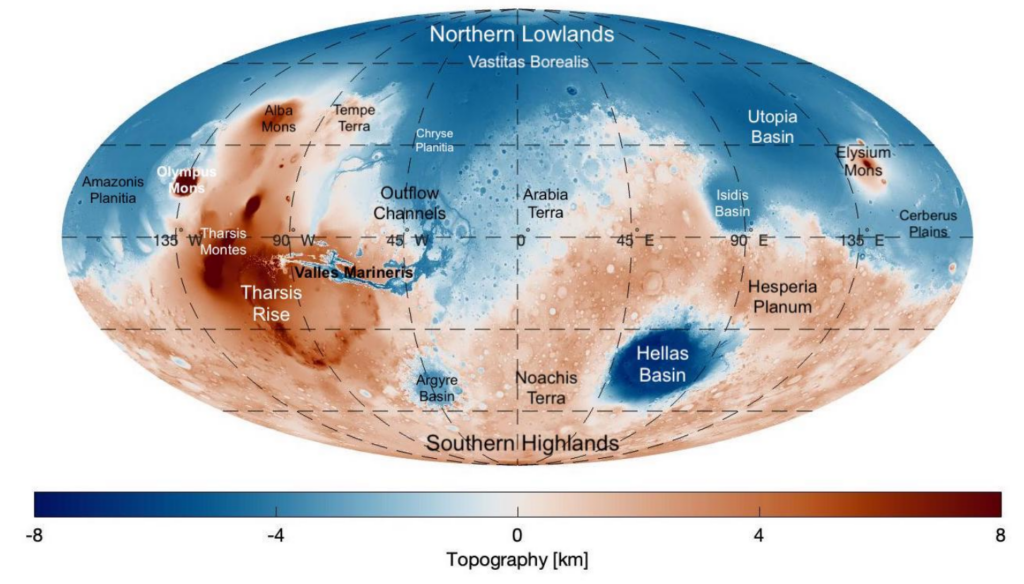
Figure 1: Topographic map of Mars with major features named, e.g. Tharsis rise in the left. Figure courtesy of MSc. Bodjie van Brummen
The uniqueness of the Martian gravity field can best be observed when we compare the gravity field spectra from all solar system bodies that are similar. Mars has the largest magnitude in the long wavelength of the gravity field. This signal can be easily seen in a map view (Fig. 2), with a positive gravity anomaly centred at a volcanic region named the Tharsis Rise with a negative gravity ring around the volcanic complex. To understand how to interpret this anomalous signal, we need to go back in time, to when gravity measurements were conducted in submarines.
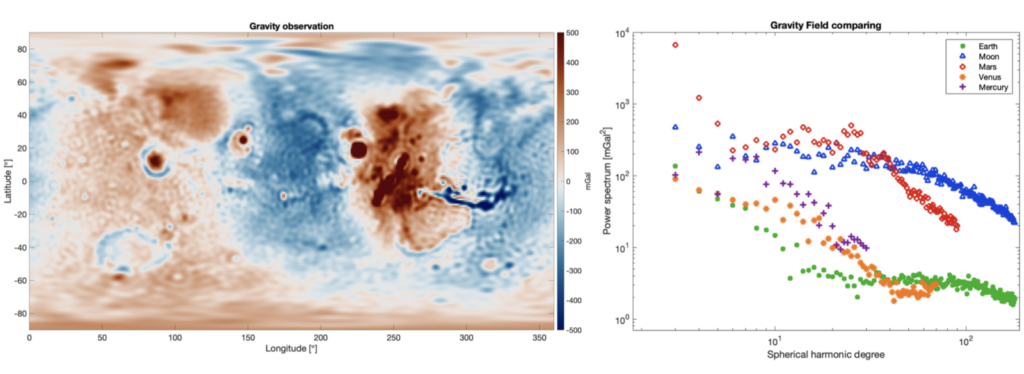
Figure 2: (left) gravity anomaly of Mars taken from the GMM-3 model by Genova et al. 2016. Notice the saturation of the positive colour scale (max value is more than 3000 mGal). (right) Power spectra of all gravity field observations of rocky planets (yes the Moon is a rocky planet, do not let astrodynamic experts decide the naming convention). Mars stands out in the long-wavelength regime of the spectrum (figure courtesy of Nynke Boersma, MSc.).
In 1926, aboard the K-XIII submarine, Professor Vening Meinesz made a groundbreaking journey from the Netherlands to the East Indies, sailing west through the Panama Canal. During the expedition the ship passed by the islands of Hawaii, and unexpected gravity anomalies were observed, setting the stage for a new theory in geophysics. Applying traditional isostatic models like Airy-Heiskanen failed to explain Hawaii’s volcanic gravity signal. Vening Meinesz, drawing on his civil engineering background, introduced a flexure model, treating the crust as a loaded plate. This novel approach successfully explained the negative gravity ring around the volcanic islands.
The idea of Vening Meinesz would eventually grow to the well-known flexure modelling, a technique that is used on Earth and other rocky planets to understand the subsurface characteristics of a planet. It seems that this flexure theory would be perfect to explain similar observations of the Martian gravity field (Fig. 2). The observations are similar to Hawaii: a positive gravity anomaly centred above a volcanic region with a negative gravity anomaly around the area. Moreover, the antipodal positive gravity anomaly can also be seen in the Hawaiian islands where a (slightly less strong) positive gravity anomaly surrounds the negative band.
The major difference between the Hawaiian and Martian cases is the size of the problem. Where the Hawaiian island is about 150 km in diameter, the Tharsis Rise covers almost one-third of the planet (Fig. 1). This raises the question if the infinite plate assumption is still valid. The curvature of Mars definitely plays a role in the flexure of the volcanic loading. An analogy often used in instructions involves envisioning a flat piece of paper held between hands like a bridge. Consider the scenario where an external load, represented by a pencil, is applied to the flat paper – it bends. Demonstrating further, curving the paper illustrates that it becomes stiffer when subjected to a load on top of the curve. The same happens on Mars, the curvature is responsible for the extra stiffness of the lithosphere and can hold up larger loads, negating the need for large buoyancy forces to compensate for the load. This will have a strong effect on the gravity field and might explain the large peak we see in the long wavelengths of the Martian gravity field observations.
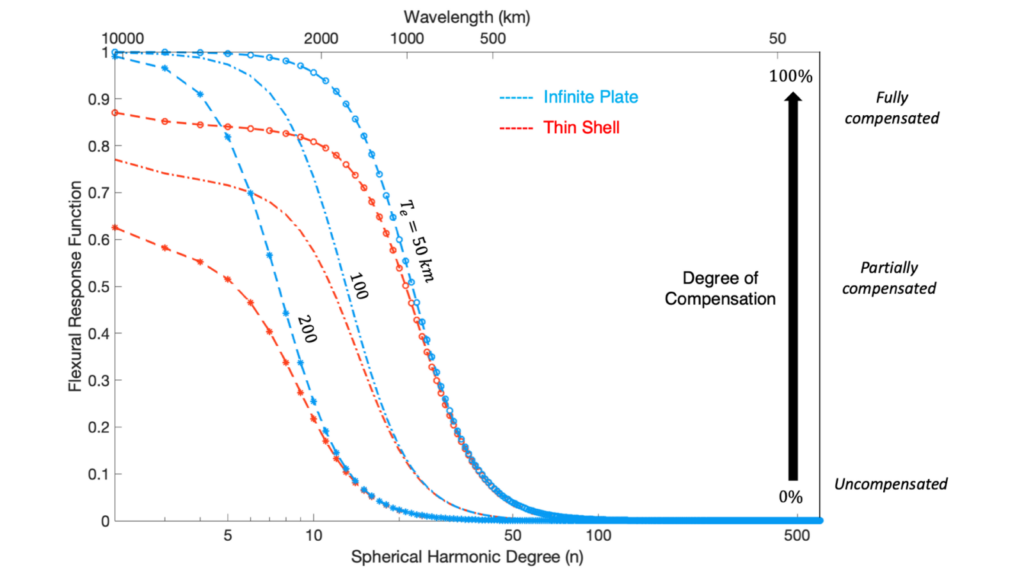
Figure 3: The flexural response function for the infinite plate (red) model and the thin shell (blue) model for different rigidities (figure courtesy of Weilun Qin, MSc.).
Figure 3 shows the flexural response function for both the infinite plate (blue) and the thin shell (red) models. The response is between 1 (fully local isostasy) and 0 (no compensation, also named Bouguer response). The difference between the two models is limited in high-degree (small loads), but is significant for low degrees (large loads). An infinite plate is not able to produce any flexure for such loads as its response is almost perfectly 1 for low degrees (degrees 1-5), independent of any realistic rigidity assumptions. To explain the observed gravity field of the Tharsis Region the thin shell method needs to be implemented.
We developed a subsurface model with four variables: crustal density, sub-crustal density (mantle density), crustal thickness, and rigidity of the lithosphere (usually we show the value of the effective elastic thickness). With these four knobs, we try to explain the topography and gravity based on the subsurface model. This can be done by looking at the admittance, which is the spectral ratio between the topography and gravity fields. The goal is to use the topography field as an input and try to fit the gravity field, or vice versa. I prefer the former.
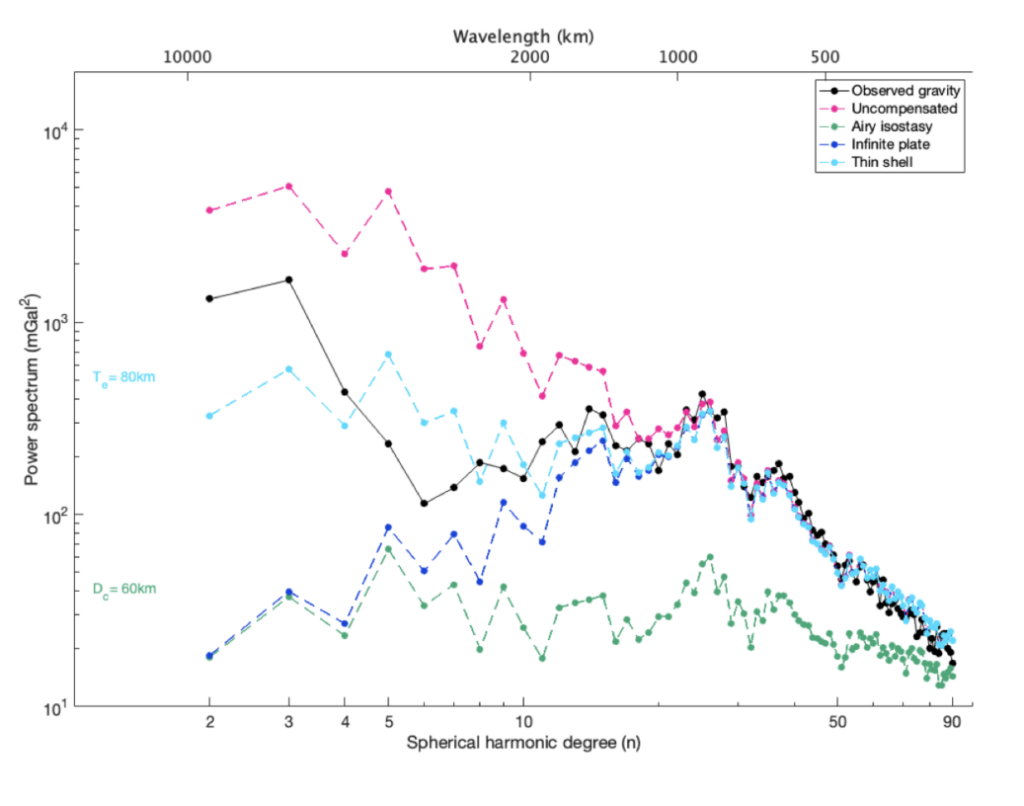
Figure 4: The power spectrum of the observed gravity field of Mars (GMM-3), compared with different flexure models.
We plot the gravity field degree variance of the observed gravity field (as shown by the black line in Fig. 4; being almost similar to Fig. 2 with C20 being removed from this spectrum) and the gravity field based on the different subsurface models. We compare our modelled gravity response to the observed field and find that the best-fitting uncompensated model (pink line) mostly overestimates the observed gravity field between degree 2 and degree 30, whereas the local (Airy) isostatic model (green line) mostly underestimates the gravity field. These two models can be seen as end members of our flexure modelling. Other models show a better fit, e.g., best-fitting infinite plate and thin shell models. They fit the spectrum from high degrees down to degree and order 10, and then the models deviate from each other. The spectral magnitude for the long wavelength signals (low degree) is stronger for the thin shell model. Thus, this model describes the strong gravity field over the Tharsis Rise better than the other models. Nevertheless, it cannot completely explain the signature. You can play a bit with the four different knobs, but it will not be able to explain the exact shape of the gravitational signal. If you would fit degree 2-3 it will overfit degrees 4-10, and when 4-10 are fitted, degree 2-3 are underestimated. Thus, with lithospheric flexure alone you are not able to explain the gravity field of Mars. Something is missing!
It seems that we need to send more gravity expeditions to Mars to explain this phenomenon. Now almost 100 years after Prof. Vening Meinesz it is our generation that needs to keep exploring the unknown and set sail to undiscovered planets.
References:

Boersma, N. (2021) Gravity effect of different lithosphere models on gravity power spectra for the Earth, Mars, Mercury, Venus and the Moon.

van Brummen, B. (2022). Mars Gravity Inversion: Investigating the lateral density variations of the Martian lithosphere.

Genova, A., Goossens, S., Lemoine, F. G., Mazarico, E., Neumann, G. A., Smith, D. E., & Zuber, M. T. (2016). Seasonal and static gravity field of Mars from MGS, Mars Odyssey and MRO radio science. Icarus, 272, 228-245.

Qin, W. (2021). Mars Surface Stress Modelling: Investigation on the crustal structure of Mars with Finite Element Method.