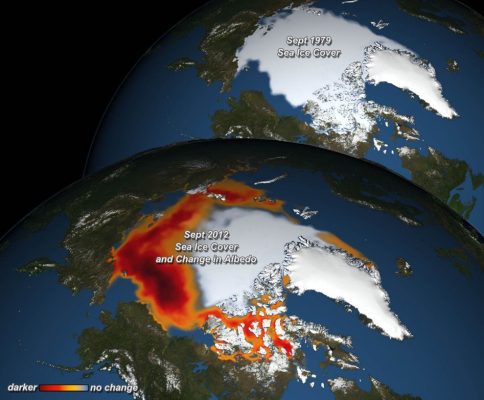
One of the most dramatic signals of Earth’s recent warming has been the precipitous decline of the Arctic sea ice. While the sea-ice decline is in response to warming ocean and atmosphere, it also has an important feed-back on the climate itself. Solar radiation and albedo Earth’s main energy source is solar radiation. This solar radiation is either absorbed in the atmosphere or at the ...[Read More]
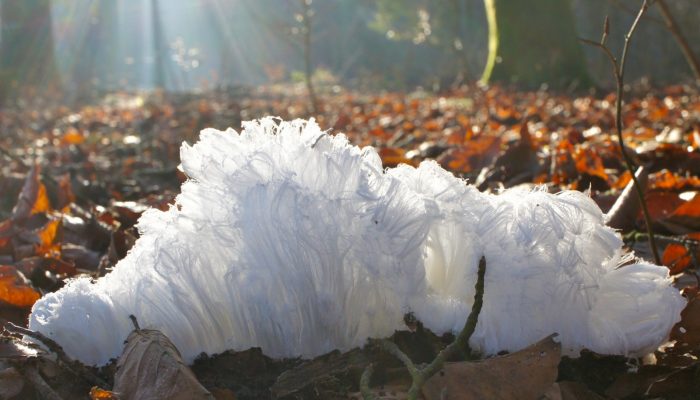
Image of the Week – Mushrooms at zero degrees = hair ice?!
When you go down to the woods today you’re in for a big surprise….. hair ice! Did you know that there is a type of ice called hair ice? It is shaped like fine, silky hairs and looks like white candy floss. It grows on the rotten branches of broad-leaf trees during humid winter nights when the air temperature drops slightly below 0°C. A 100-year-old theory states that hair ice a ...[Read More]
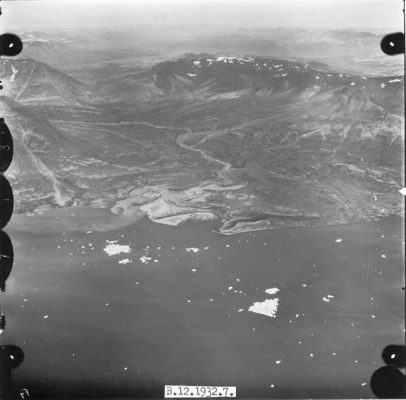
Image of the Week — Historical aerial imagery of Greenland
A few month ago, we were taking you on a trip back to Antarctic fieldwork 50 years ago, today we go back to Greenland during 1930s! When geopolitics serves cryospheric sciences The Permanent Court of International Justice in The Hague awarded Danish sovereignty over Greenland in 1933 and besides geopolitical interests, Denmark had a keen interest in searching for natural resources and new opportun ...[Read More]
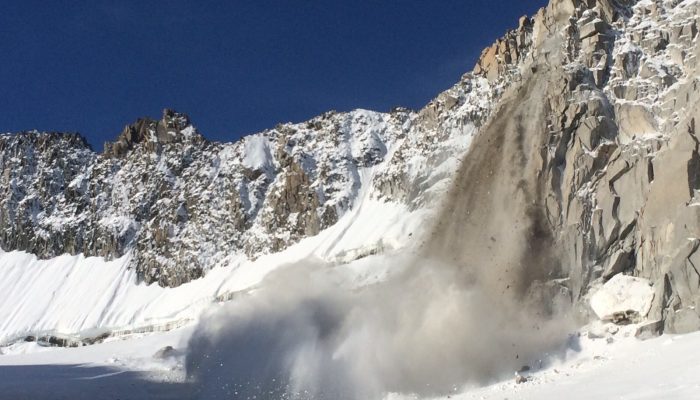
Image of The Week – Tumbling Rocks
This photo captures a rockfall at the summit of Tour de Ronde, 3792 m above sea level in the Mont Blanc Massif. On 27 August 2015, around 15000 m3 of rock fell from the steep walls of the mountain. Why do mountains crumble ? Rockfalls such as the one on the photo have been linked to thawing permafrost. The exact mechanism that leads to these events is not fully understood, however, it is thought ...[Read More]
Image of the Week – See How Seasonal Sea Ice Decline Differs!
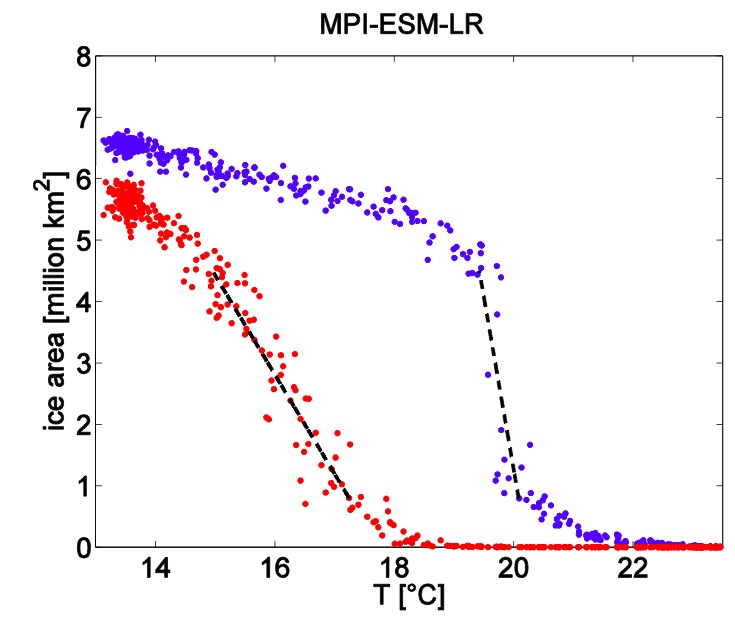
Why do we care about sea ice in the first place? Sea ice is important for several components of the climate system. Due to its high albedo, sea ice reflects a high amount of the incoming solar radiation and is therefore relevant for the Earth’s energy budget. Sea ice inhibits the exchange of heat, moisture and momentum between ocean and atmosphere, which usually occur at the sea surface. Whe ...[Read More]
Image of the Week — Glowing Ice
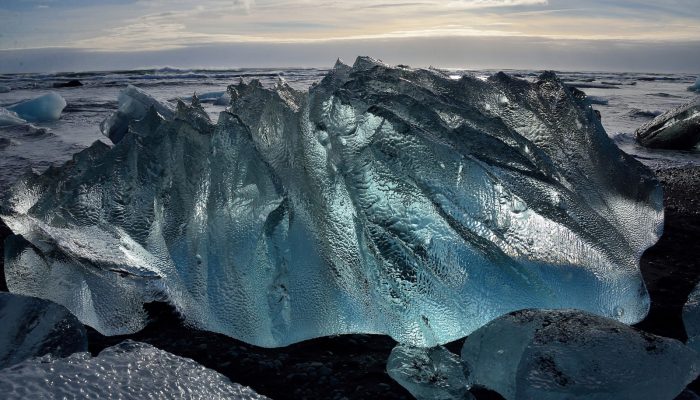
Two weeks ago, the EGU General Assembly was coming to an end in Vienna. With over 16,500 participants, this year’s edition was bigger and more varied than ever (e.g check out this good overview of the science-policy short course, published 2 days ago on geolog). The week was particularly fruitful for the cryospheric sciences and to mark this we have cherry-picked one of the winning picture o ...[Read More]
Image of the Week – Storing water in Antarctica to delay sea-level rise
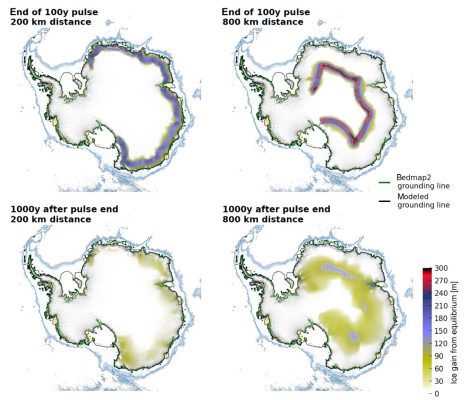
Sea level rise Sea-level rise is one of the main impacts of the current global warming and its rate has dramatically increased in the last decades (the current rate is about 3 mm per year). Even if greenhouse gas emissions were stopped today, sea level would continue to rise due to the slow Earth climate system response (IPCC, 2013, chap. 13). It is therefore a considerable threat for popul ...[Read More]
Image of The Week – EGU General Assembly 2016
The EGU General Assembly, which takes place each year in Vienna, Austria, draws to a close today. Attended by nearly 13,650 participants from 111 countries, with around a third of those being students – a great turn-out for this vital part of the early career scientists (ECS) community! It has been a very productive meeting for the cryosphere division with a huge number and variety of oral ...[Read More]
Image of The Week – The Ice Your Eyes Can’t See!
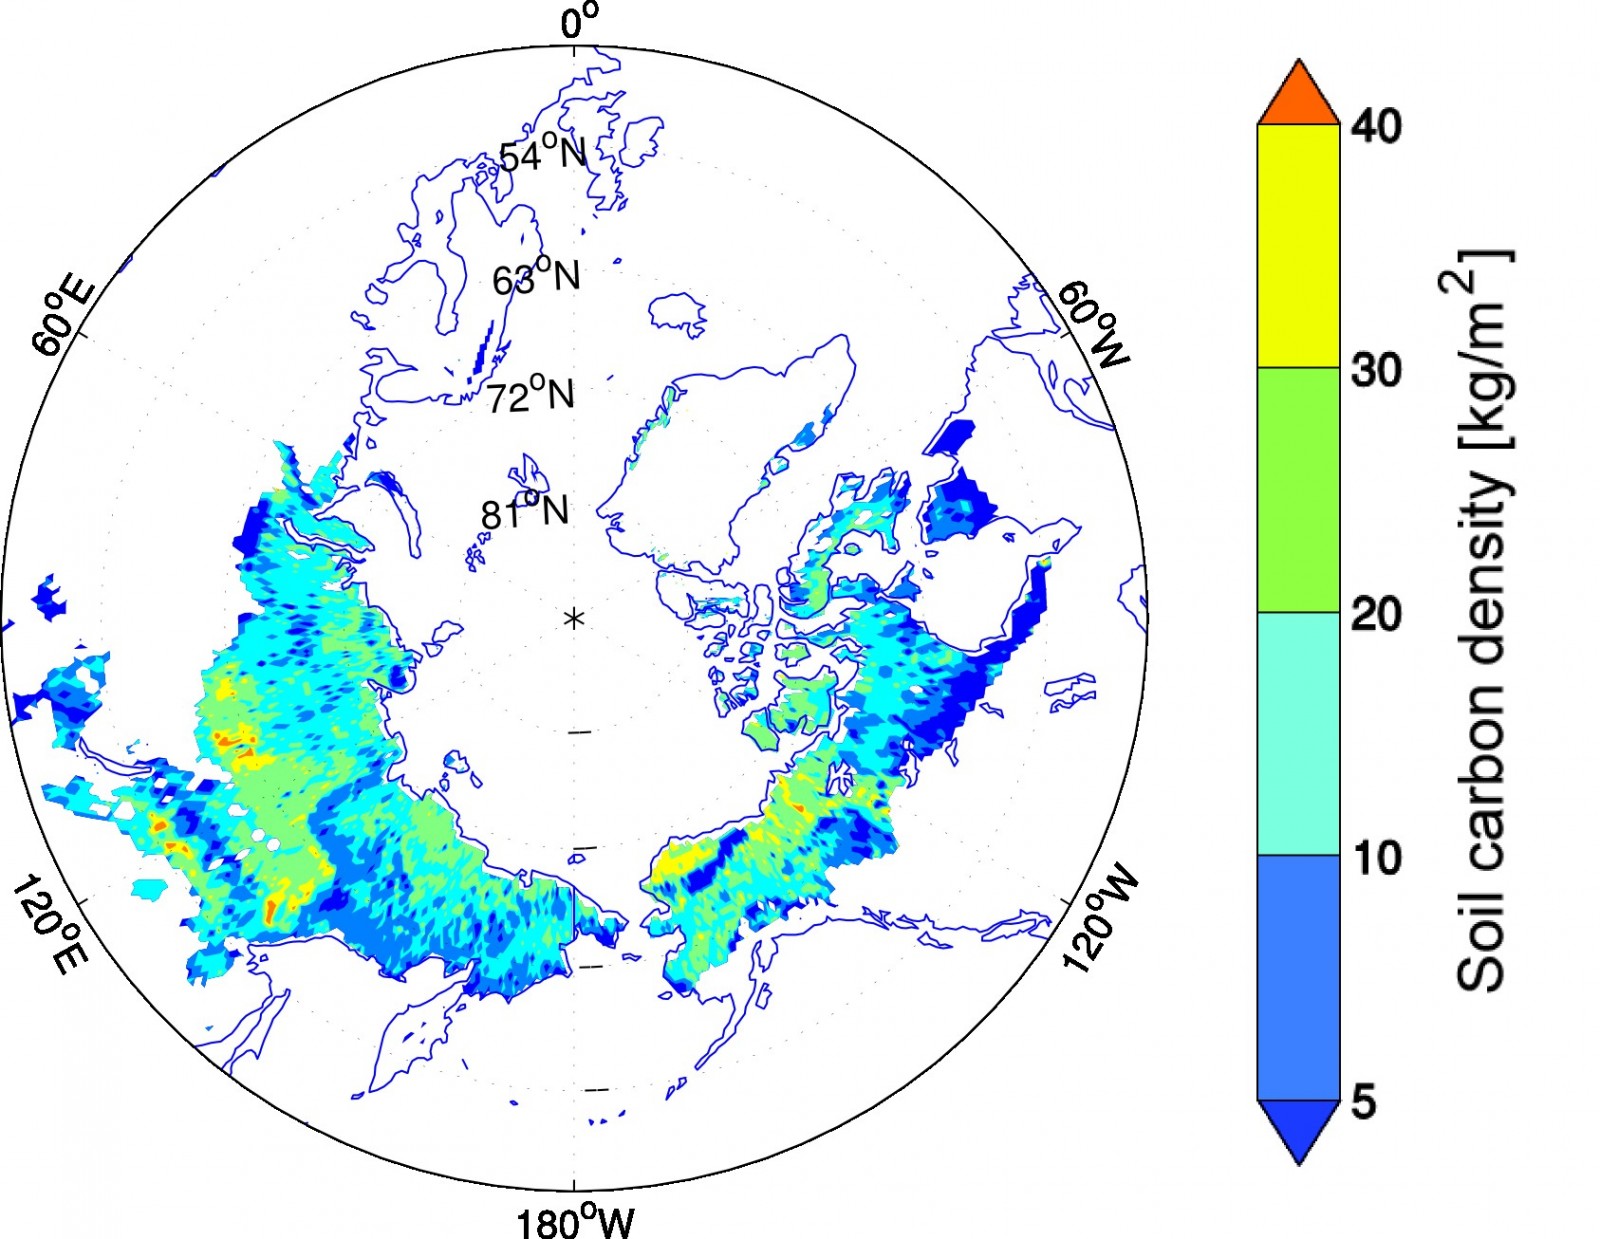
Ice sheets and glaciers are very visible and much photographed (e.g. here) elements of the Cryosphere but what about the vast, invisible and buried parts? Around a quarter of the land in the Northern hemisphere remains frozen year round, making up a hugely important part of the cryosphere known as permafrost. Permafrost largely exists at high latitudes (e.g. Siberia and the Canadian Arctic) and t ...[Read More]
Image of the Week: The Bipolar Seesaw
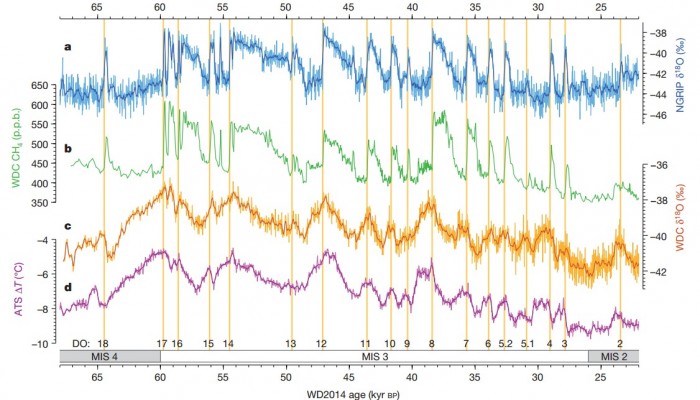
The colourful graphs above show how the climate changed in the period from 65 to 25 thousand years ago when Earth was experiencing an ice age. A wealth of information on the dynamics of our climate is embedded in the curves, especially how the northern and southern hemisphere interact, and how fast climate can change. The figure represents thousands and thousands of hours of work by scientists, te ...[Read More]