This illustration shows two Synthetic Aperture Radar (SAR) images taken over sea ice in the Arctic Ocean. Both images are polarimetric and the different colours reflect the different polarimetric channels of the SAR (red = VV, green = HV and blue = HH). The two images are from the two satellites “ALOS-2” and “RADARSAT-2”. These are equipped with radars that operate at wavel ...[Read More]
Image of the Week — What’s up with the sea-ice leads?
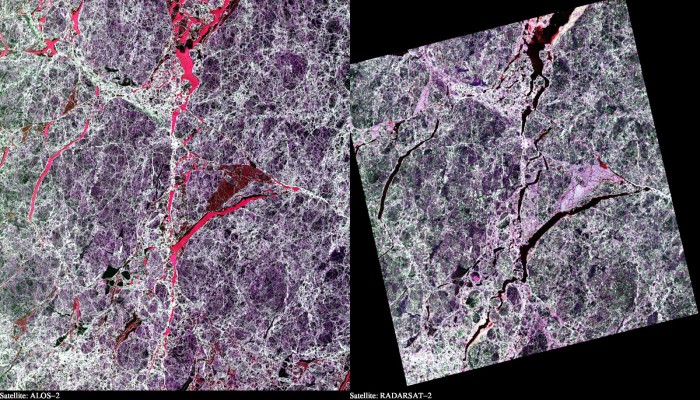
Two polarimetric SAR images Artctic Sea Ice. The colours reflect the different polarimetric channels of the SAR (red = VV, green = HV and blue = HH). Credit: Jakob Grahn.