Ice cores are important tools for investigating past climate as they are effectively a continuous record of snowfall, which preserves historical information about climate conditions and atmospheric gas composition. In this new “For Dummies” post, we discuss the history and importance of ice-core science, and look at the way we can use ice core chemistry to reconstruct past climate. Ice sheets, arc ...[Read More]
Image of the Week – Blood Falls!
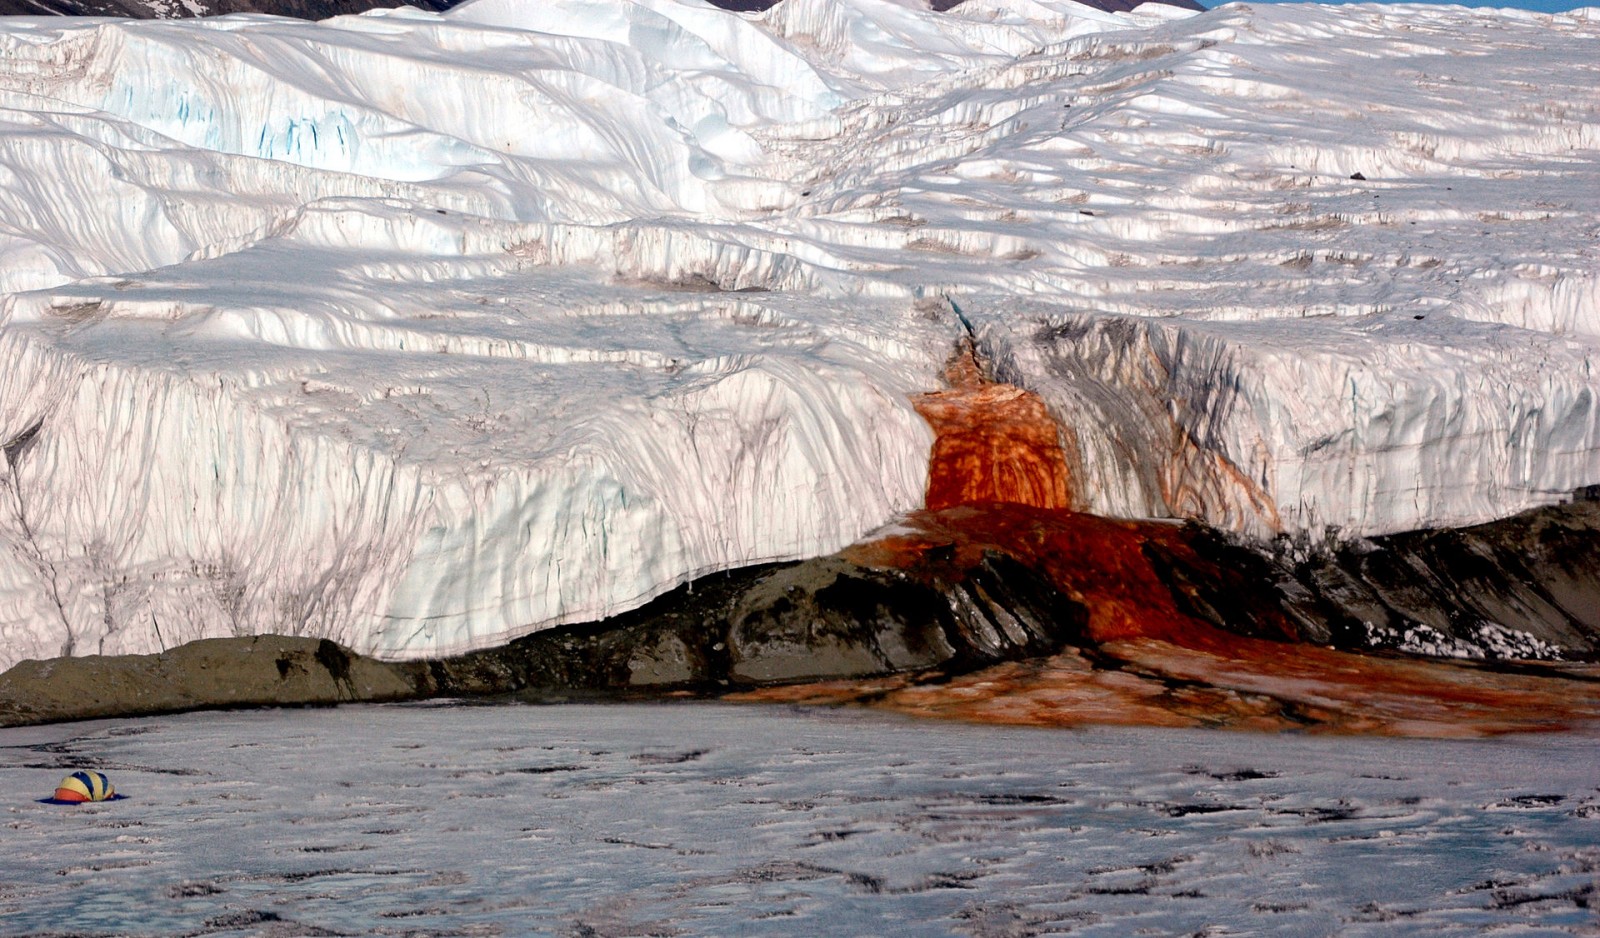
If glaciers could speak, you might imagine them saying – “HELP!” The planet continues to warm and this means glaciers continue to shrink. Our new image of the week shows a glacier that appears to be making this point in a rather dramatic and gruesome way – it appears to be bleeding! If you went to the snout of Taylor Glacier in Antarctica’s Dry Valley region (see map ...[Read More]
Ice-Hot News : The “Oldest Ice” quest has begun

This is it! The new European horizon 2020 project on Oldest Ice has been launched and the teams are already heading out to the field, but what does “Old Ice” really mean? Where can we find it and why should we even care? This is what we (Marie, Olivier and Brice) will try to explain somewhat. Why do we care about old ice, ice cores and past climate? Unravelling past climate and how it responded to ...[Read More]
Image of The Week – 100 years of Endurance!
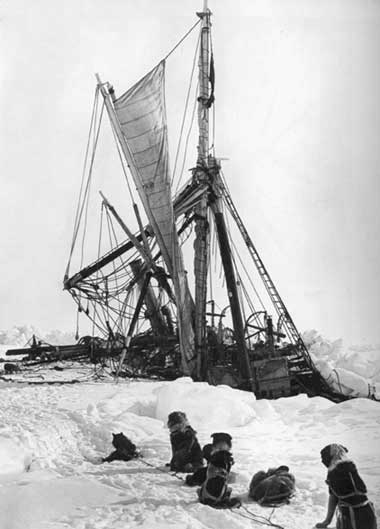
The 30th August 2016 marks 100 years since the successful rescue of all (human) member of Shackleton’s Endurance crew from their temporary camp on Elephant Island (see map). Nearly a year prior to their rescue they were forced to abandon their ship – The Endurance – after it became stuck in thick drifting sea ice, known as pack ice, trying to navigate the Weddell Sea. It was the last major e ...[Read More]
Image of the Week — Where do people stay in the “coolest” place on earth?
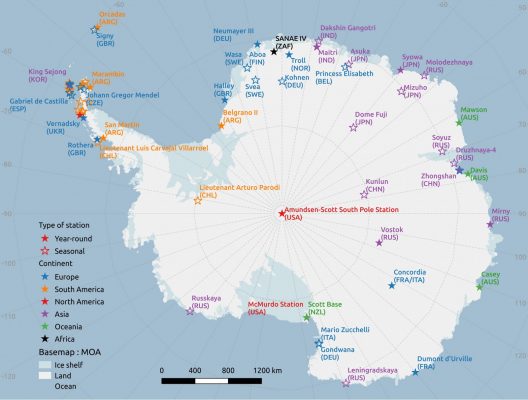
What word would you use to characterise the Antarctic ? White? Windy? Remote? Empty? Inhospitable? Wild? Preserved? While all of these are true it may surprise you to find out that the Antarctic is occupied by humans all year round with almost half of its 82 research stations operating 365.25 days a year! Just a few hours before the launch of the biennial Antarctic meeting held by the Science Comm ...[Read More]
Image of the week – The winds of summer (and surface fluxes of winter)
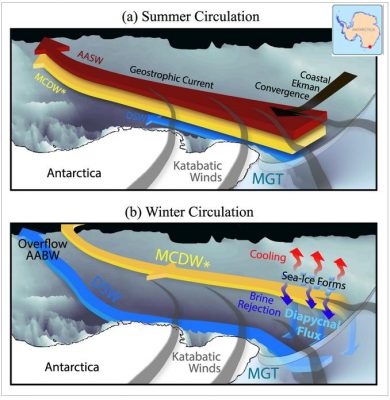
Antarctica is separated from the deep Southern Ocean by a shallow continental shelf. Waters are exchanged between the deep ocean and the shallow shelf, forming the Antarctic cross-shelf circulation: Very dense waters leave the shelf as Antarctic Bottom Water (AABW) that will then flow at the bottom of all oceans. Meanwhile, relatively warm water from the Southern Ocean, Modified Circumpolar Deep W ...[Read More]
Image of the Week – How ocean tides affect ice flow
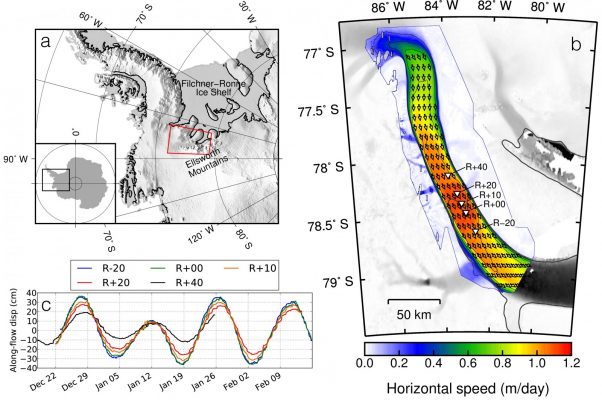
Ice streams discharge approximately 90% of the Antarctic ice onto ice shelves , and ultimately into the sea into the sea (Bamber et al., 2000; Rignot et al., 2011). Whilst flow-speed changes on annual timescales are frequently discussed, we consider here what happens on much shorter timescales! Previous studies have shown that ice streams can respond to ocean tides at distances up to 100km inland ...[Read More]
Marine Ice Sheet Instability “For Dummies”
MISI is a term that is often thrown into dicussions and papers which talk about the contribution of Antarctica to sea-level rise but what does it actually mean and why do we care about it? MISI stands for Marine Ice Sheet Instability. In this article, we are going to attempt to explain this term to you and also show you why it is so important. Background The Antarctic Ice Sheet represents the larg ...[Read More]
An Antarctic Road Trip
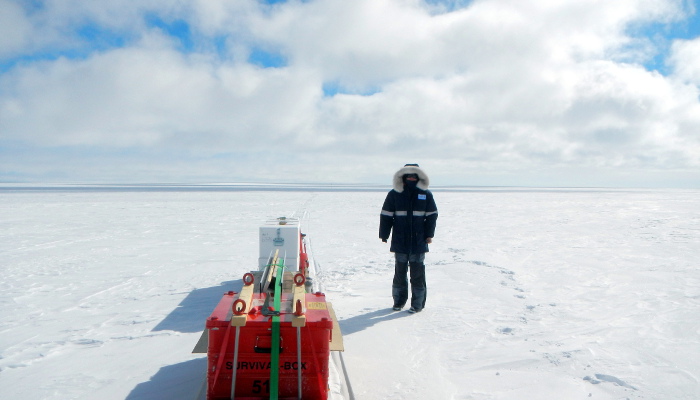
Working in the Arctic and Antarctic presents its own challenges. It is perhaps easy to imagine how a station situated close to the coast is resupplied: during the summer, one or more ships will arrive bringing fuel, food and equipment, but what about stations inland? Flying in supplies by aircraft is expensive and, in the case of large quantities of fuel, unsustainable. Besides, many stations are ...[Read More]
Image of the Week – Storing water in Antarctica to delay sea-level rise
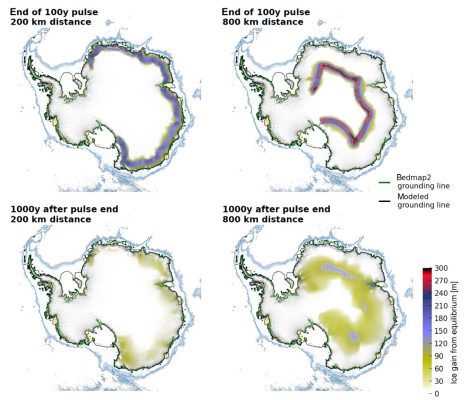
Sea level rise Sea-level rise is one of the main impacts of the current global warming and its rate has dramatically increased in the last decades (the current rate is about 3 mm per year). Even if greenhouse gas emissions were stopped today, sea level would continue to rise due to the slow Earth climate system response (IPCC, 2013, chap. 13). It is therefore a considerable threat for popul ...[Read More]

