Today’s Image of the Week shows annual ice flow velocity mosaics at 1km resolution from 2005 to 2016 for the Antarctic ice sheet. These mosaics, along with similar data for Greenland (see Fig.2), were published by Mouginot et al, (2017) last month as part of NASA’s MEaSUREs (Making Earth System Data Records for Use in Research Environments) program. How were these images constructed? The mosaics s ...[Read More]
A year at the South Pole – an interview with Tim Ager, Research Scientist
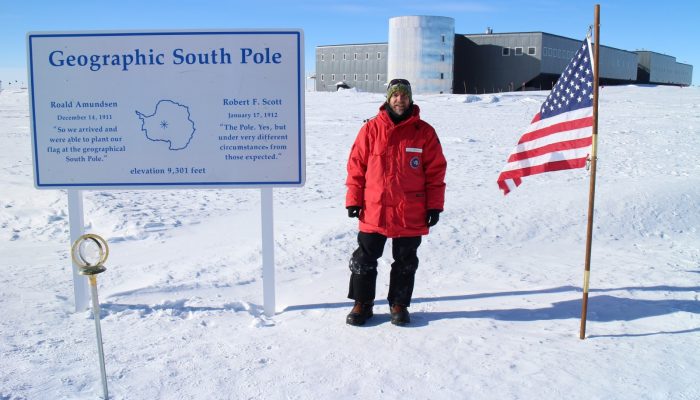
What is it like to live at the South Pole for a year? A mechanical engineer by trade, Tim Ager, jumped at the opportunity to work for a year as a research scientist at Amundsen-Scott South Pole Station. When not traveling on various adventures he lives in Austin, Texas, and recently took the time to answer a few questions about his time at Pole. What goes on at Amundsen-Scott South Pole Station? ...[Read More]
Image of the Week — Hidden lakes in East Antarctica !
Who would have guessed that such a beautiful picture could get you interviewed for the national news?! Certainly not me! And yet, the photo of this englacial lake (a lake trapped within the ice in Antarctica), or rather science behind it, managed to capture the media attention and brought me, one of the happy co-author of this study, on the Belgian television… But what do we see on the pic ...[Read More]
Quantarctica: Mapping Antarctica has never been so easy!
One of the most time-consuming and stressful parts of any Antarctic research project is simply making a map. Whether it’s plotting your own data points, lines, or images; making the perfect “Figure 1” for your next paper, or replying to a collaborator who says “Just show me a map!,” it seems that quick and effective map-making is a skill that we take for granted. However, finding good map data and ...[Read More]
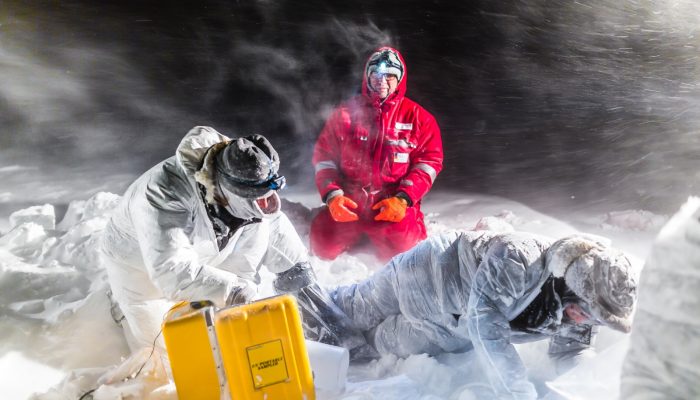
Image of the Week – Apocalypse snow? … No, it’s sea ice!
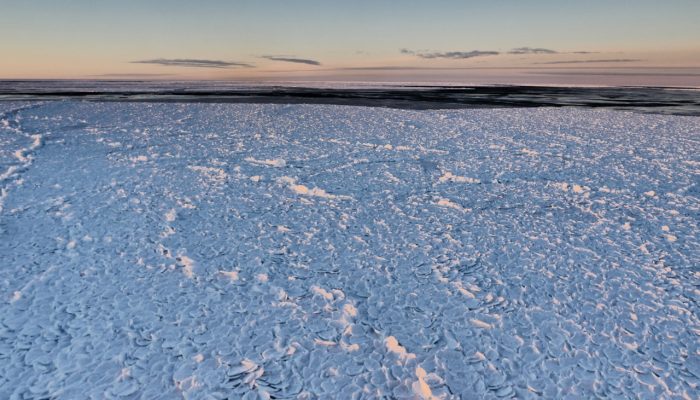
Sea ice brine sampling is always great fun, but sometimes somewhat challenging ! As sea water freezes to form sea ice, salts in the water are rejected from the ice and concentrate in pockets of very salty water, which are entrapped within the sea ice. These pockets are known as “brines”. Scientists sample these brines to measure the physical and bio-geochemical properties, such as: tem ...[Read More]
Image of the Week — Looking back at 2016
I cannot believe that a full year has passed since this very cute pink unicorn wished you a Happy New Year. Yet, over the past 12 months our blog has attracted more than 16,200 visits. And the blog analytics show that you, our dear readers, are based not only in Europe but literally all over the world! With 67 new posts published in only 52 weeks, it’s more than likely that you missed a few inte ...[Read More]
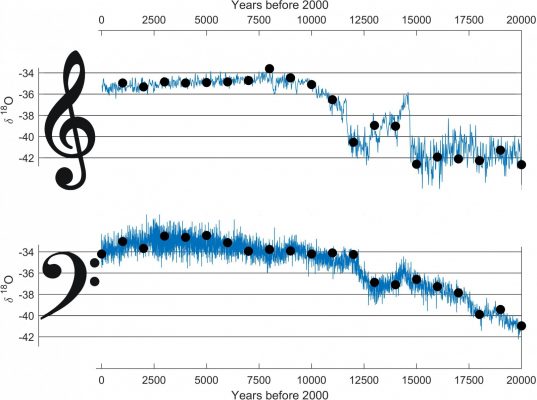
Image of the Week – The Sound of an Ice Age
New Year’s Eve is just around the corner and the last “image of the week” of 2016 will get you in the mood for a party. If your celebration needs a soundtrack with a suitably geeky touch then look no further. Here is the music for climate enthusiasts: The sound of the past 60,000 years of climate. Scientist Aslak Grinsted (Centre for Ice and Climate, University of Copenhagen, Denmark) has transfor ...[Read More]
Image of the Week — Allez Halley!
On the Brunt Ice Shelf, Antarctica, a never-observed-before migration has just begun. As the pale summer sun allows the slow ballet of the supply vessels to restart, men and machines alike must make the most of the short clement season. It is time. At last, the Halley VI research station is on the move! Halley, sixth of its name Since 1956, the British Antarctic Survey (BAS) has maintained a resea ...[Read More]
Ice Cores “For Dummies”
Ice cores are important tools for investigating past climate as they are effectively a continuous record of snowfall, which preserves historical information about climate conditions and atmospheric gas composition. In this new “For Dummies” post, we discuss the history and importance of ice-core science, and look at the way we can use ice core chemistry to reconstruct past climate. Ice sheets, arc ...[Read More]
Image of the Week – Blood Falls!
If glaciers could speak, you might imagine them saying – “HELP!” The planet continues to warm and this means glaciers continue to shrink. Our new image of the week shows a glacier that appears to be making this point in a rather dramatic and gruesome way – it appears to be bleeding! If you went to the snout of Taylor Glacier in Antarctica’s Dry Valley region (see map ...[Read More]